 ;
;
Animated Wind Drawings
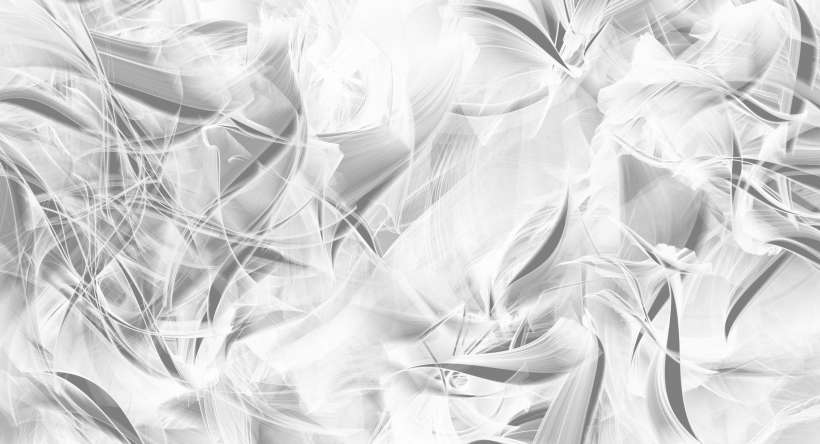
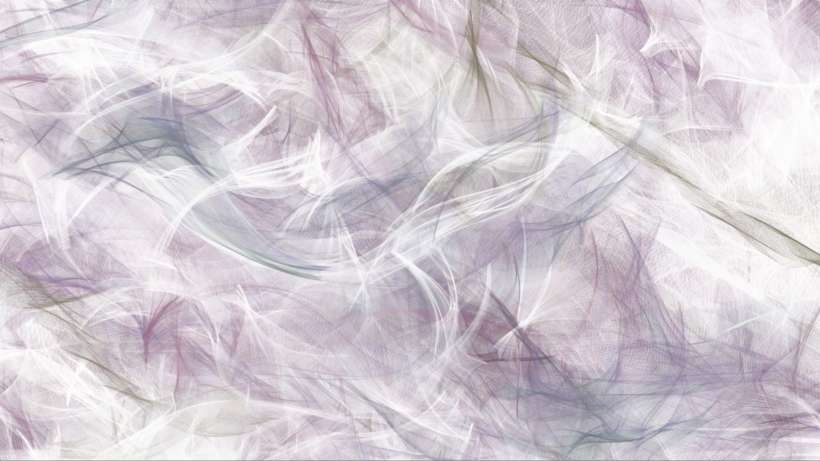
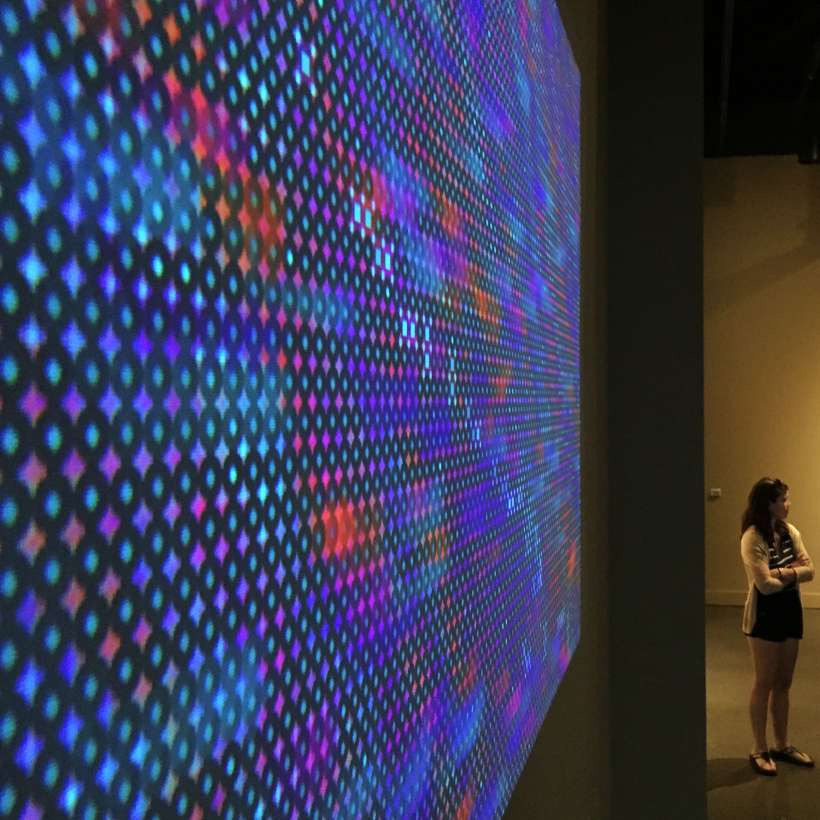
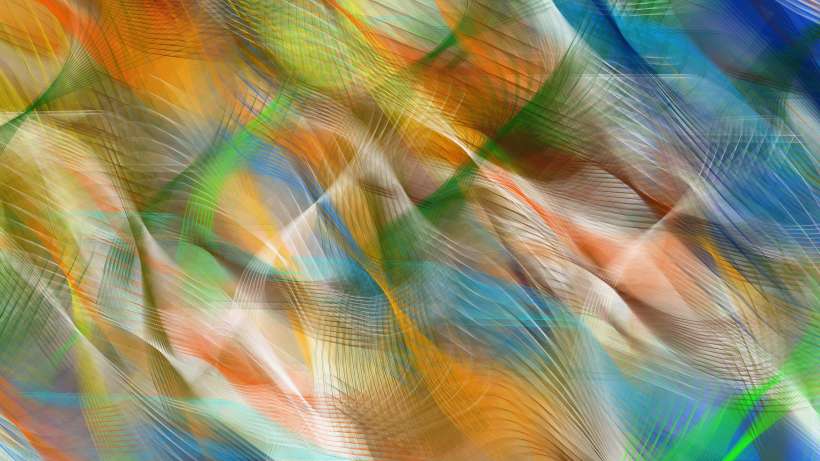
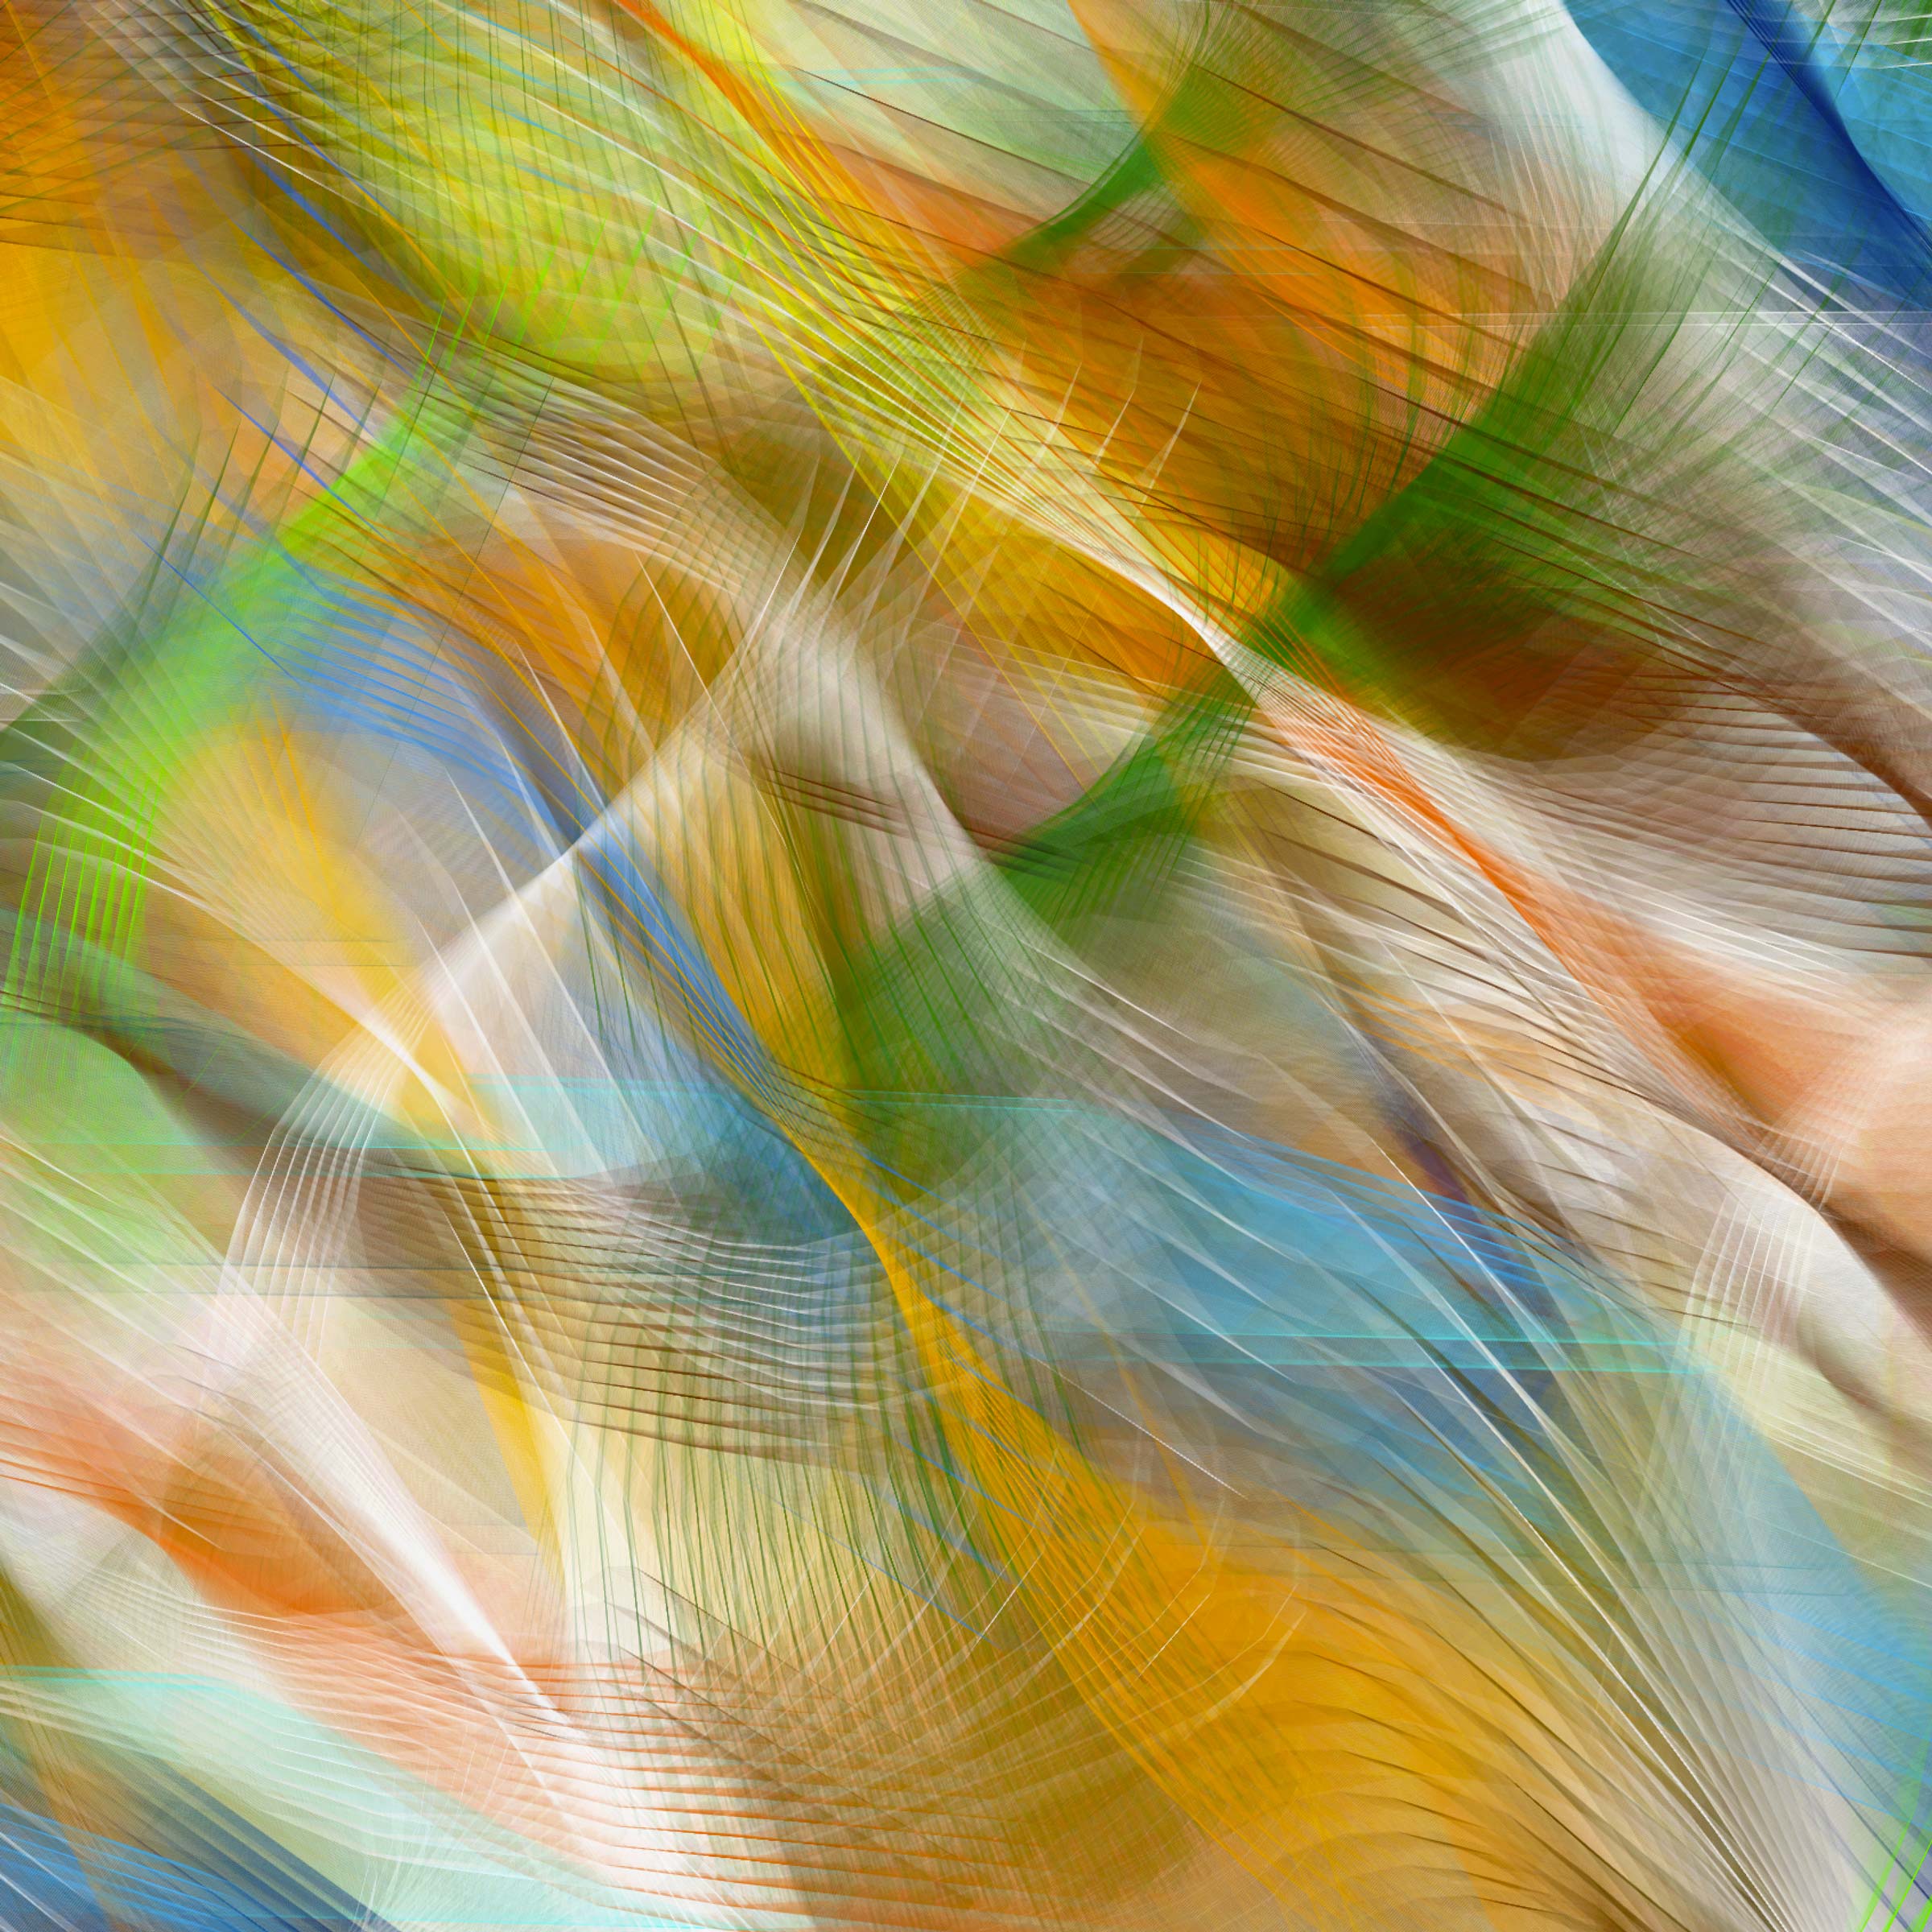
These dynamic wind drawings are generated in real-time using weather instruments and custom electronics to capture data about wind conditions and transmit them to a computer. The computer then interprets the data and generates an animated drawing for presentation on a screen or as a projection.
Each animated wind drawing uses a discrete process to generate the visualization of wind conditions. The first process I developed, Air Current(s), made its debut at the Asheville Art Museum in 2012 as part of its Prime Time: New Media Juried Exhibition. Weather instruments on the roof of the museum were connected to a computer inside the gallery by a very long cable.
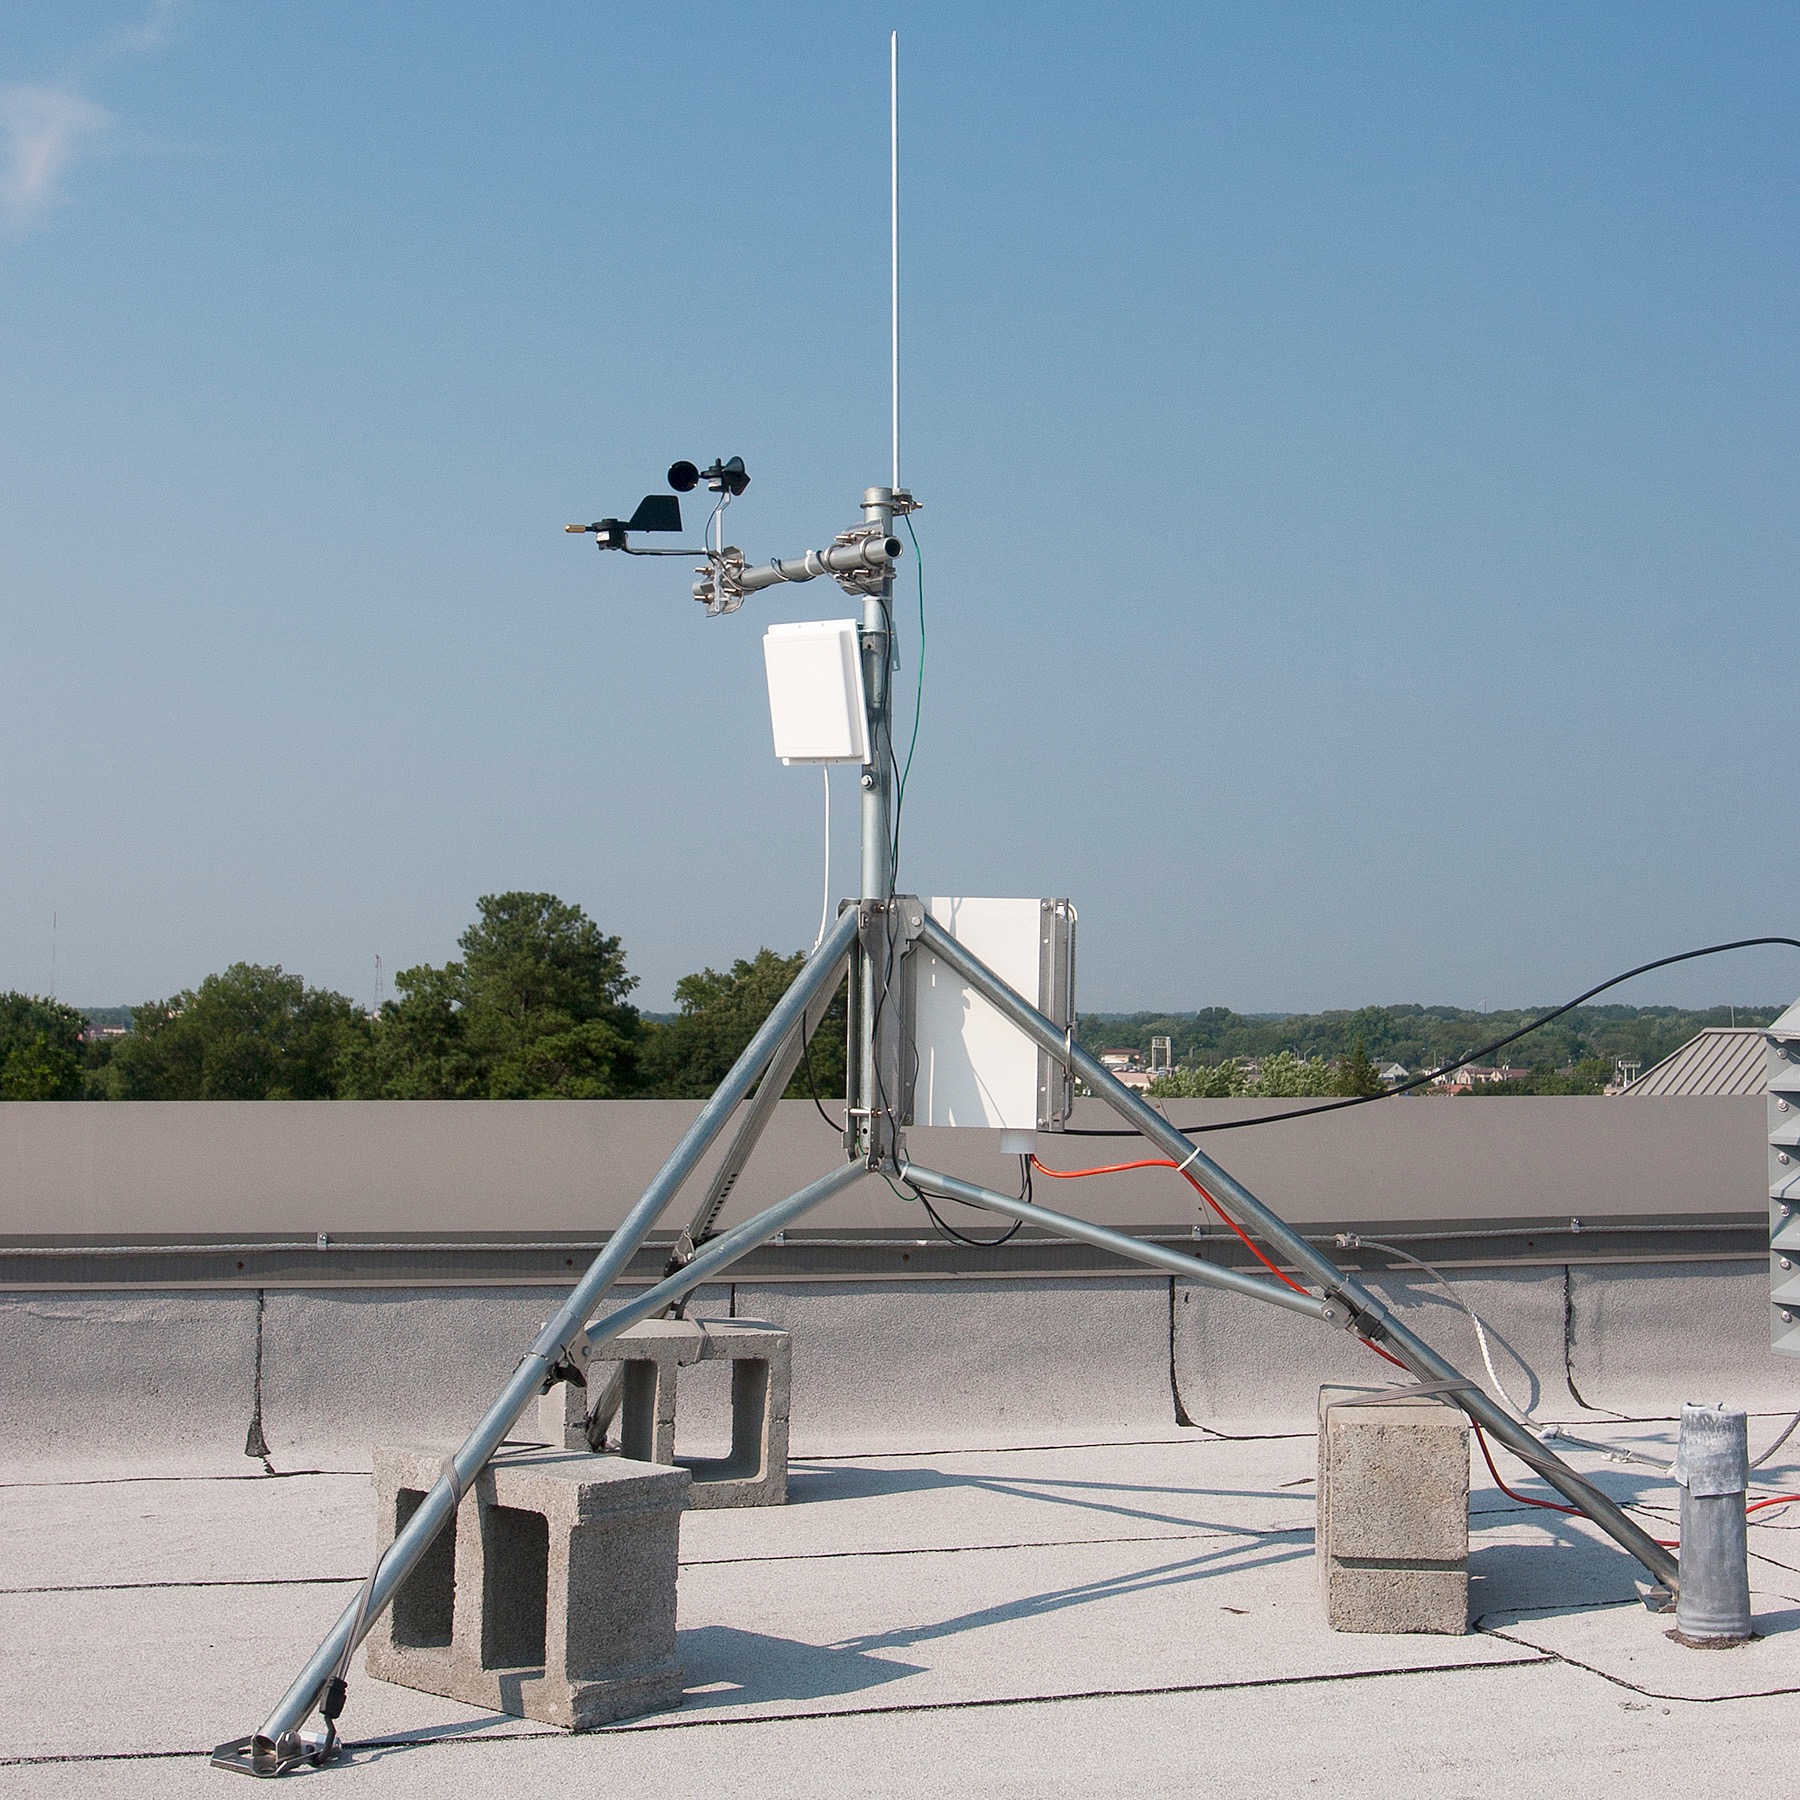 Weather instruments on a roof at Salisbury UniversitySince then, weather data is transmitted wirelessly thanks to a retooling of the project in 2013 when I was commissioned to present Air Current(s) as part of Absolut's Open Canvas in the Williamsburg neighborhood of Brooklyn, New York. Later that year, the project was on view in “This Land” at Salisbury University in Maryland. For the exhibition catalog, Dr. James Hatley write the following:
Through the digital arts informed by computer software, data recording and image projection, Mark Nystrom’s alchemical transformation of the winds blowing over the roof of Fulton Hall is not only beautiful in its aesthetic impact but also deeply informative of the remarkable complexity of the wind’s movement, its mercurial gestures with their varying intensities and orientations. All too often the living world has become a vague presence to the denizens of contemporary technocratic culture, who have all too often reduced the earth to a green blur passing by its car windows, or an entertaining flickering of colors and shapes on a computer screen. But in Air Current(s) Nystrom, rather than abjuring the omnipresent technological processing of the living world characterizing our time has challenged himself and his audience to embrace it in a manner that is more rather than less heedful of the land and its many subtle qualities. Electronically illuminated screens need not always be a way of veiling or blunting our interaction with the elements of land. They can also uncover truths about it that would otherwise go unnoticed.
What started as a visualization of real-time wind conditions has expanded to visualizations of historical conditions (and sometimes both). Each time one of the real-time projects is installed, the wind data is saved to later be used as a raw material for works generated with different processes.
