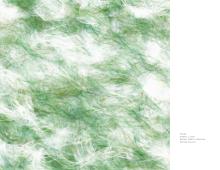
Air Current(s) 2.0
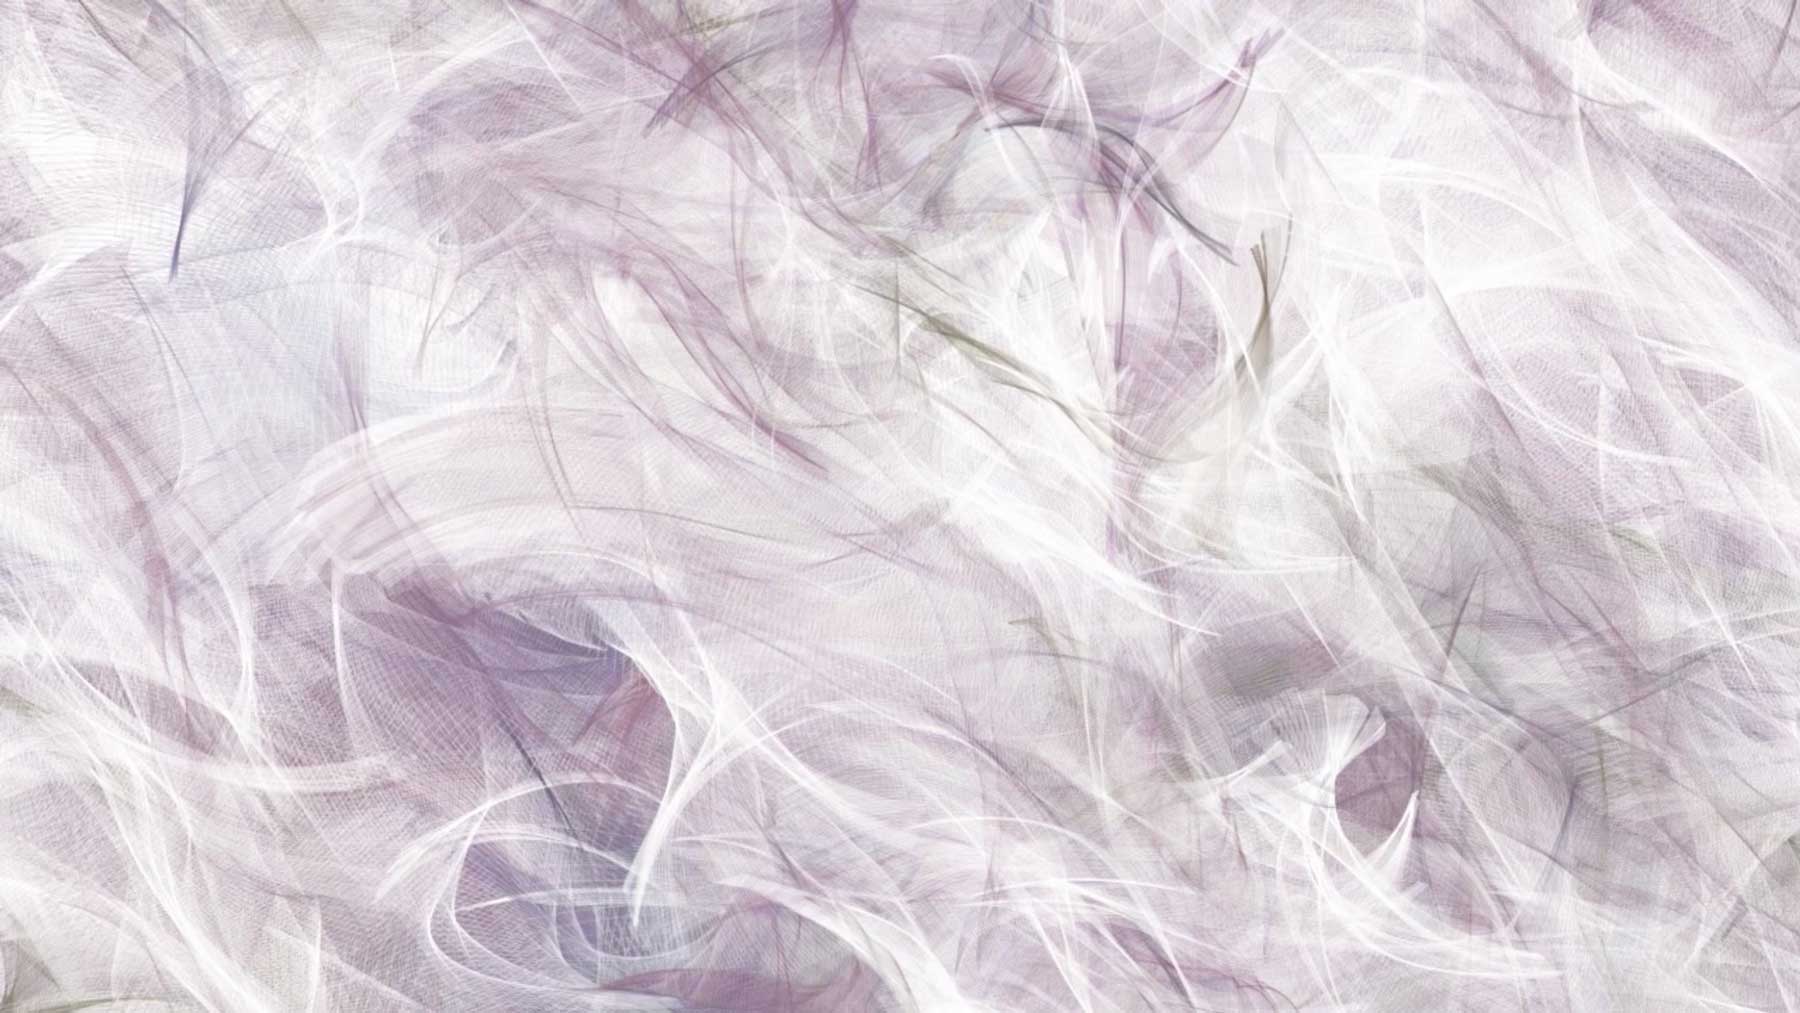
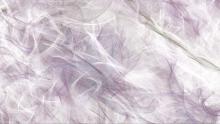
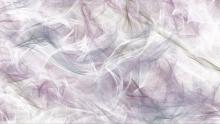
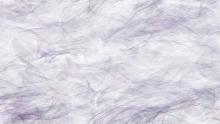
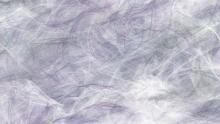
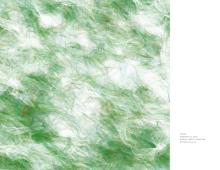
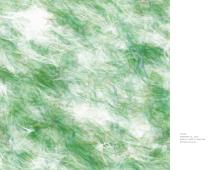
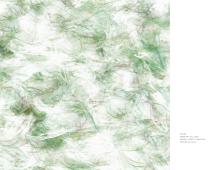
A 2014 installation of Air Current(s) at Duke University's Wegner Gallery in Environment Hall gave me an opportunity to develop a modified version of the drawing process used by Air Current(s). By using curves instead of closed shapes and keying color to wind direction, viewers gain a better understanding of recent wind conditions.
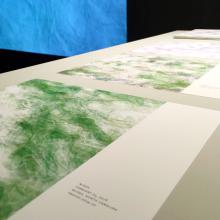
During an installation in the “2016 Department of Art Biennial” at the Turchin Center for Visual Arts, wind data was saved and used to generate a wind drawing made with Process.2014.10 for each day of the exhibition. The prints were then displayed in the gallery near a projection of the piece.
Live versions use weather instruments and custom electronics to capture wind data and pass it along to a computer in a gallery that generates the drawing in real-time.
Versions that use historical data use wind data found online. Either a computer in a gallery generates the drawing or a video is presented. During the "Scientificous" exhibition at Manifest in Cincinnati, a computer generated an animated drawing that used a whole year of data.
Video
