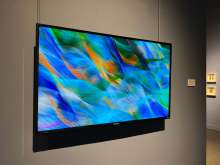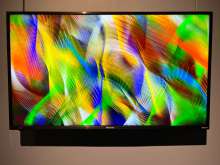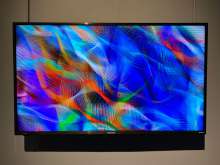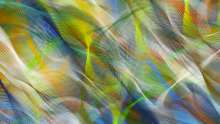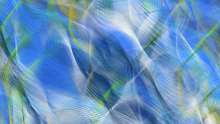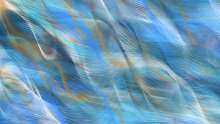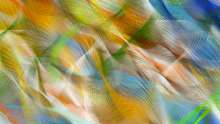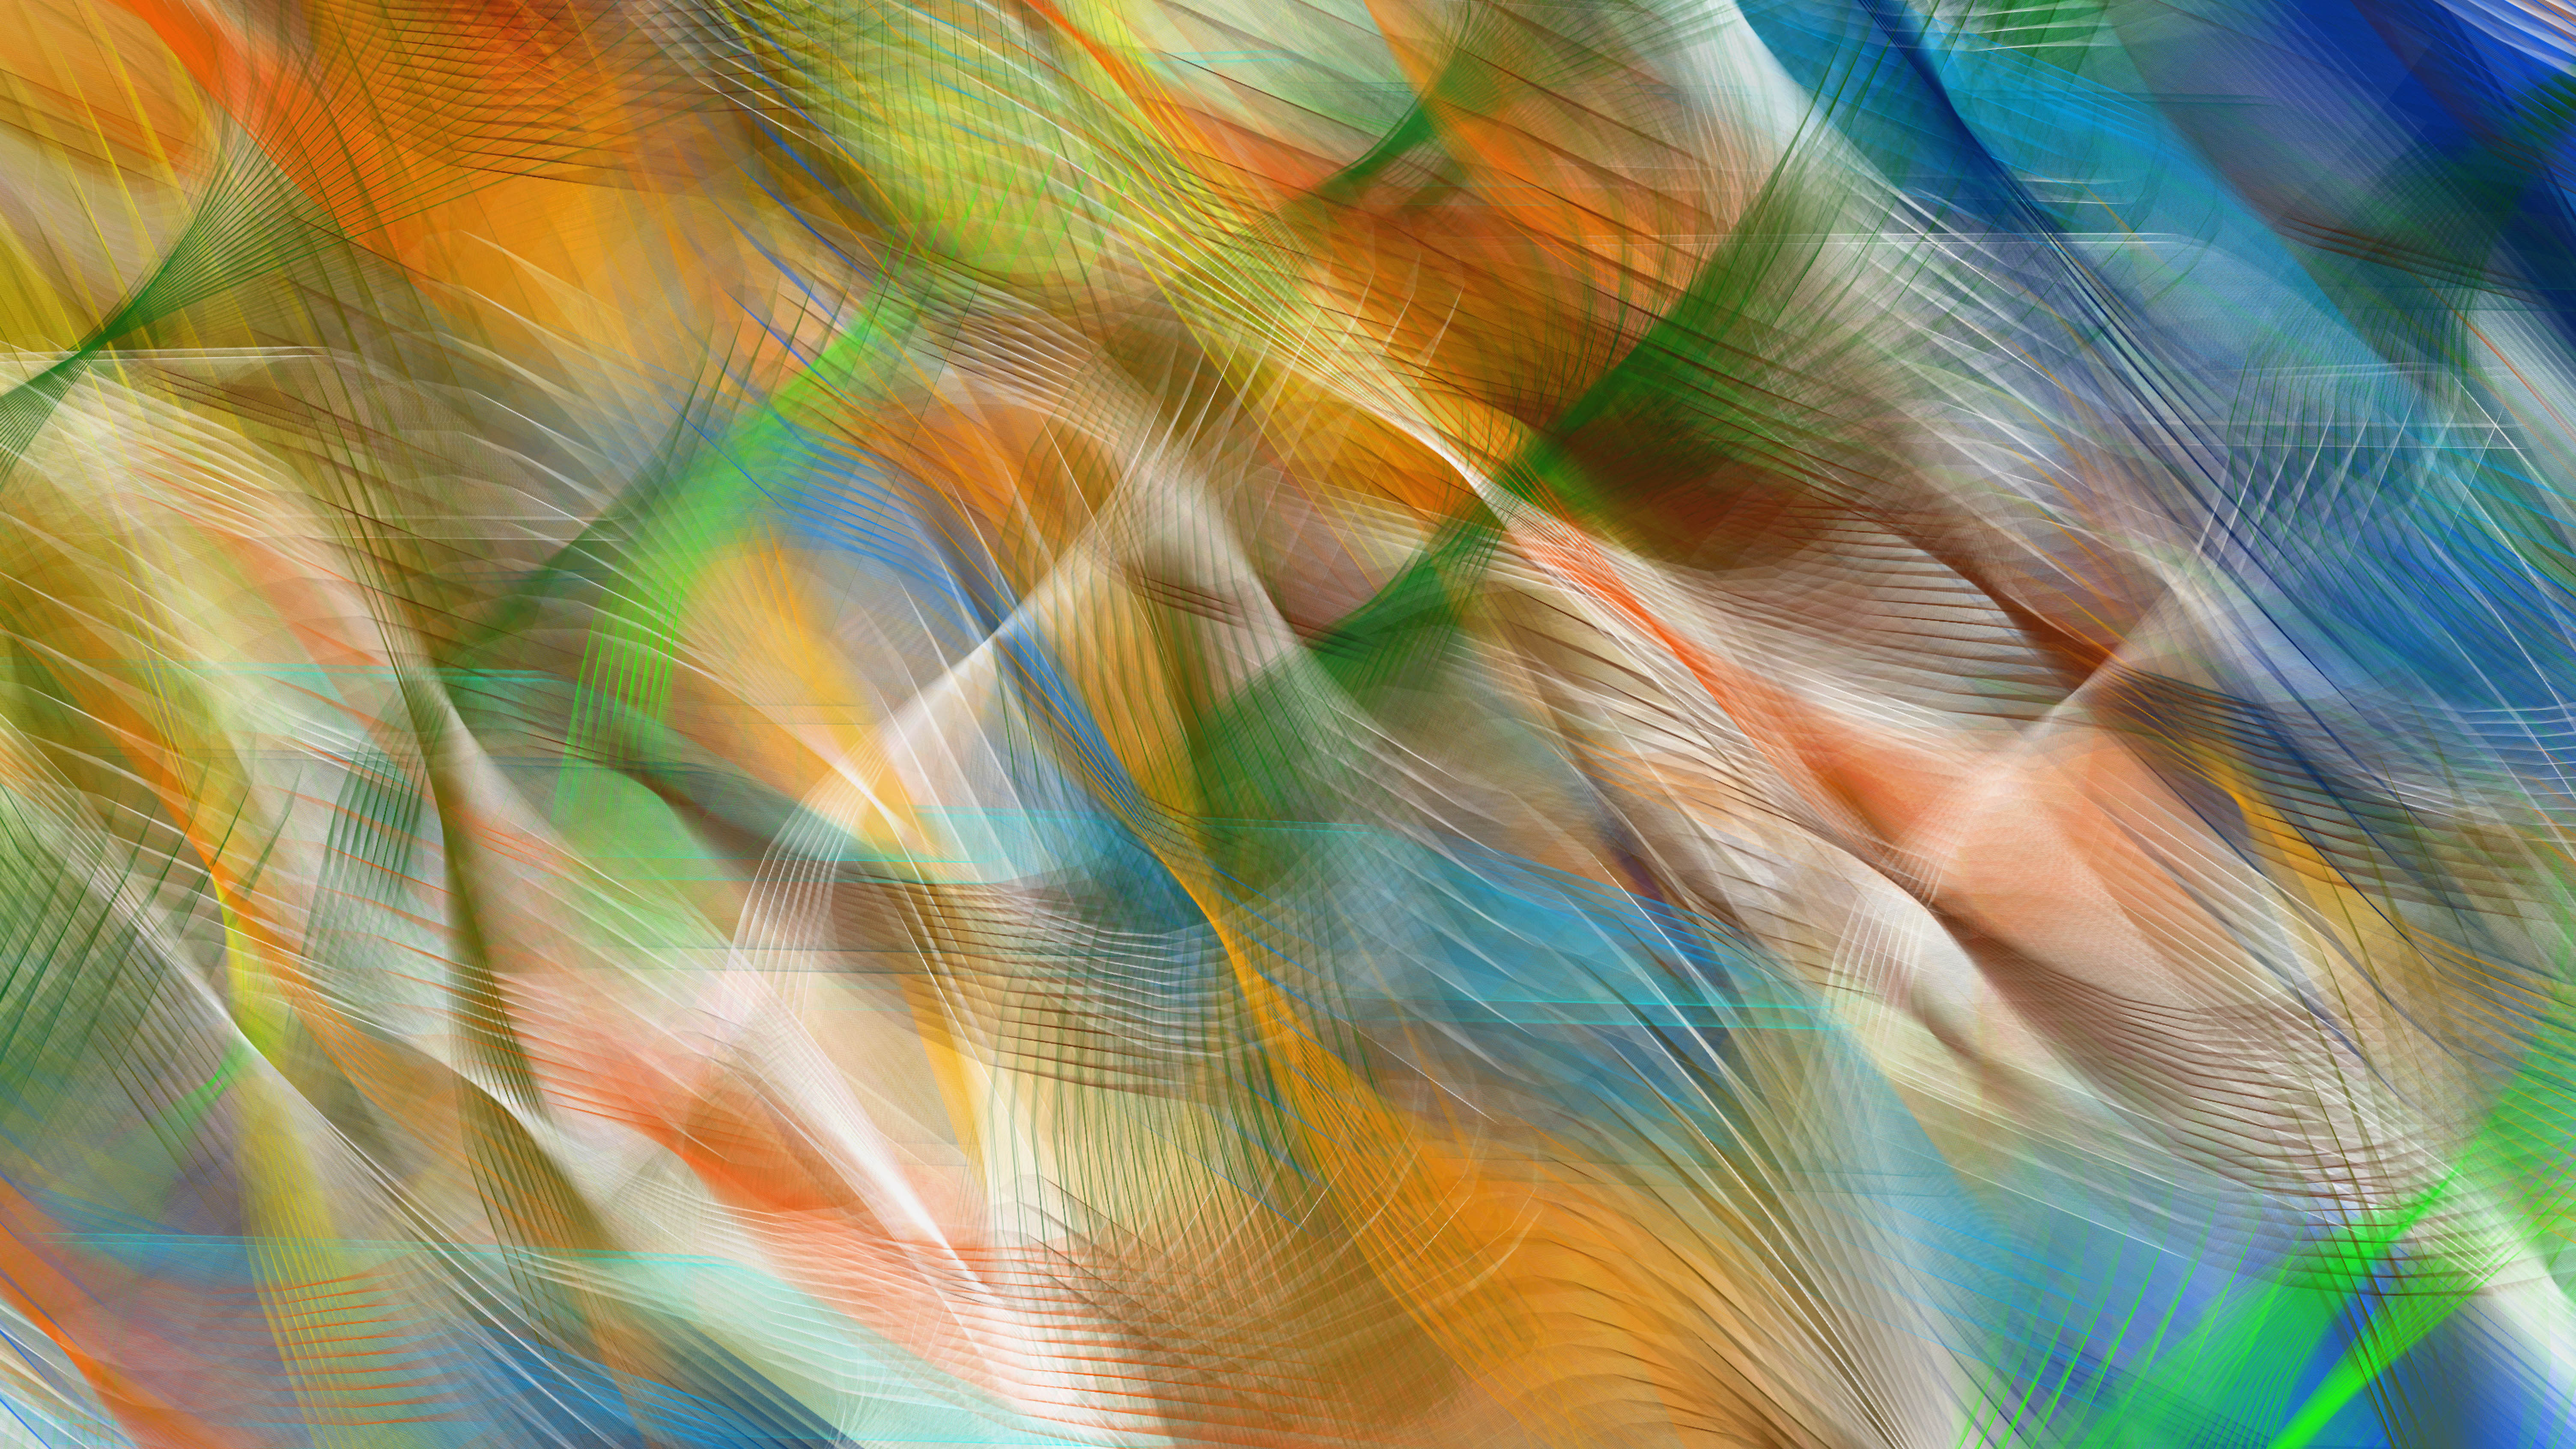
Winds / At this time of day / On this date / Every year from 2007 to 2022 / Boone, North Carolina
I've always enjoyed comparing wind drawings generated with data from different dates based on the same process. While developing one of my wind drawing processes, I try to create one that generates an aesthetically pleasing drawing no matter which date is used to generate the drawing.
With this particular process, I was interested in visualizing wind conditions at the same time on the same date, but simultaneously on different years. Since the factors that determine the wind's direction and strength are impacted by the time of day and day of the year, I was curious about what this process would show. I wanted viewers to be able to see wind conditions at the time they viewed the piece … and also the year before … and the year before that and so on.
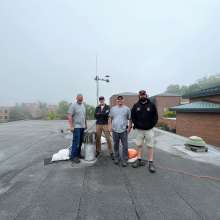
I first moved to Boone in 2007 and as a sort of homage to its winds, I used archive data from each year I lived there and live data gathered by weather instruments for 2022.
As a viewer follows the movement of lines relating to one year, the sense the motion of lines relation to other years and, in a way, are looking through time.
With this process clusters of regularly spaced apart curves move across the screen. The amount of curves in each cluster relate to the year it relates to. The more curves in a cluster, the more recent it is. 2007 has one curve, while 2022 has sixteen. Each year has a set number of clusters relating to it and all clusters for a year move according to wind conditions at the month, day, hour, minute and second of the year it relates to. Finally, the curves color is keyed to wind direction, but a few clusters for each year are either darker or lighter in color.
As with my other animated wind drawing processes, the direction and speed of movement relate to wind conditions. Winds from the east, for example, push design elements from left to right and faster winds make the design elements move faster.
Video

