
Winds.Process.2022.02
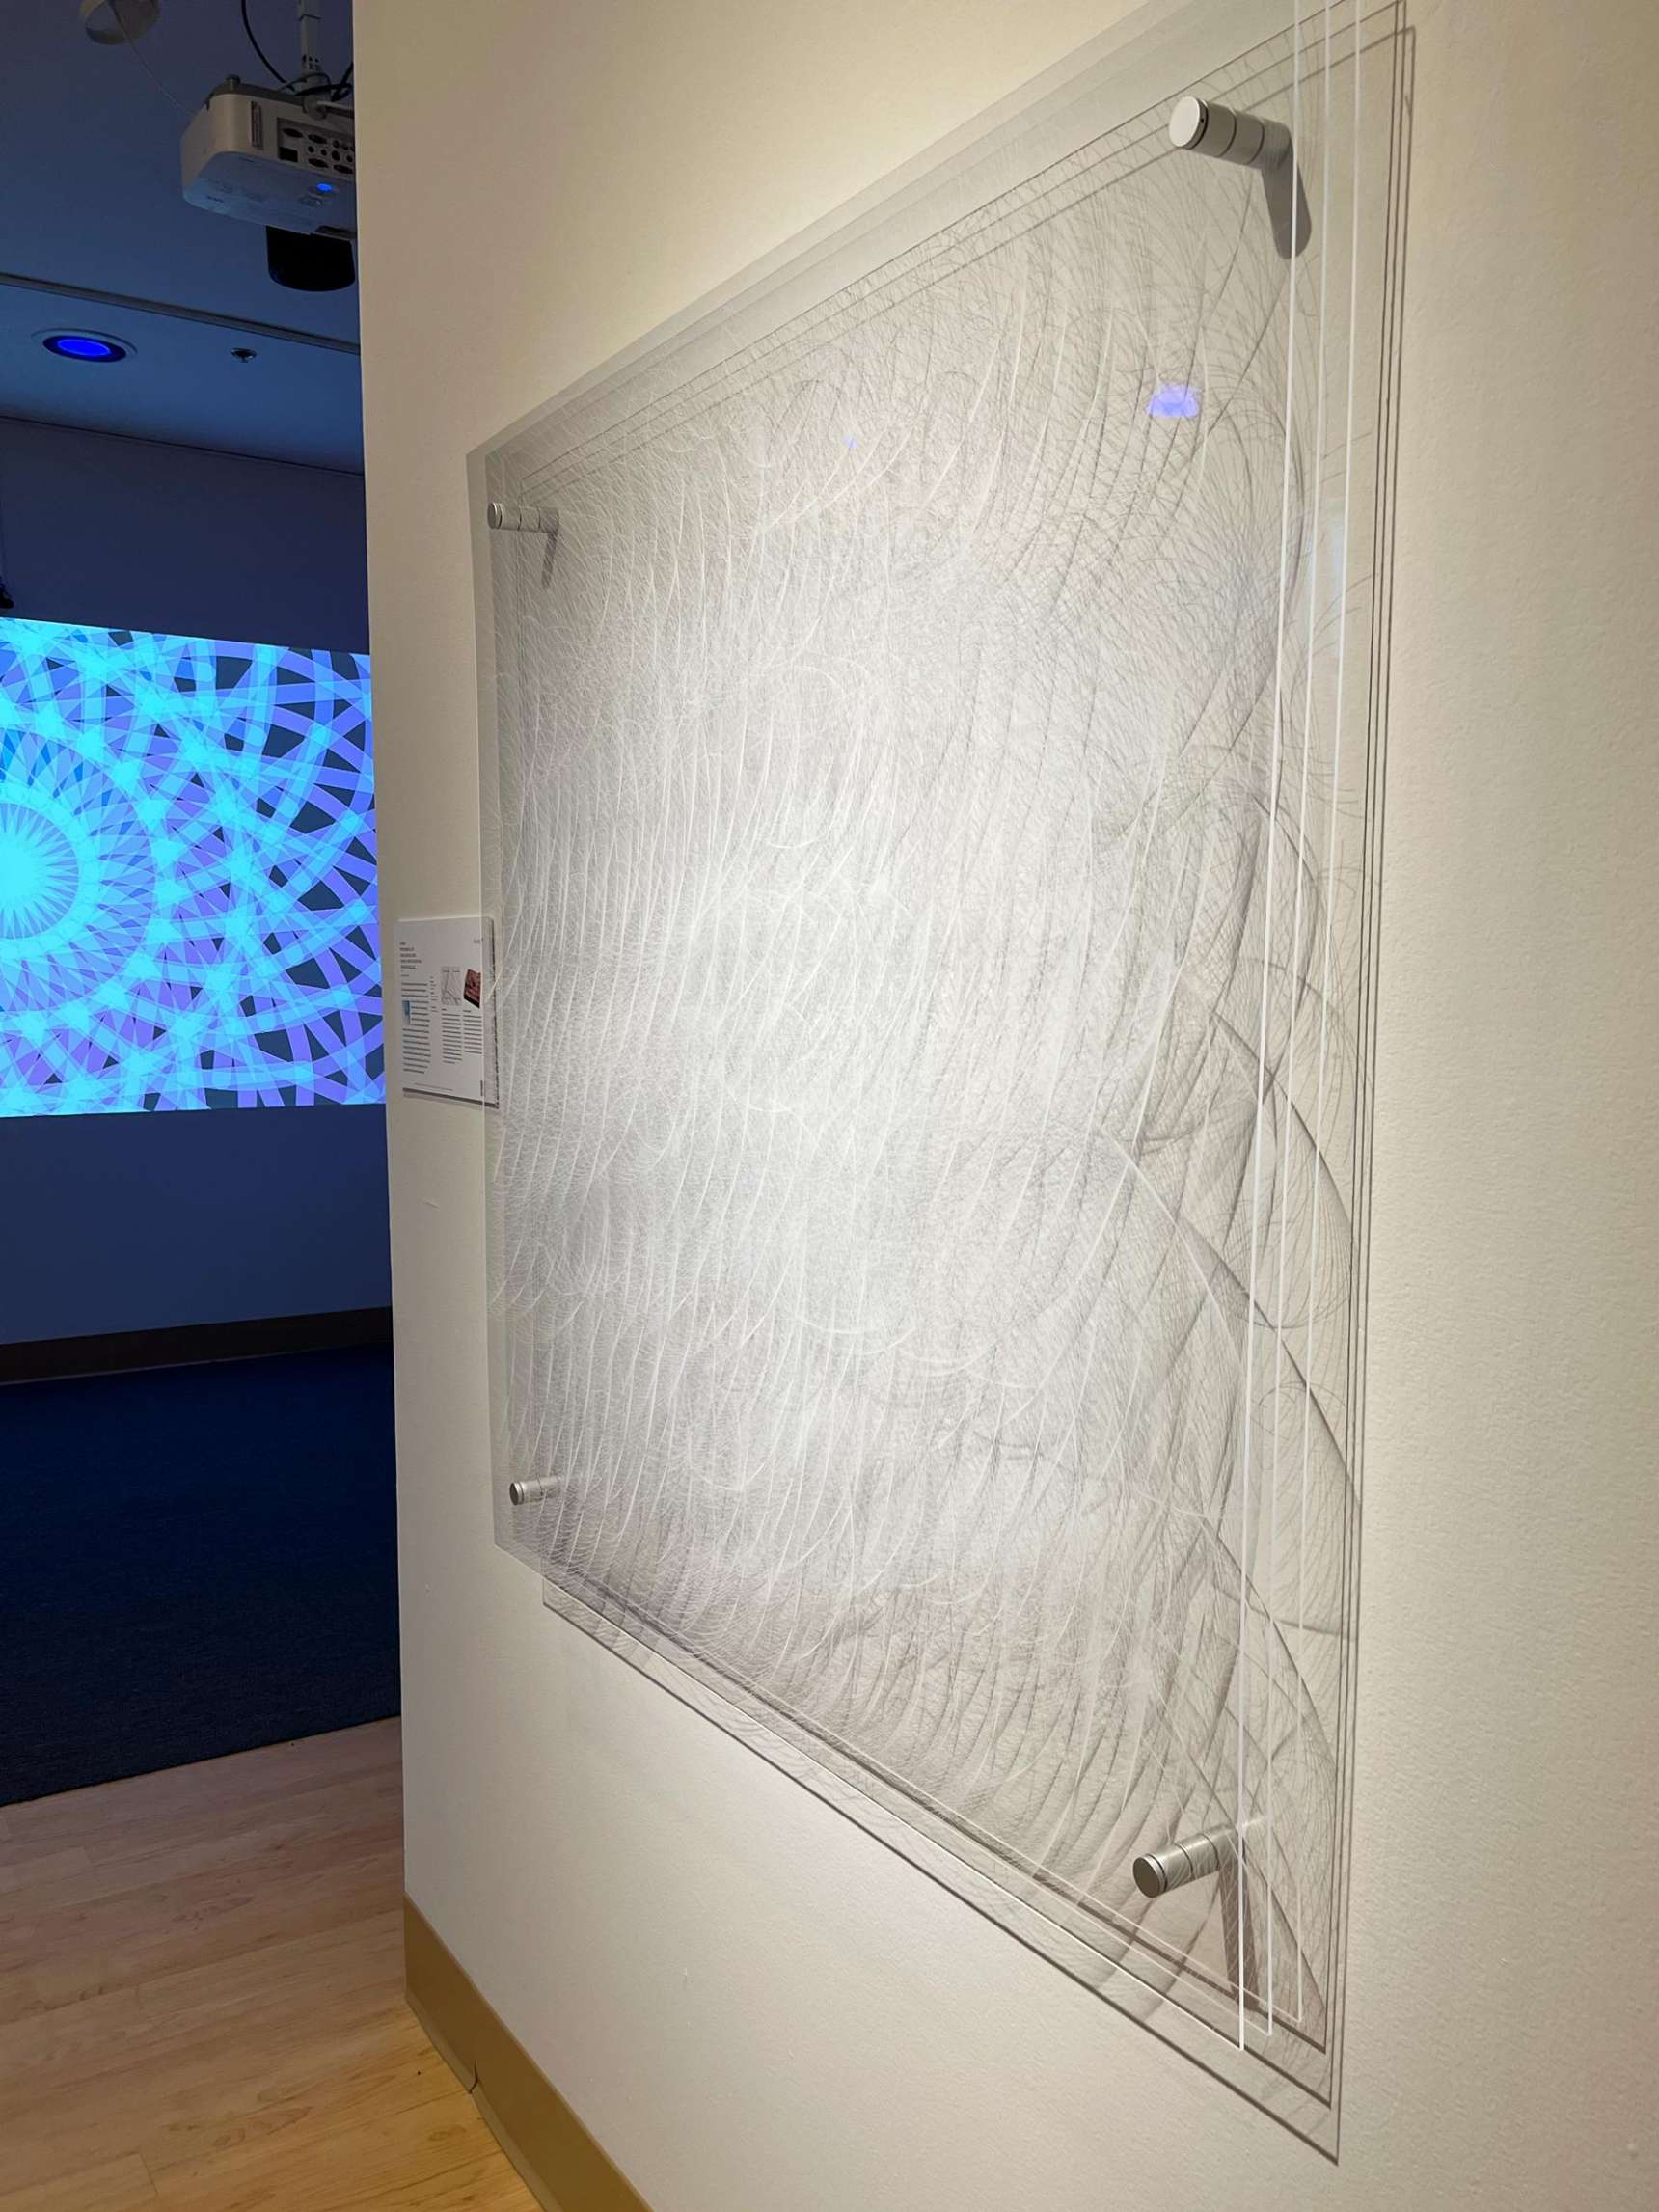
With this process, I wanted to show wind conditions at one location through time. Each layer of plexiglass is etched with a design showing wind conditions in at a location for every hour on twenty-four consecutive days. The outermost layer's design was generated with the most recent data. Designs for the other layers, going back in time a year per layer, were generated with data from the same days.
In the piece showing winds in Boone, North Carolina from November 4–28, the outermost layer used data from 2021. Viewers of the top-left most spot would see winds at midnight on November 4, 2021 on top of winds at midnight on November 4, 2020 and then 2019.
Using weather data from an online source, I wrote software in Processing to generate a composition that visualizes Boone’s wind conditions for each hour over twenty-four days. Each hour’s average wind speed and direction are represented by a set of arcs. The number of arcs represent miles per hour and the arcs’ degree of rotation is keyed to wind direction. Arc rotations were limited to sixteen angles.
Processing created a PDF filled with arcs which was brought into Rhino. Using the RhinoCAM plugin, tool paths were defined to create files that controlled the engraving process on a ShopBot CNC router.
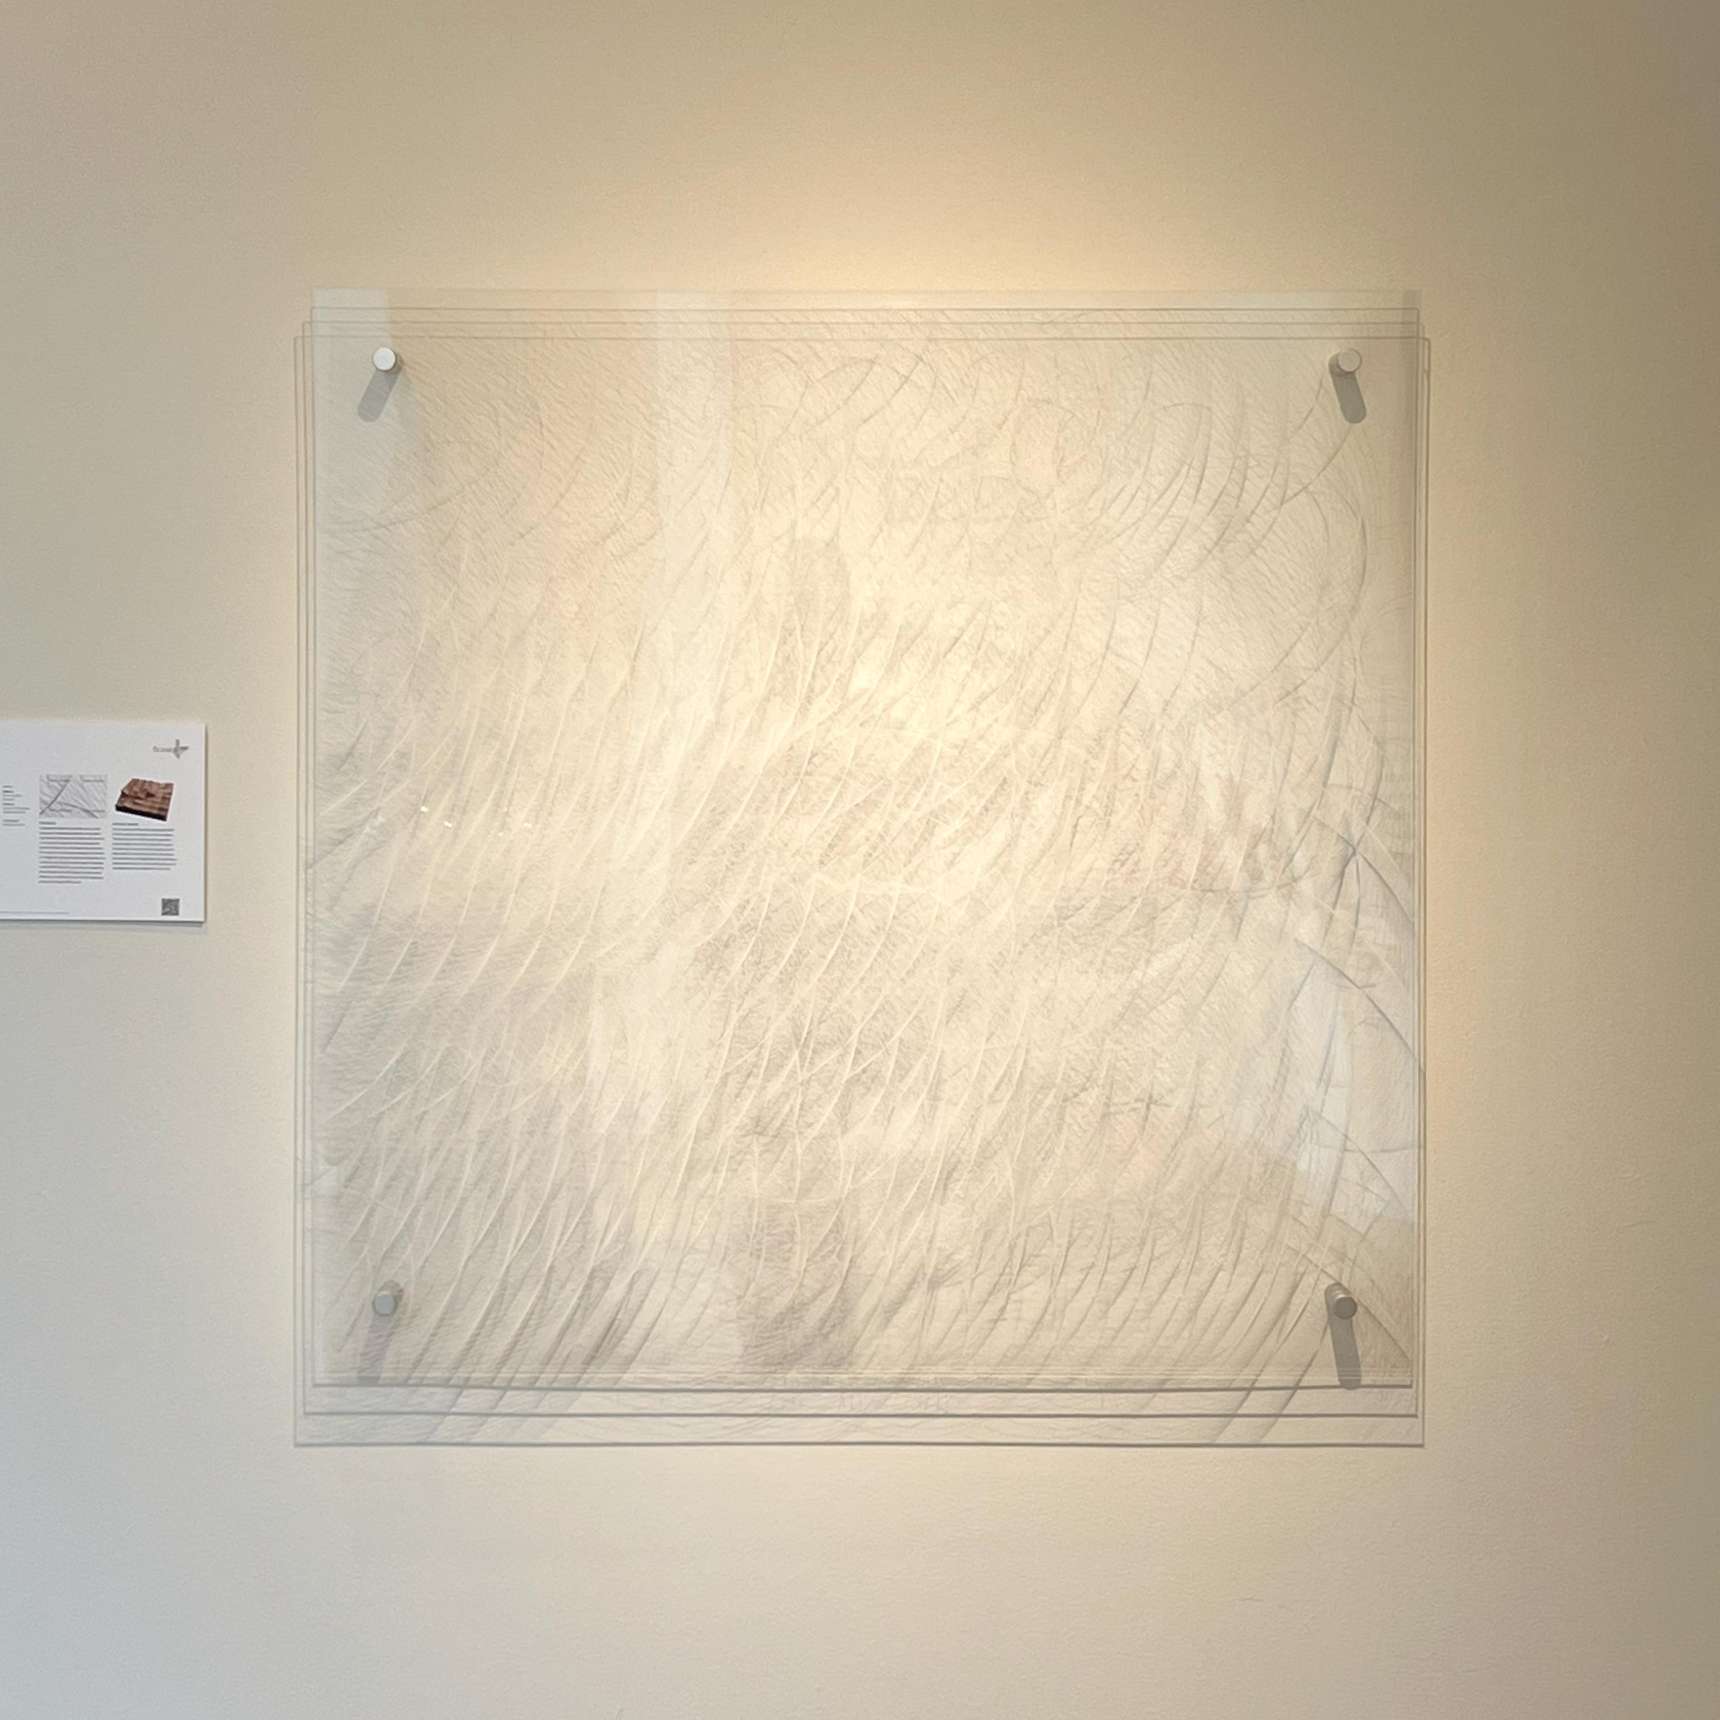
![Winds / November 4–28 2019, 2020 & 2021/ Boone, North Carolina/ Process.2022.02 [ Detail ]](http://www.marknystrom.com/devmns/sites/default/files/styles/drimage_1720_0/public/2023-03/IMG_9453.jpg?itok=MKDsH8r0)
![Winds / November 4–28 2019, 2020 & 2021/ Boone, North Carolina/ Process.2022.02 [ Detail ]](http://www.marknystrom.com/devmns/sites/default/files/styles/drimage_1720_0/public/2023-03/IMG_9464.jpg?itok=pJC0GB_i)
![Winds / November 4–28 2019, 2020 & 2021/ Boone, North Carolina/ Process.2022.02 [ Detail ]](http://www.marknystrom.com/devmns/sites/default/files/styles/drimage_1720_0/public/2023-03/IMG_9467.jpg?itok=XKb-dbpB)
![Winds / November 4–28 2019, 2020 & 2021/ Boone, North Carolina/ Process.2022.02 [ Detail ]](http://www.marknystrom.com/devmns/sites/default/files/styles/drimage_1720_0/public/2023-03/IMG_9815.jpg?itok=UzfoYnyo)
![Winds / November 4–28 2019, 2020 & 2021/ Boone, North Carolina/ Process.2022.02 [ Detail ]](http://www.marknystrom.com/devmns/sites/default/files/styles/drimage_1720_0/public/2023-03/IMG_9474.jpg?itok=vo3rRjcp)