Winds.Process.2015.06
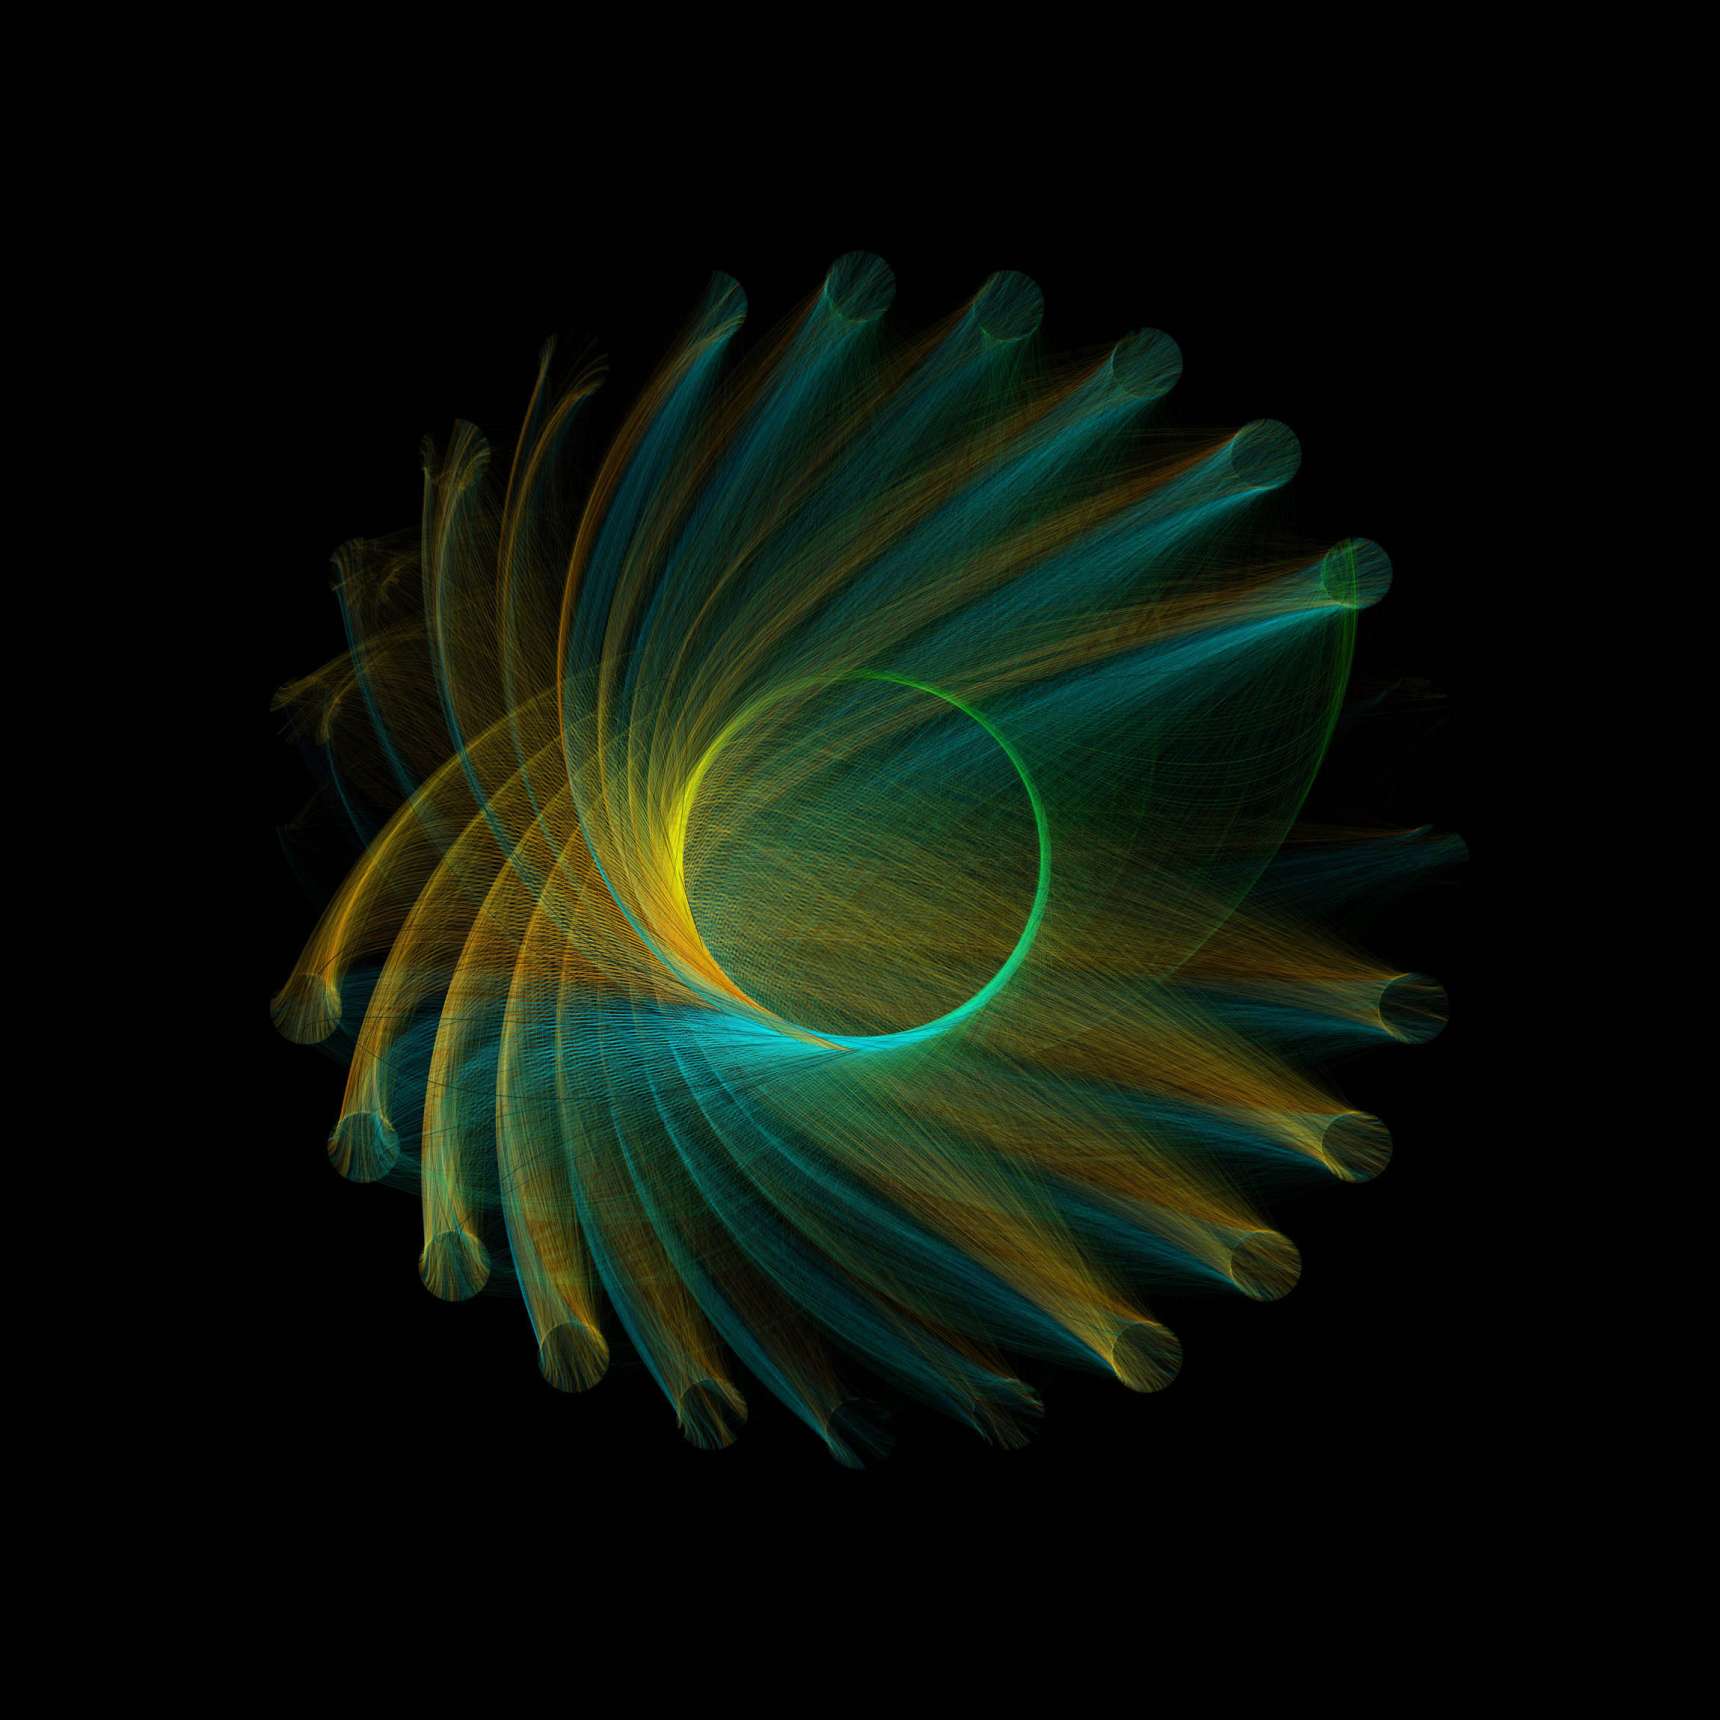
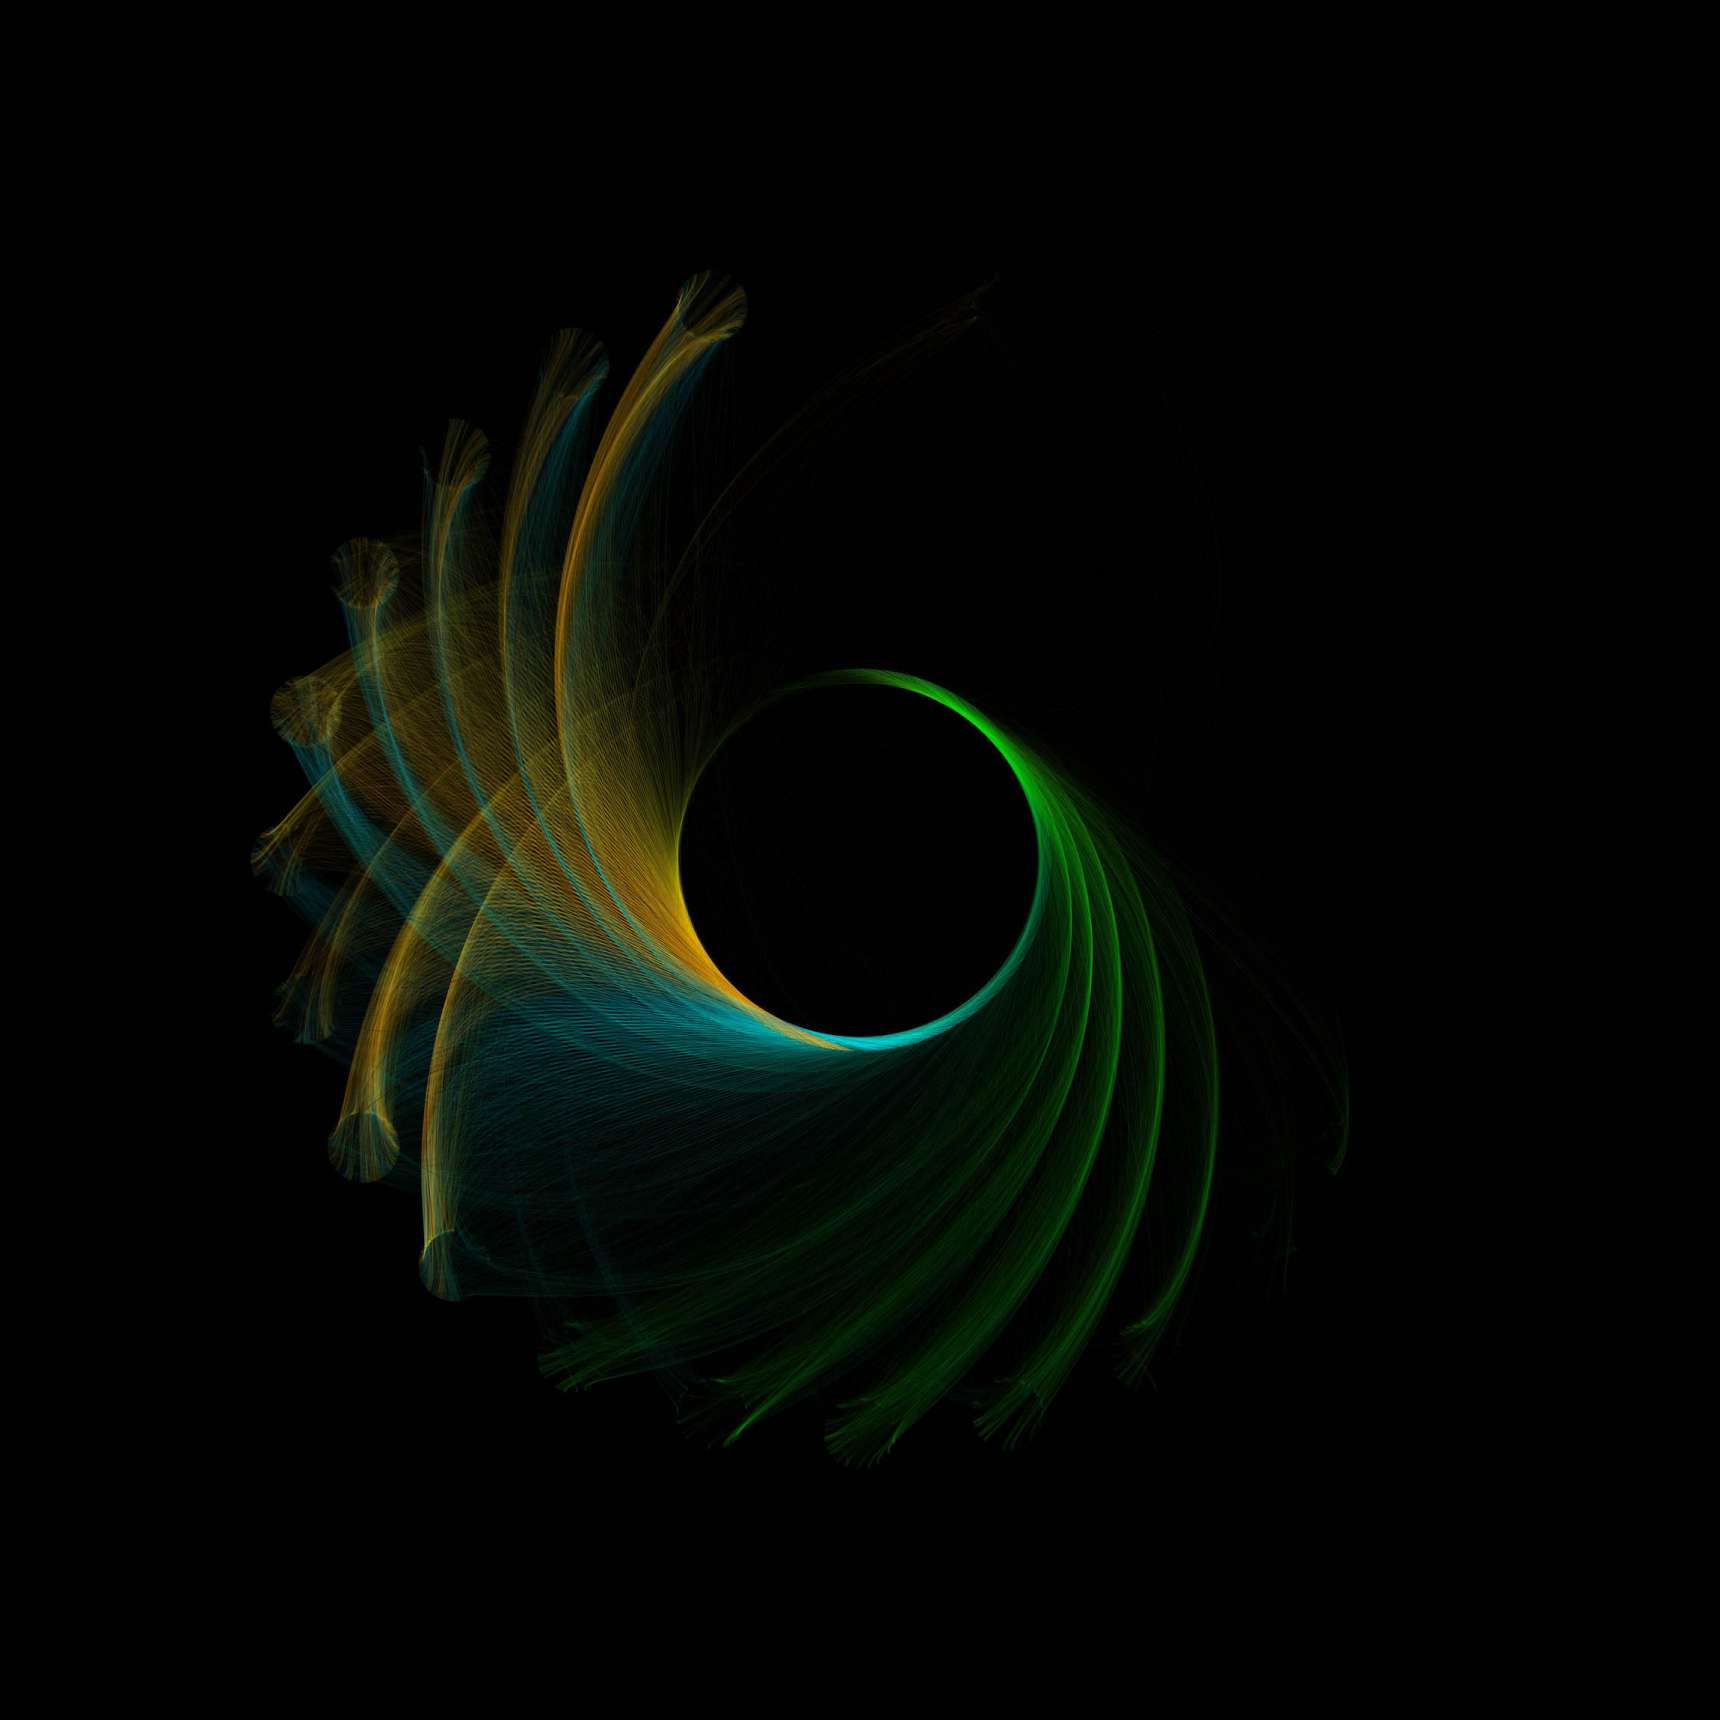
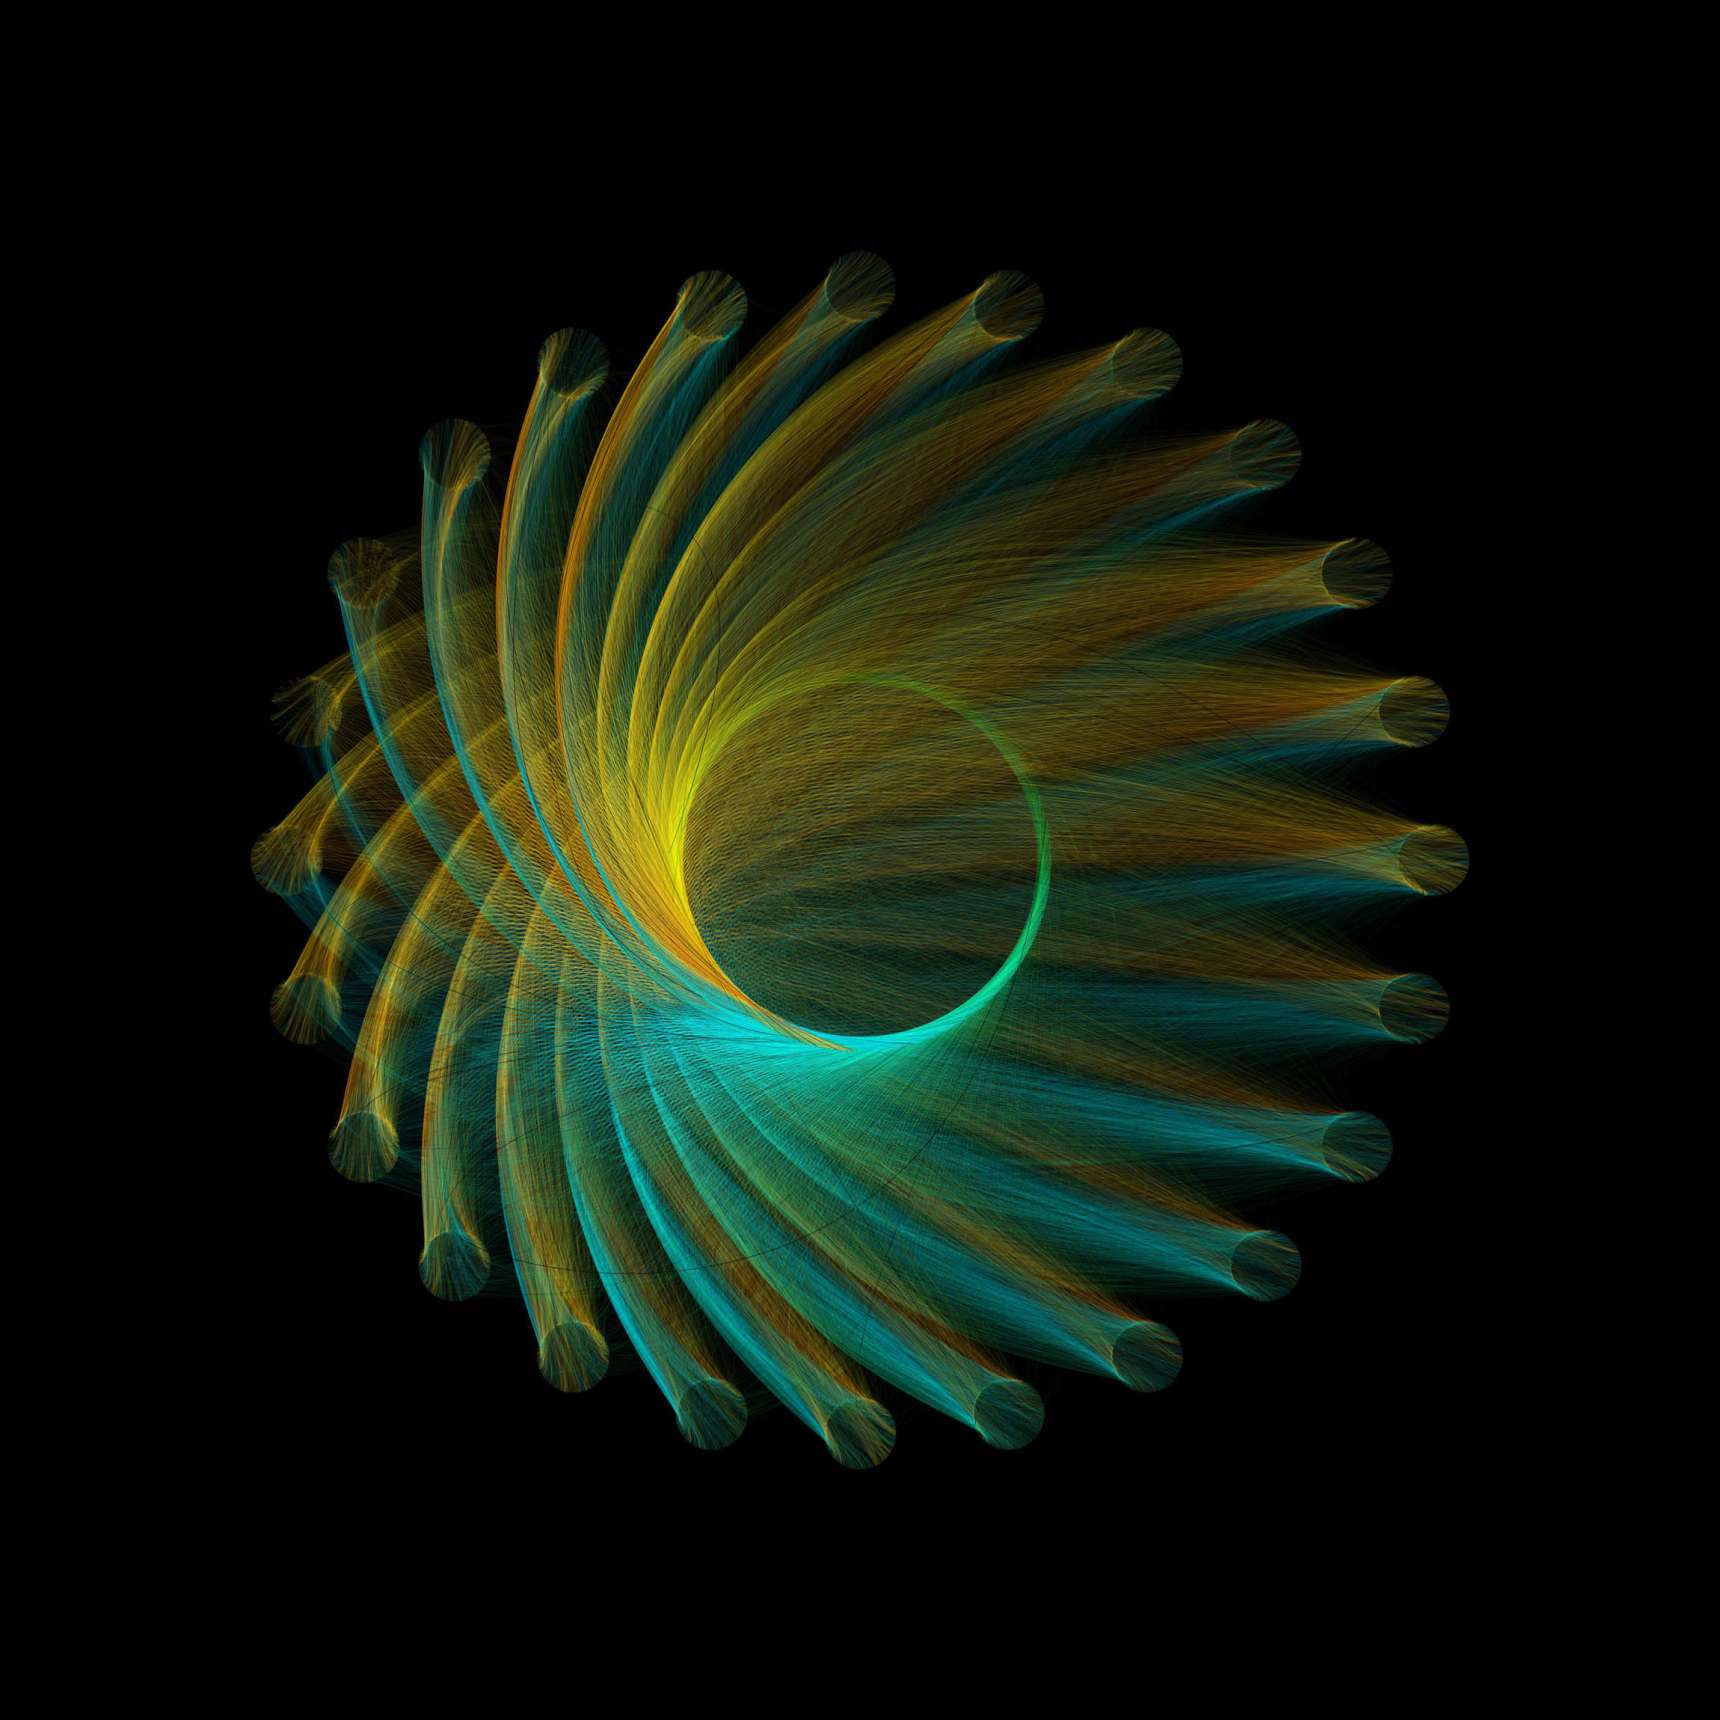
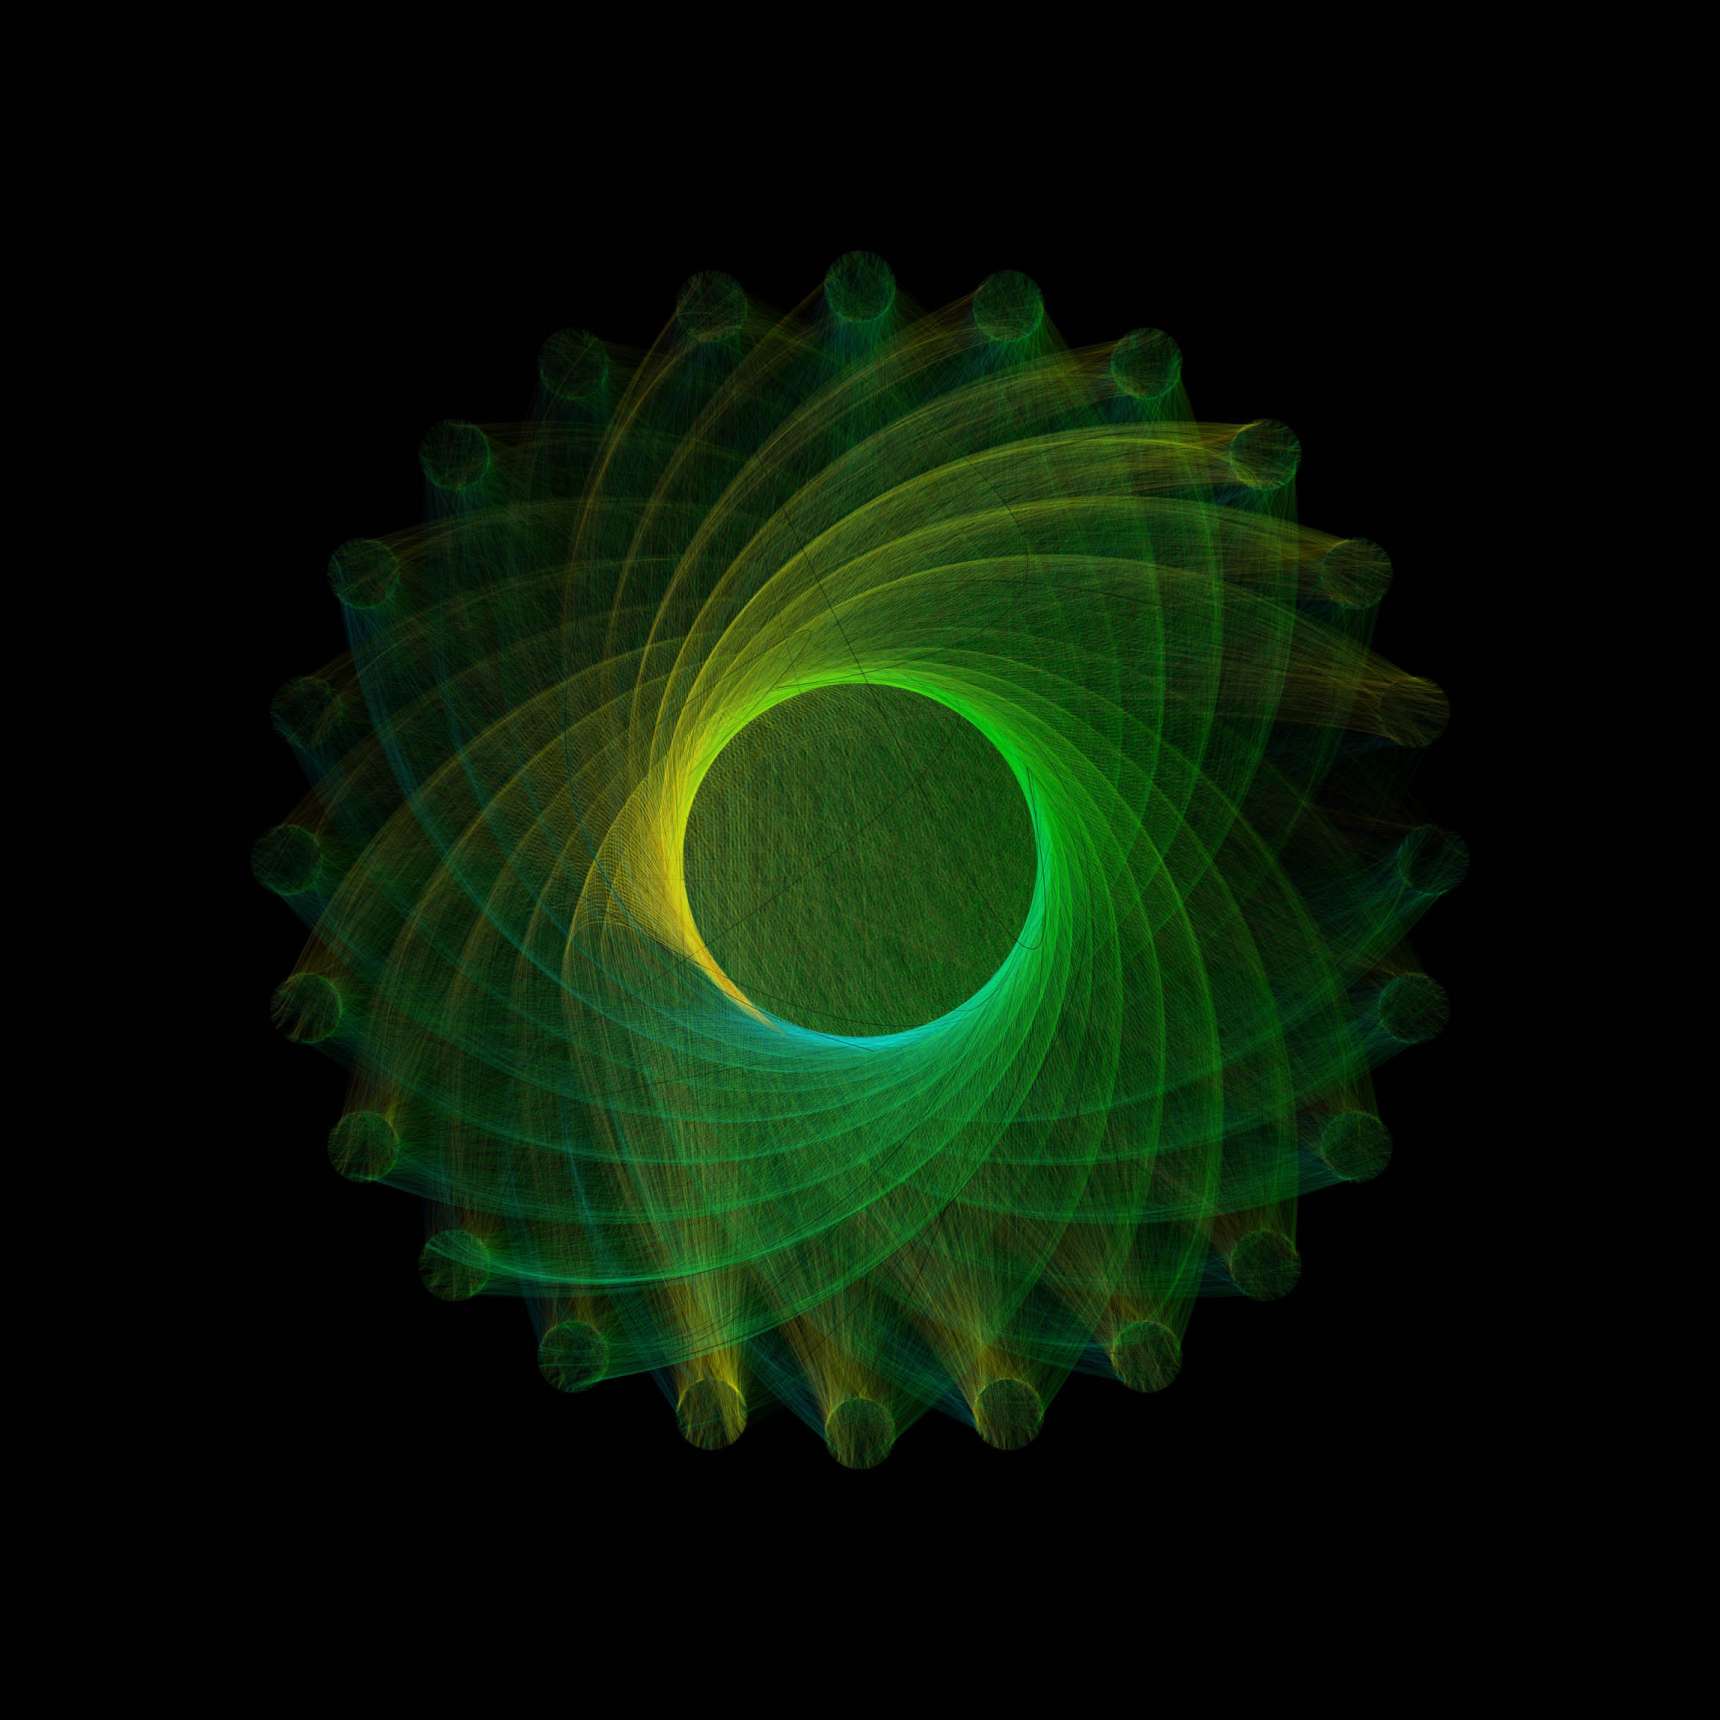
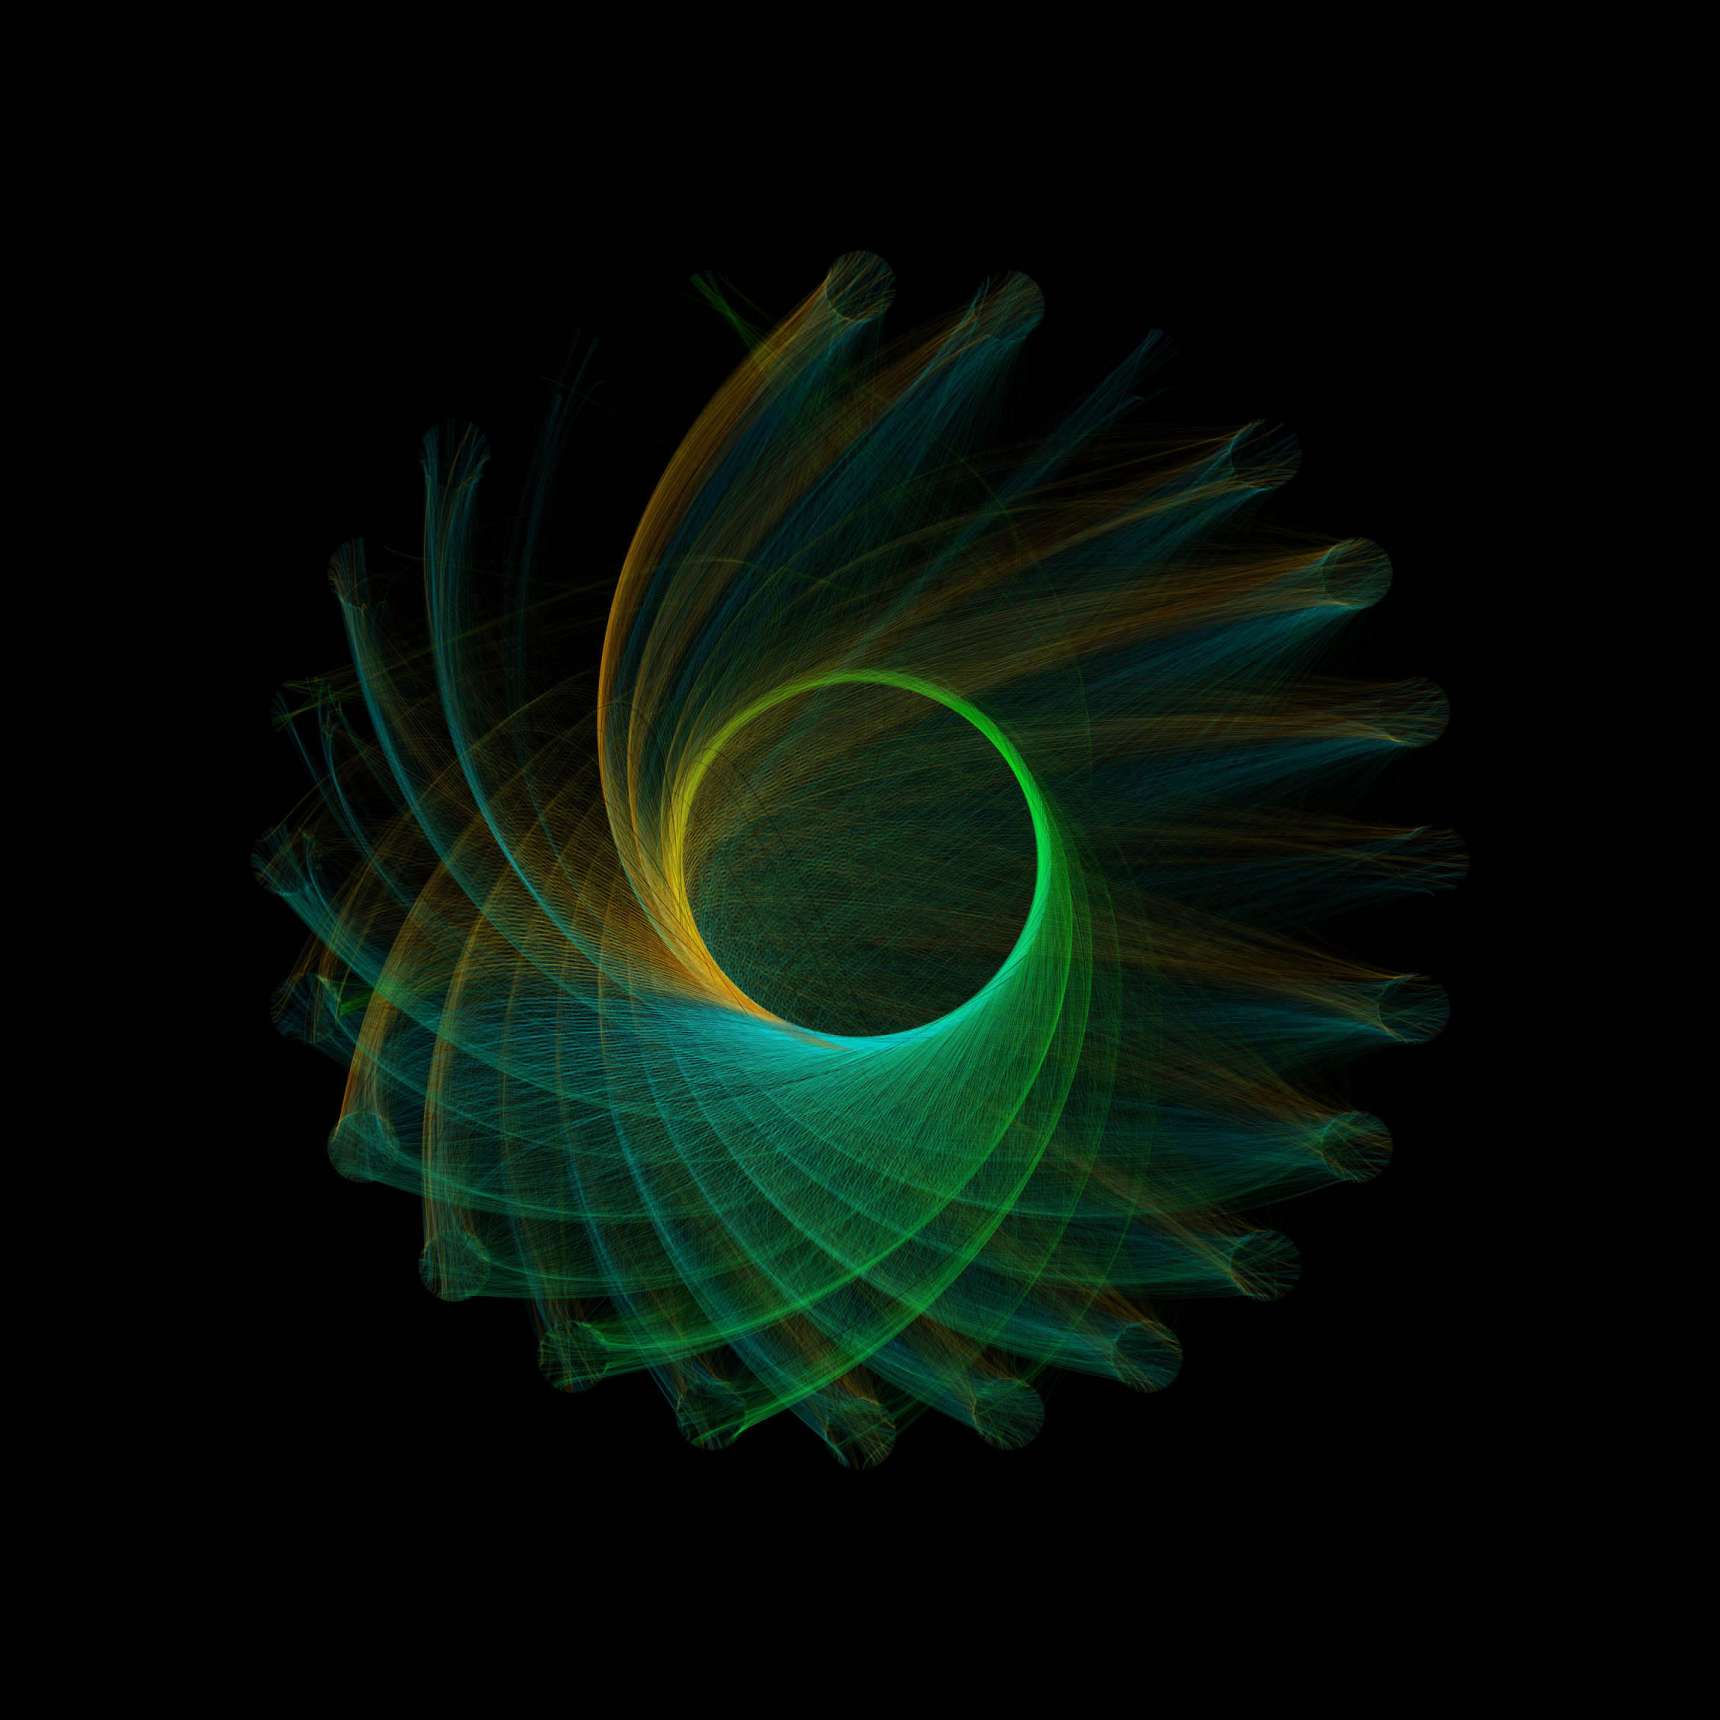
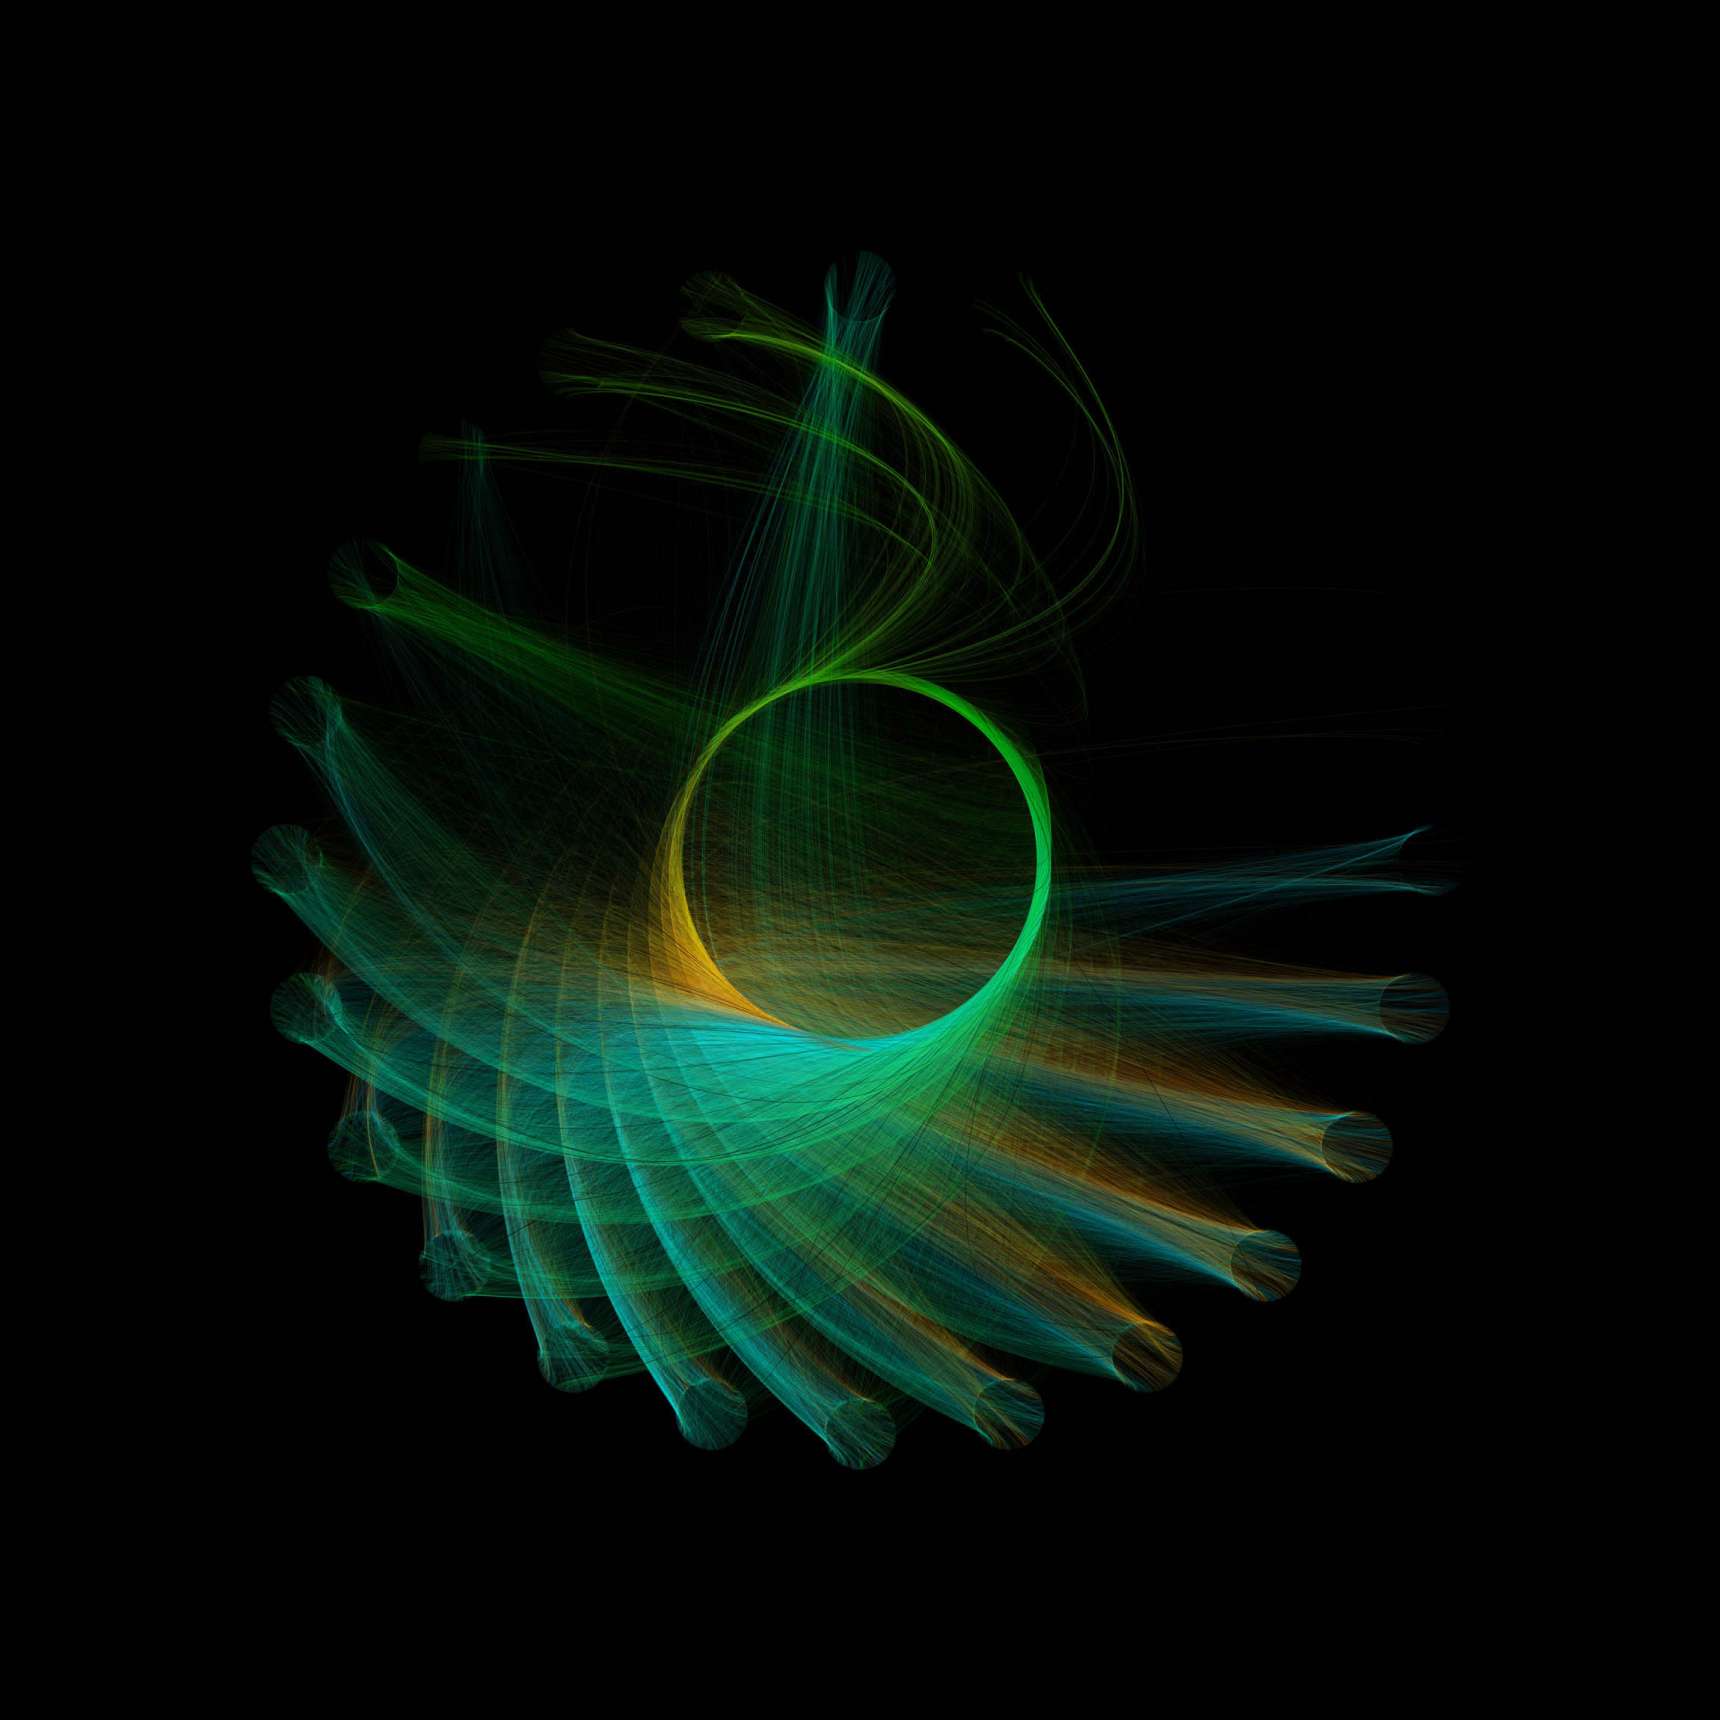
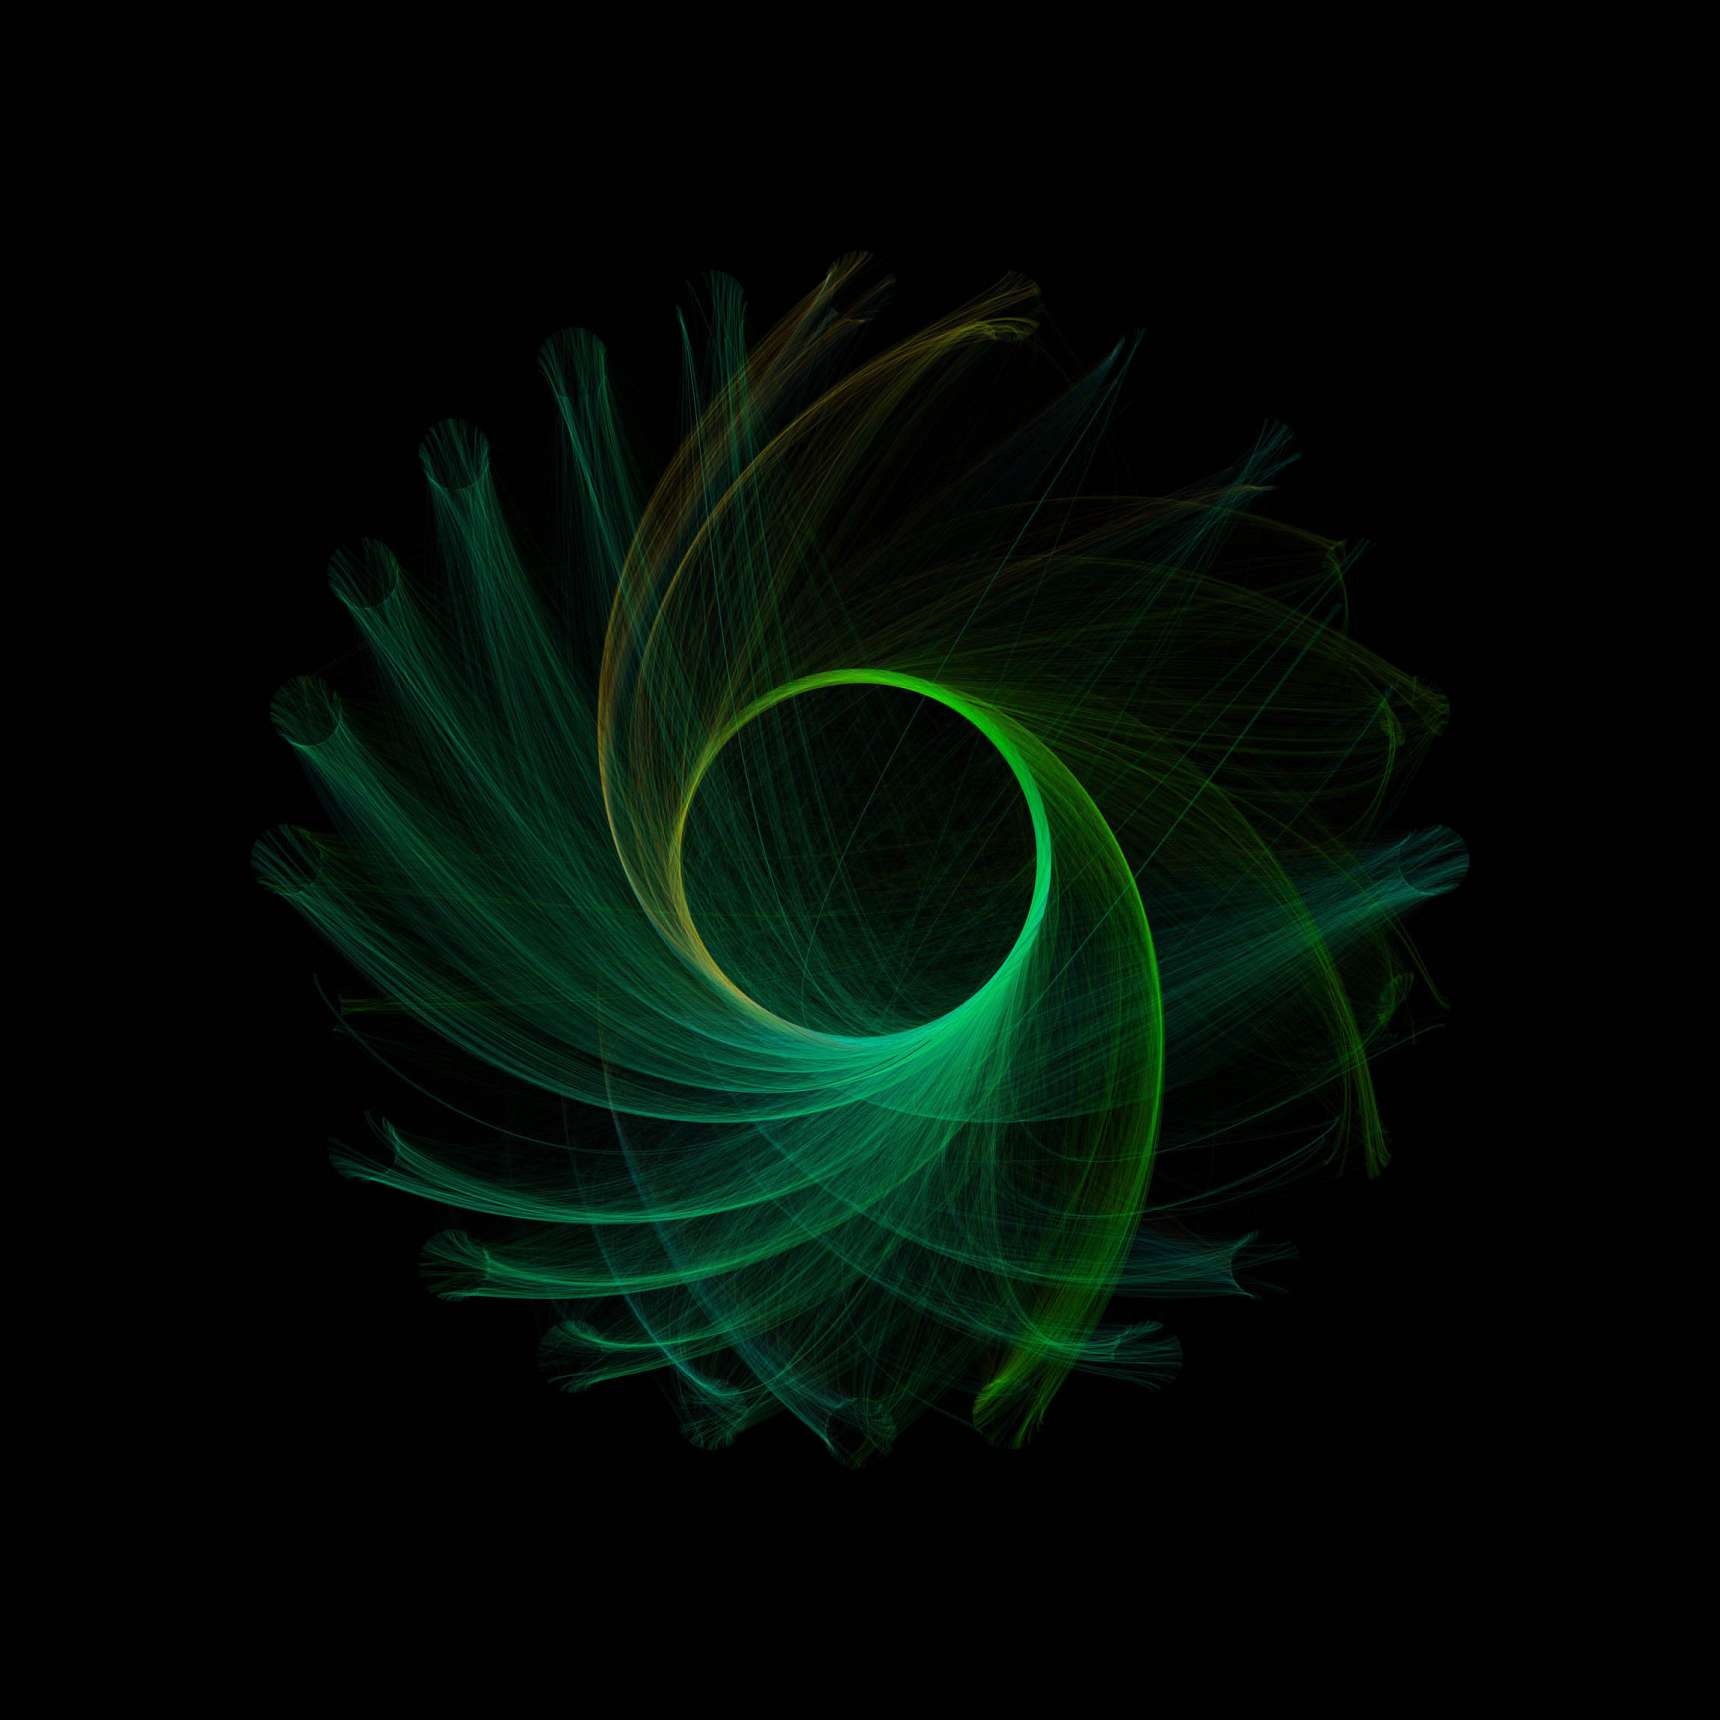
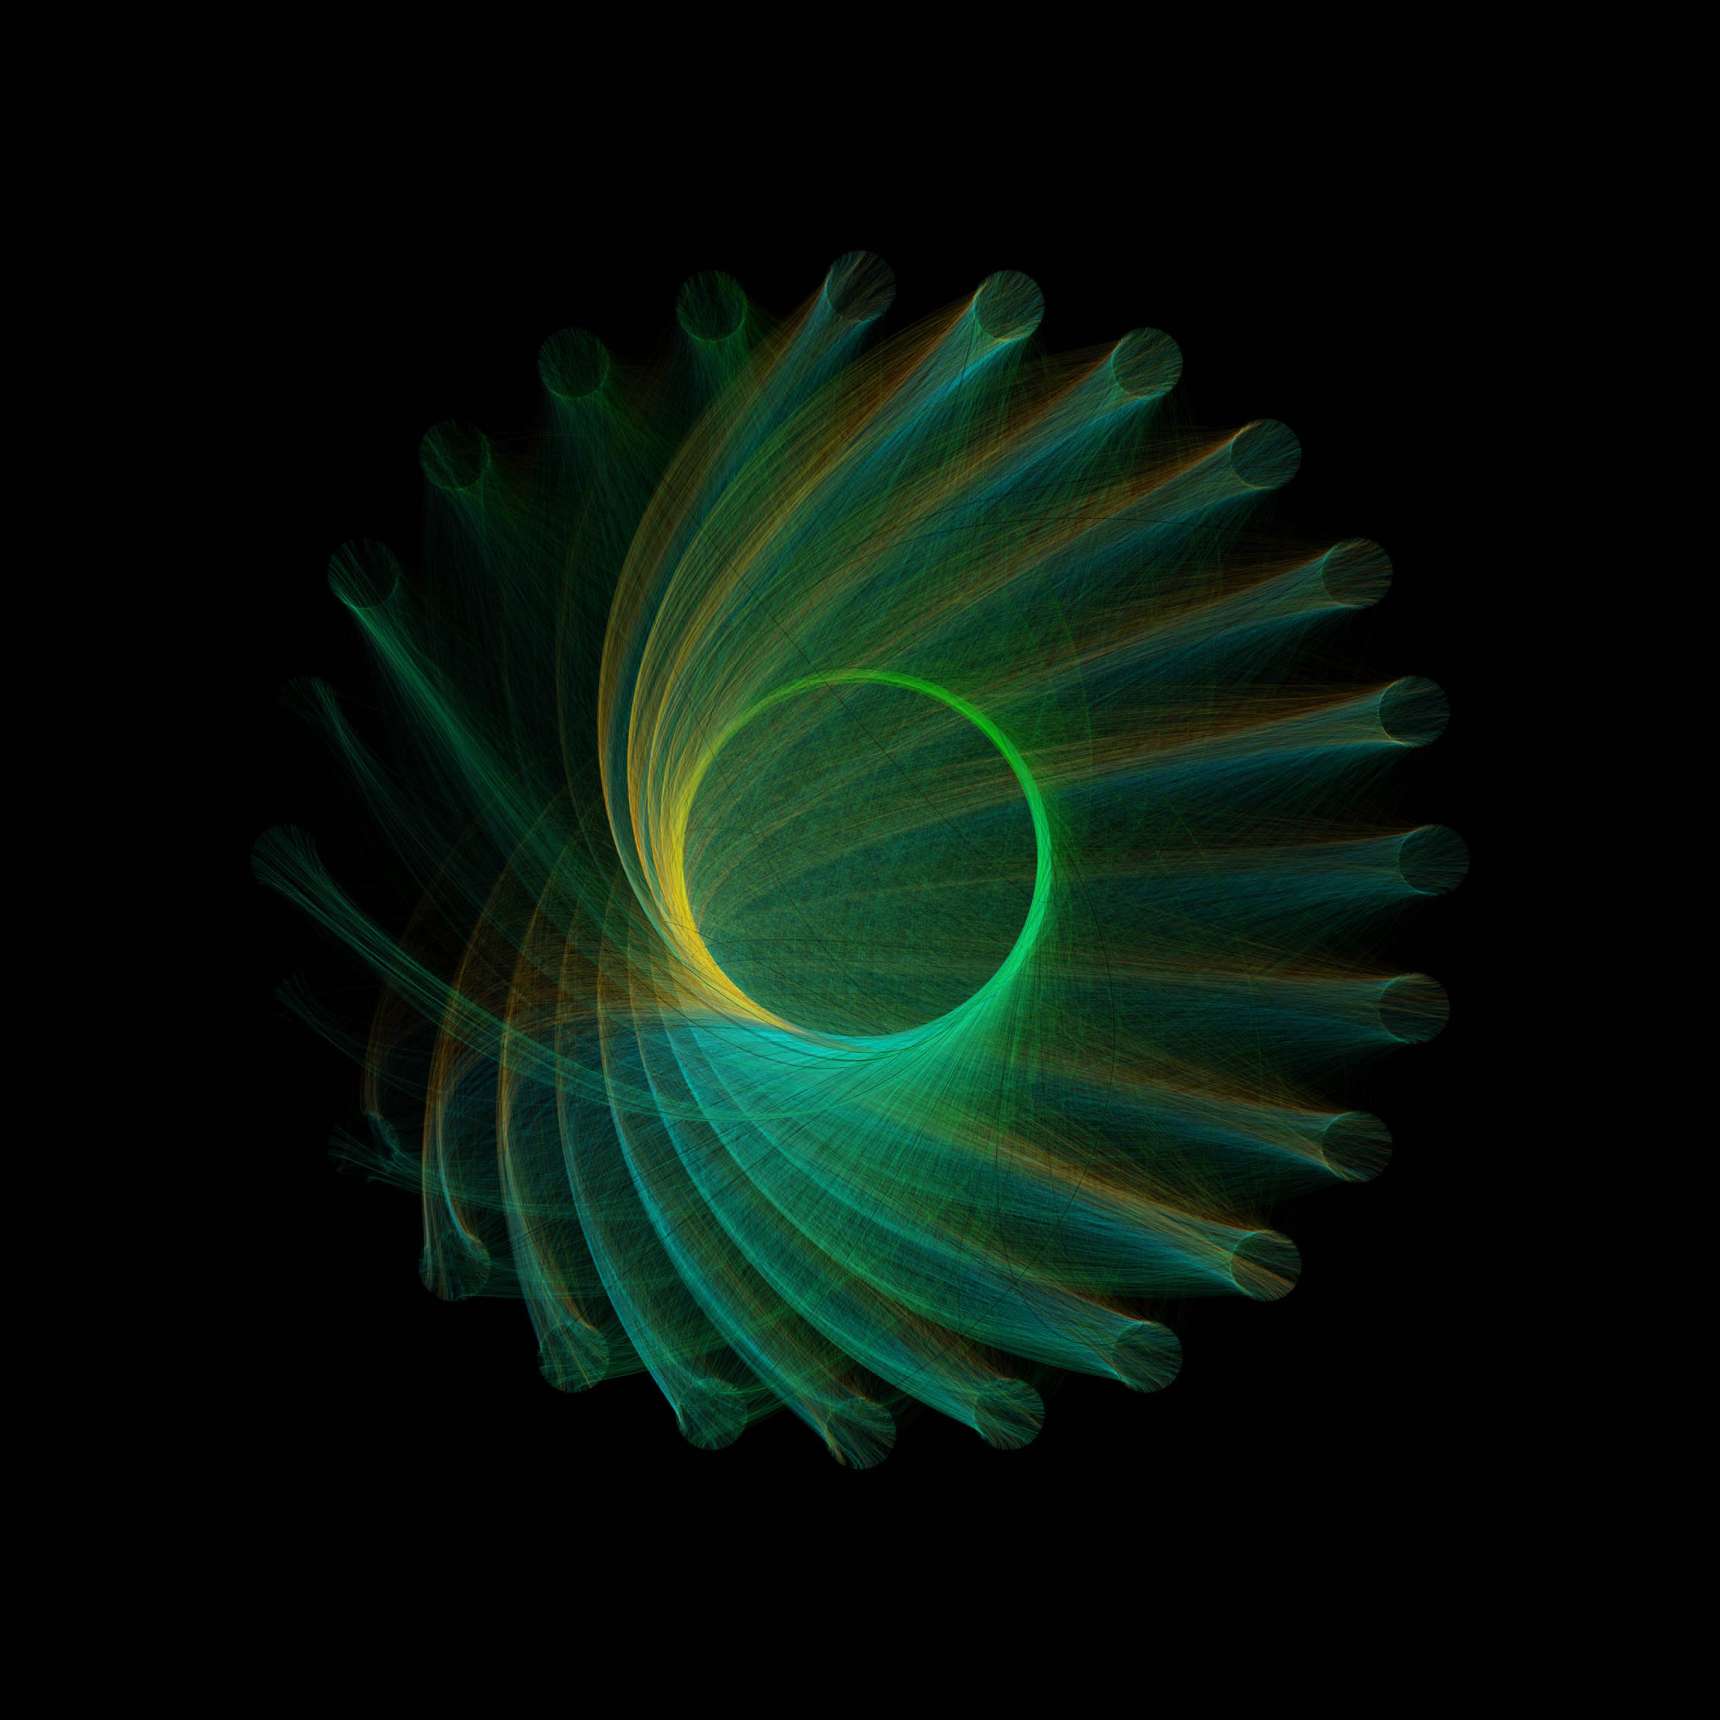
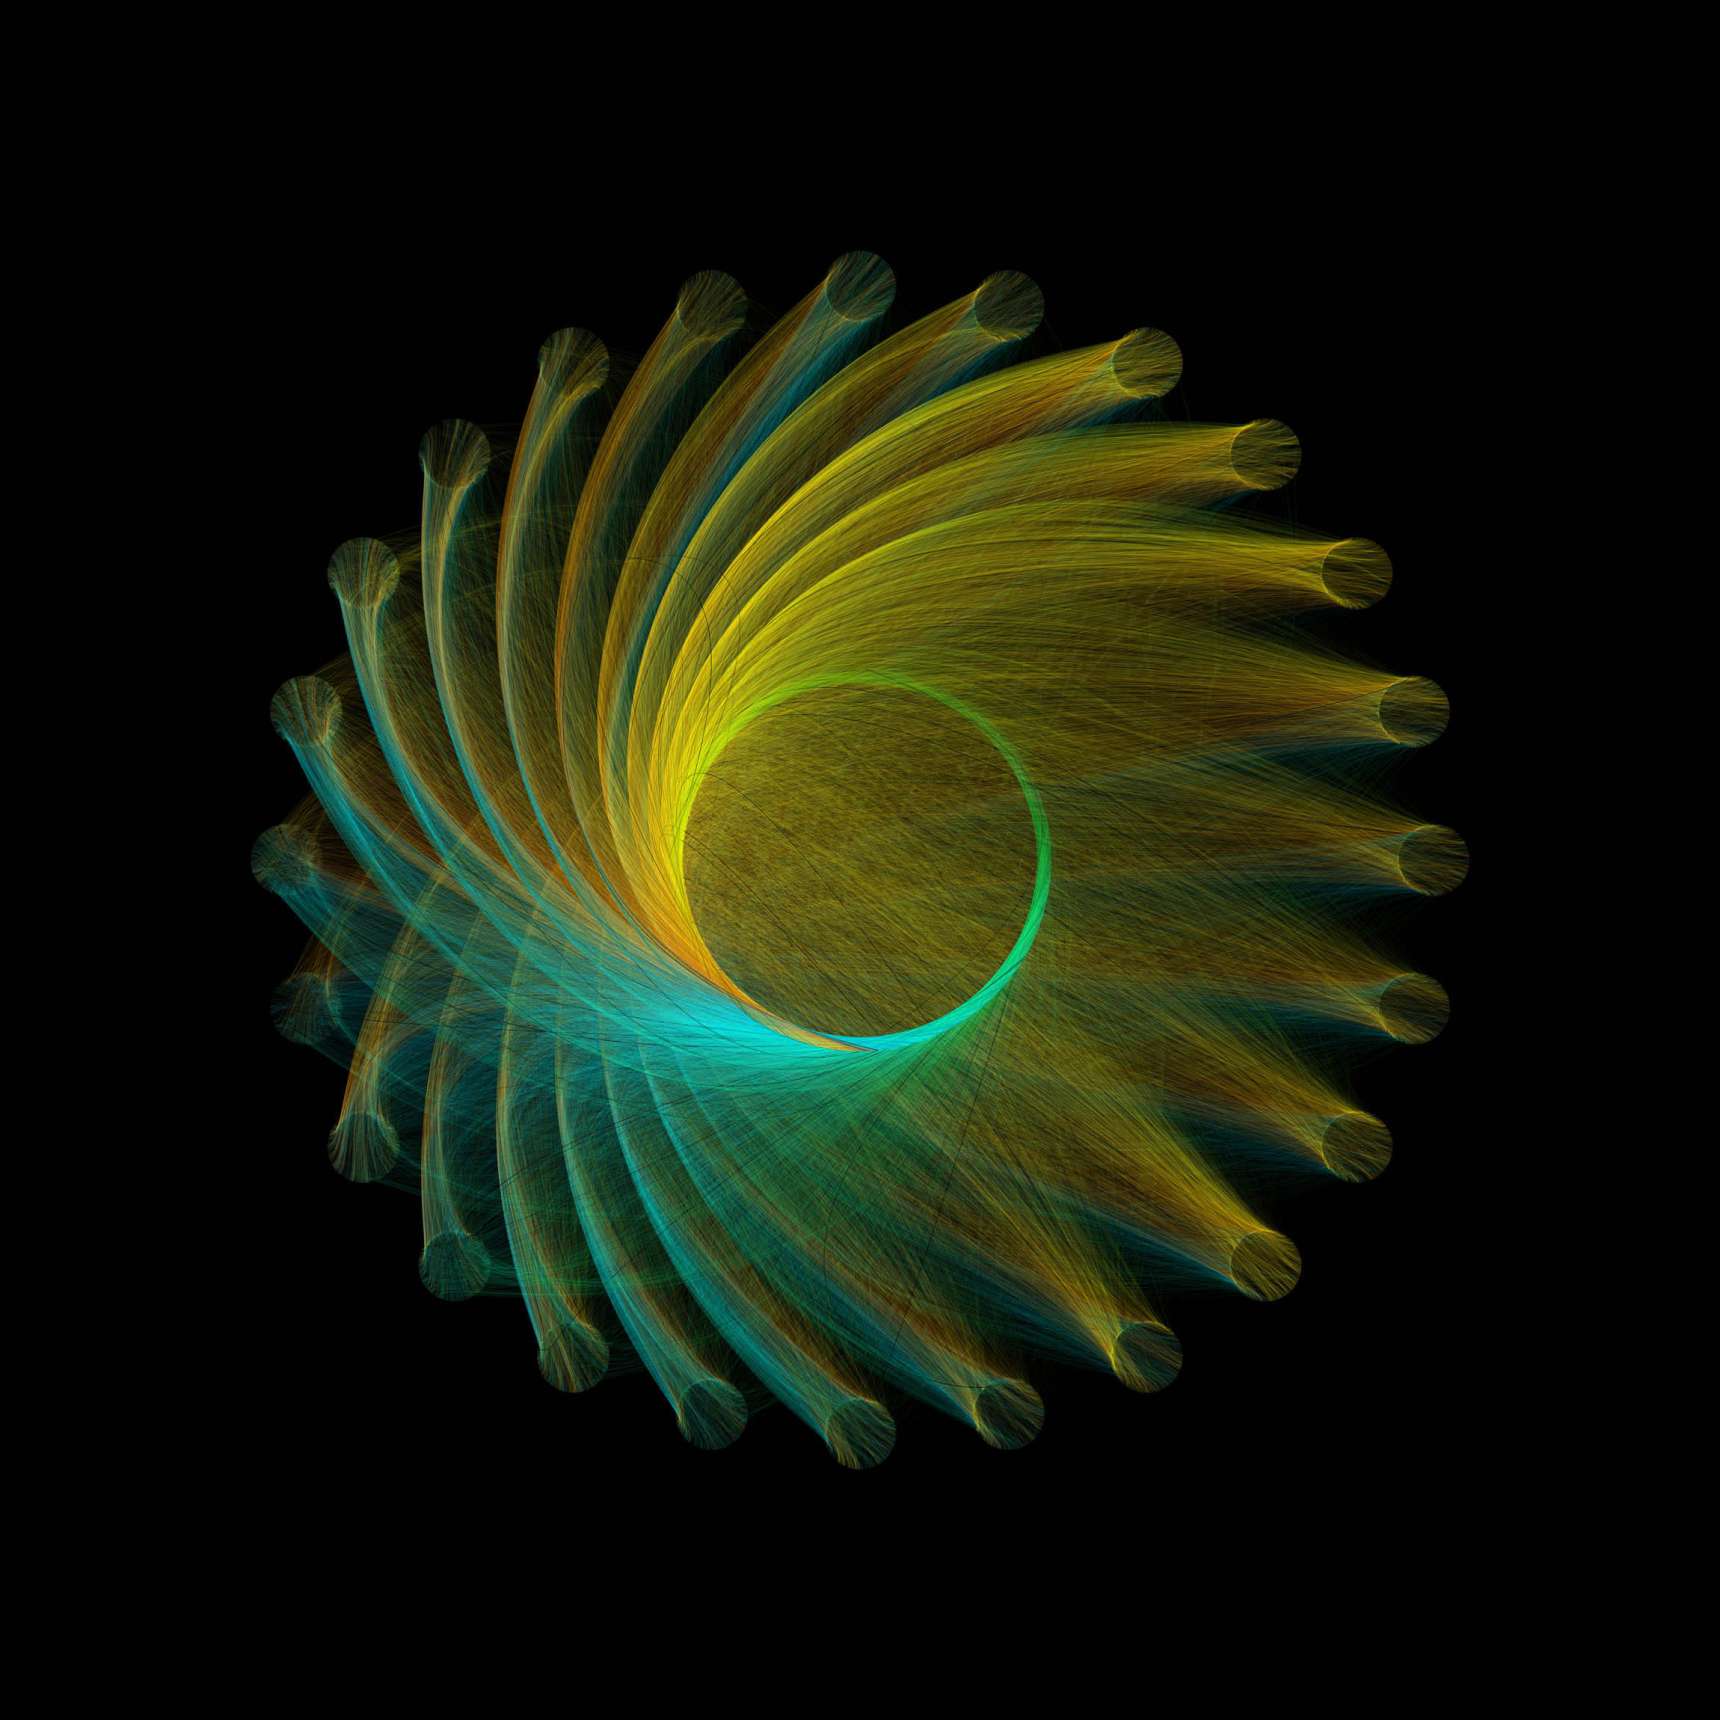
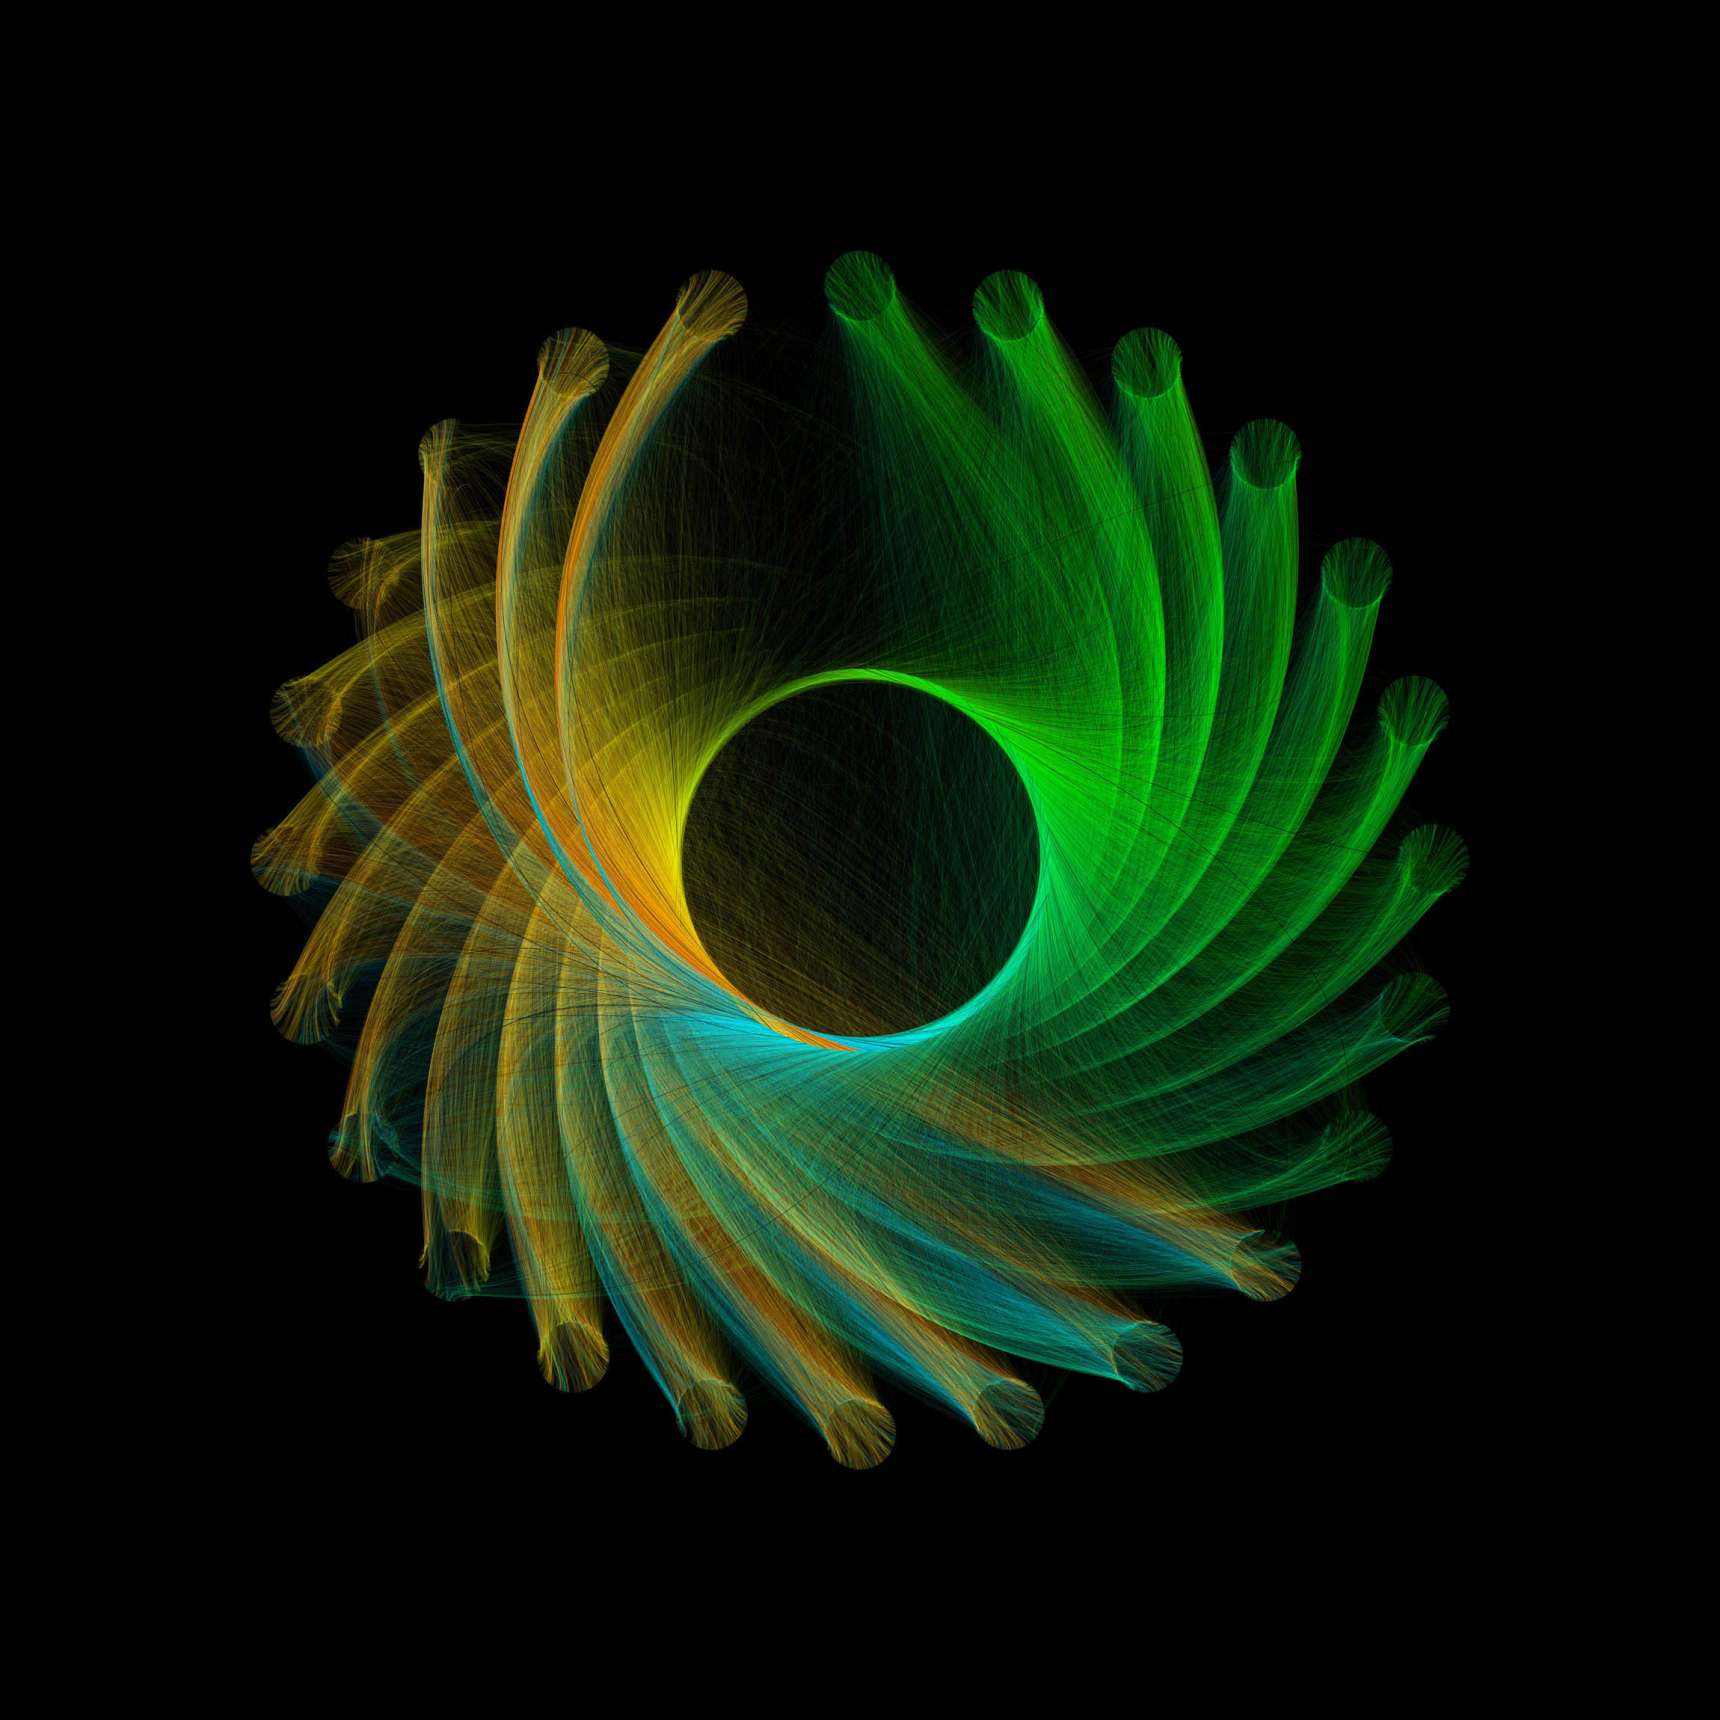
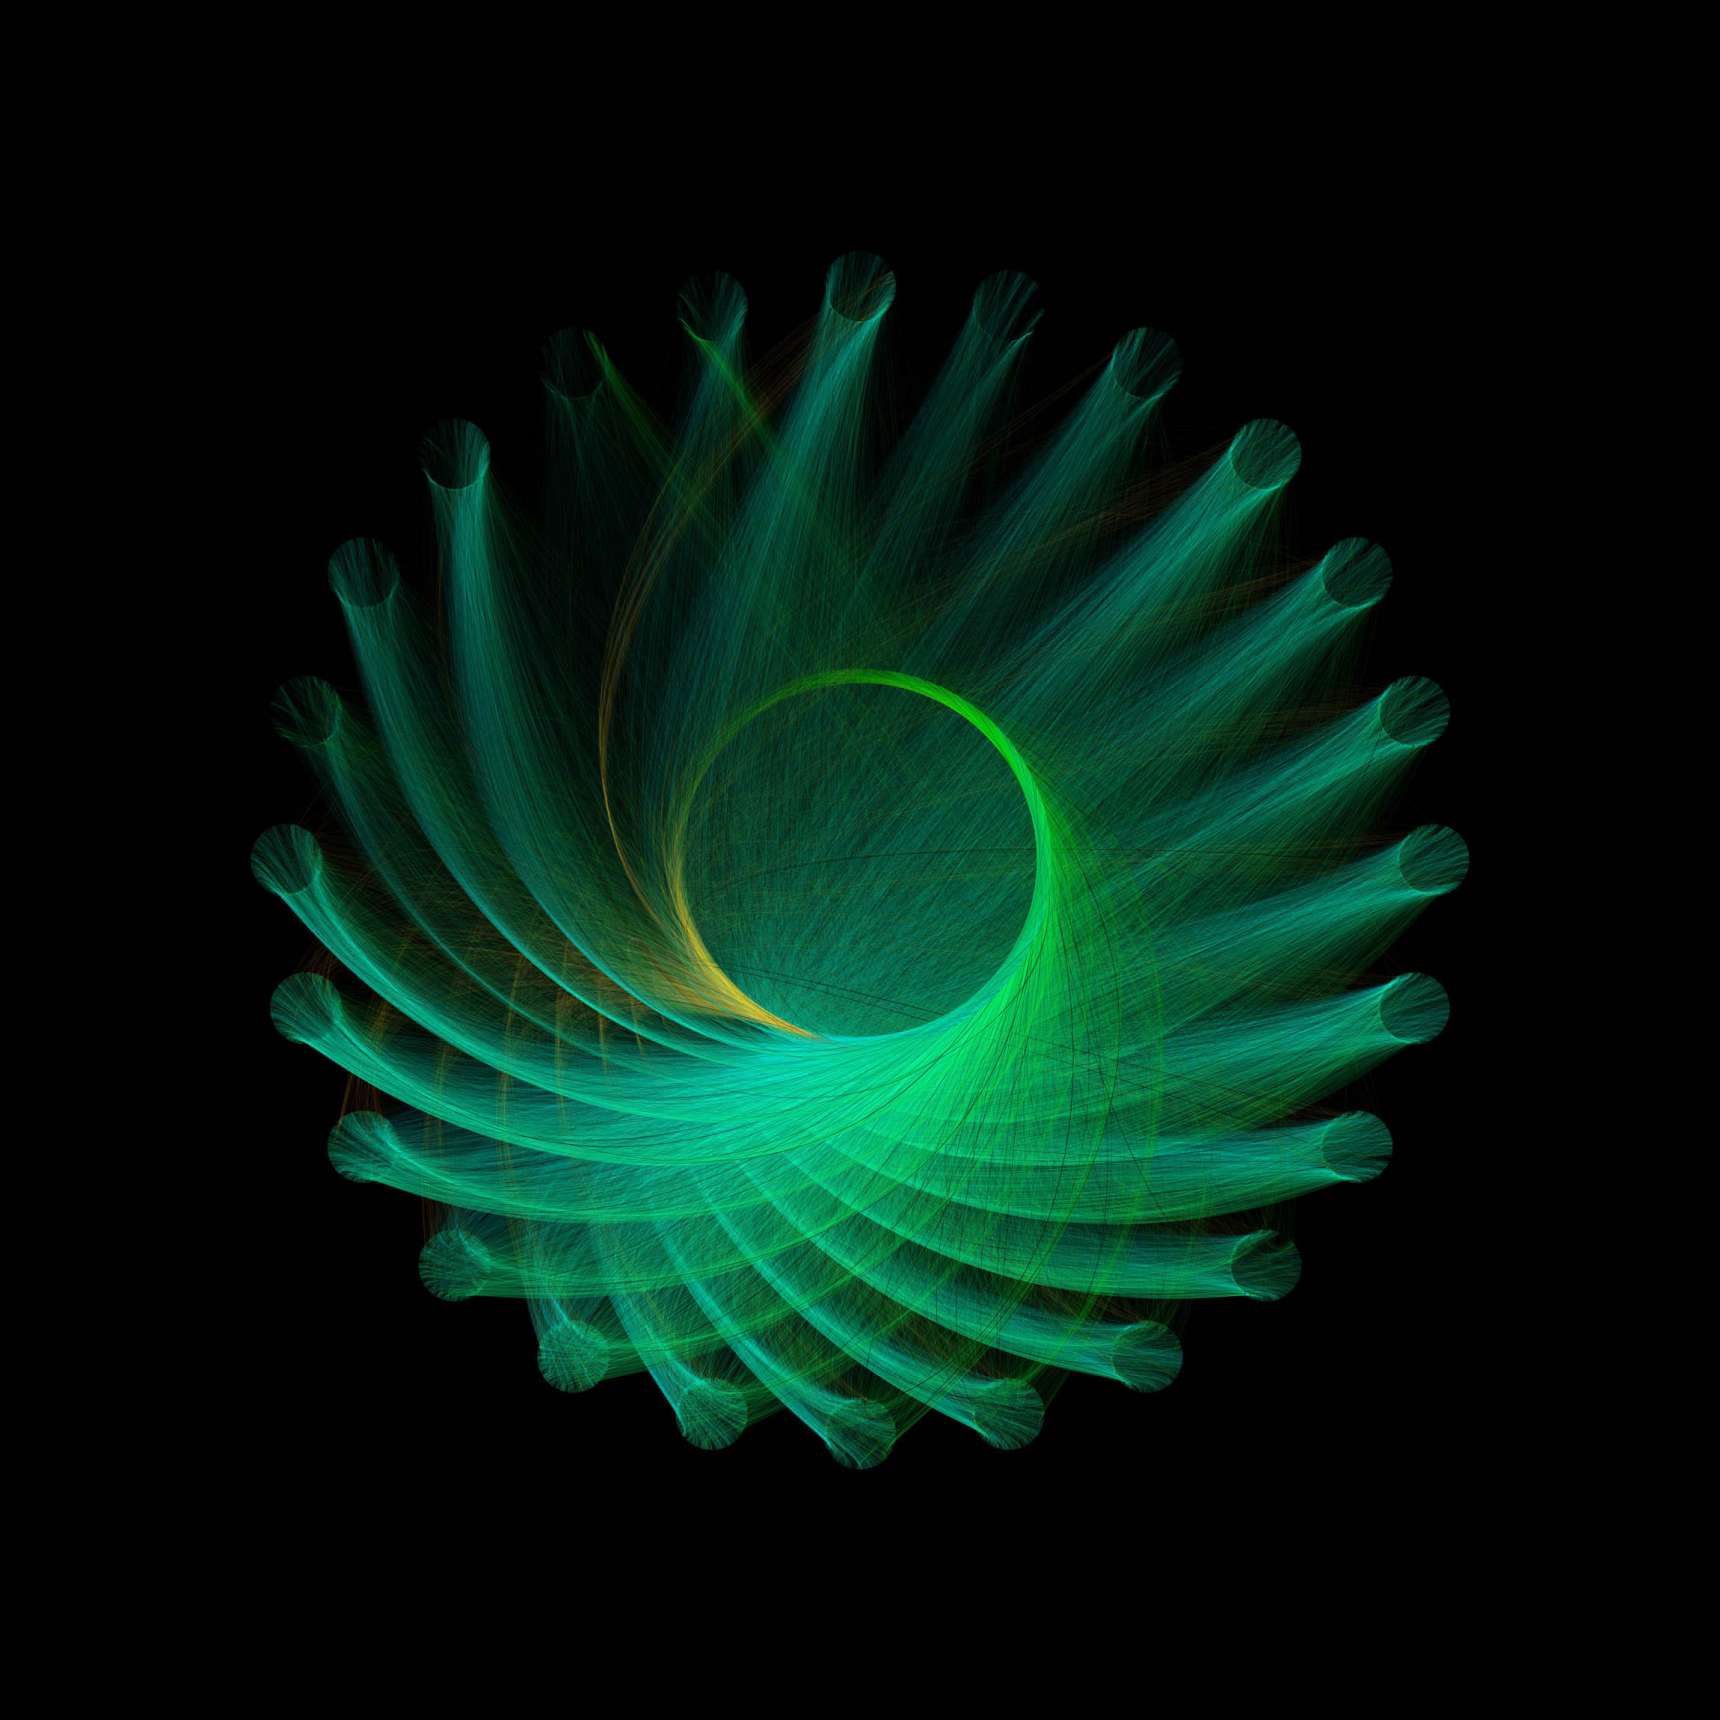
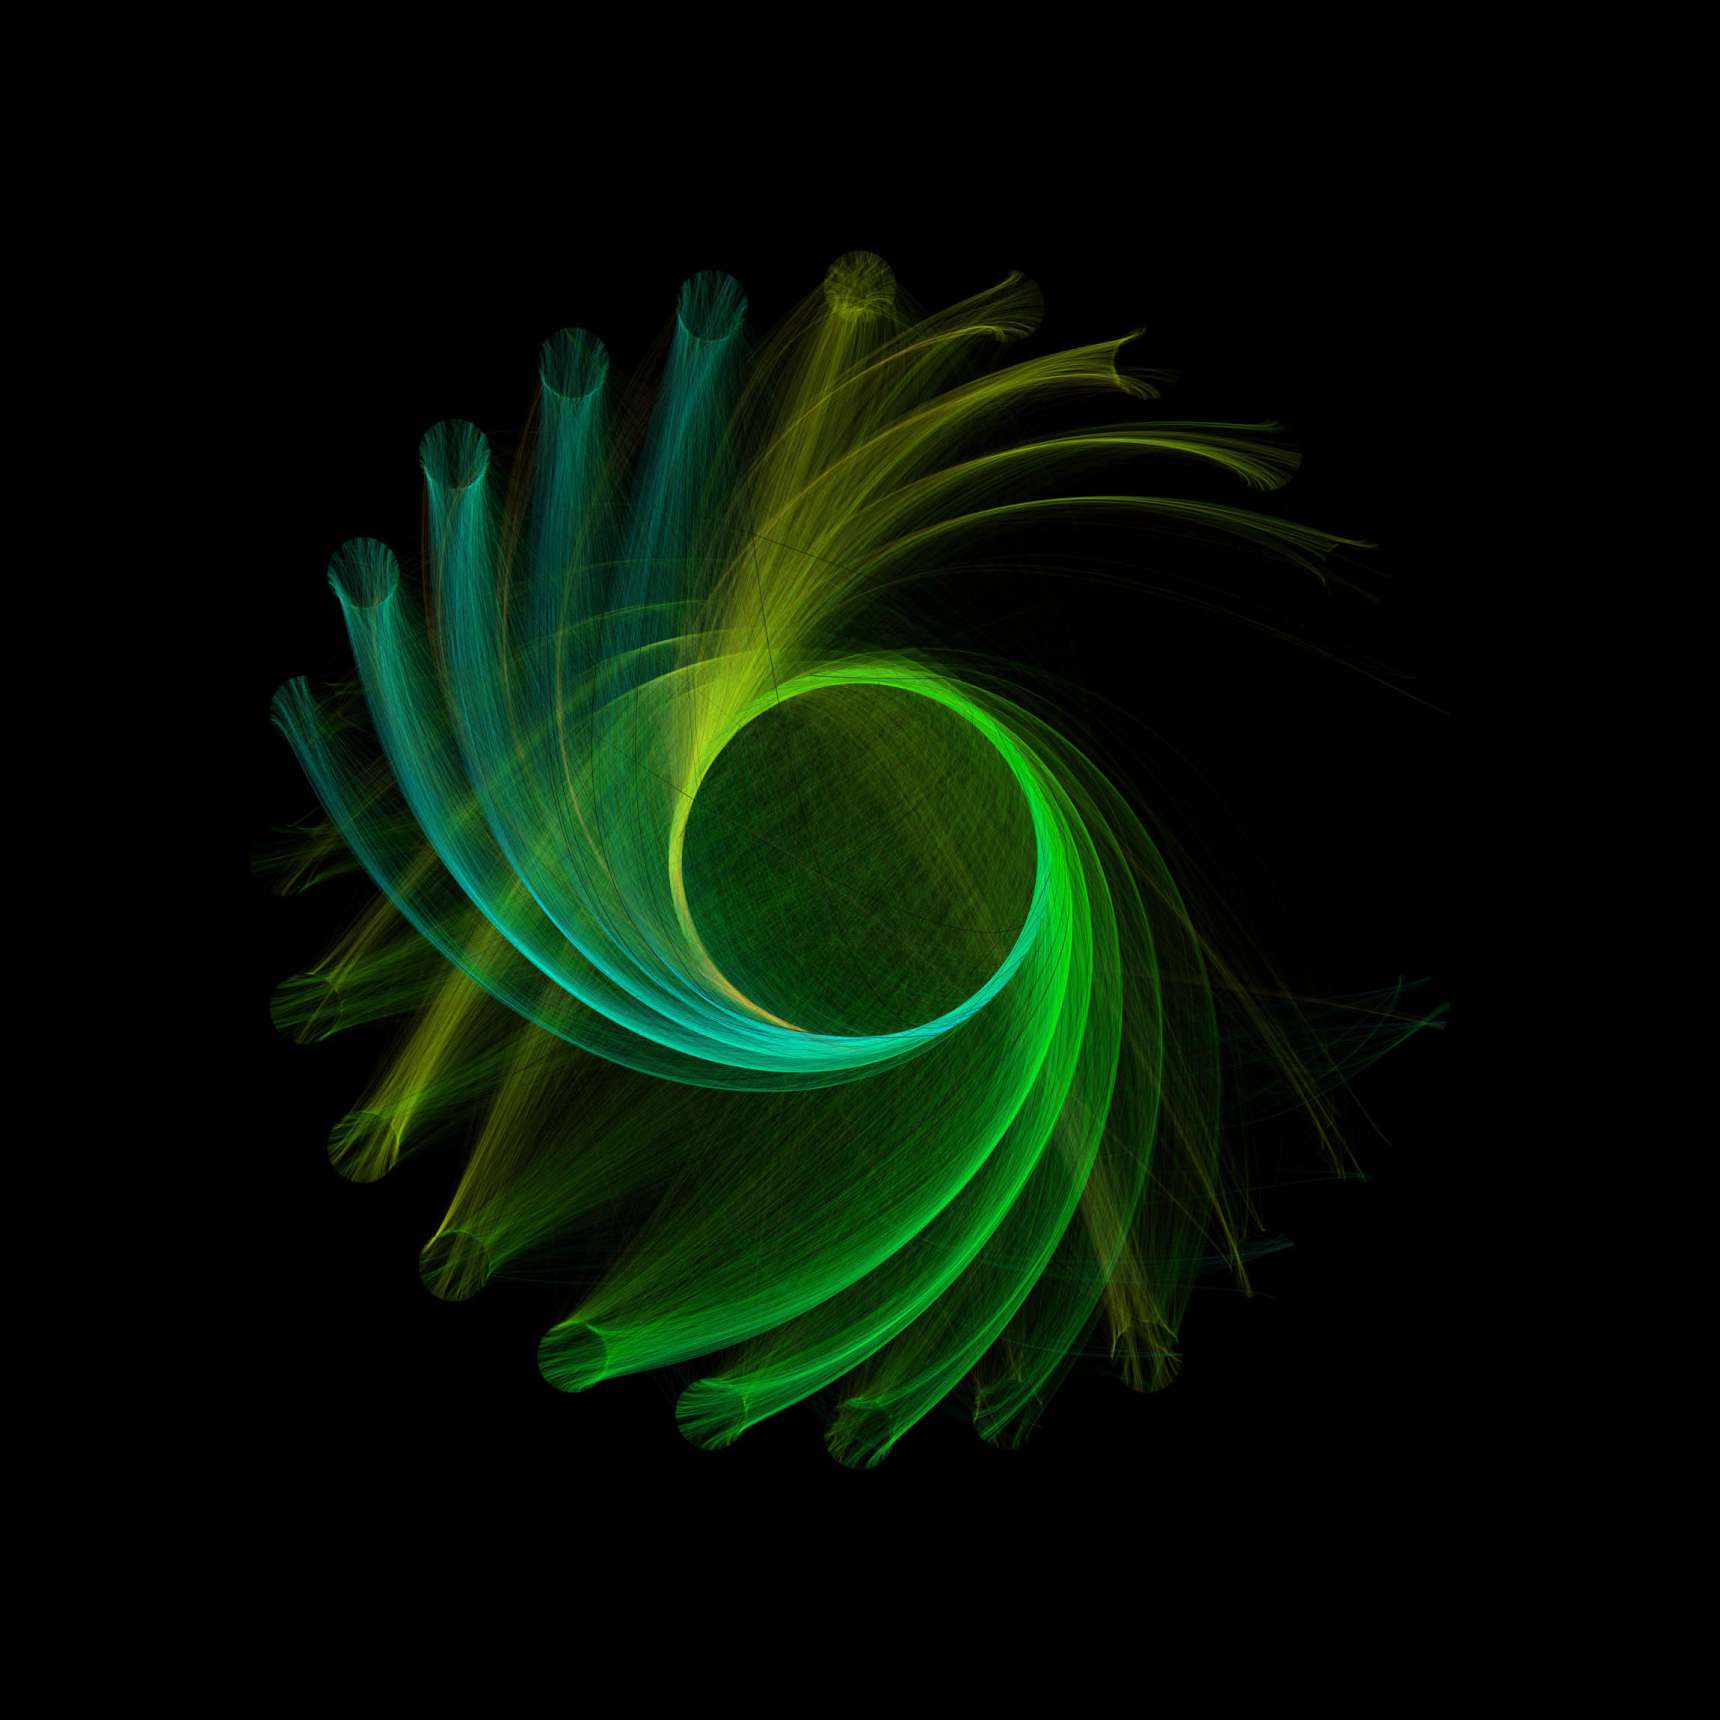
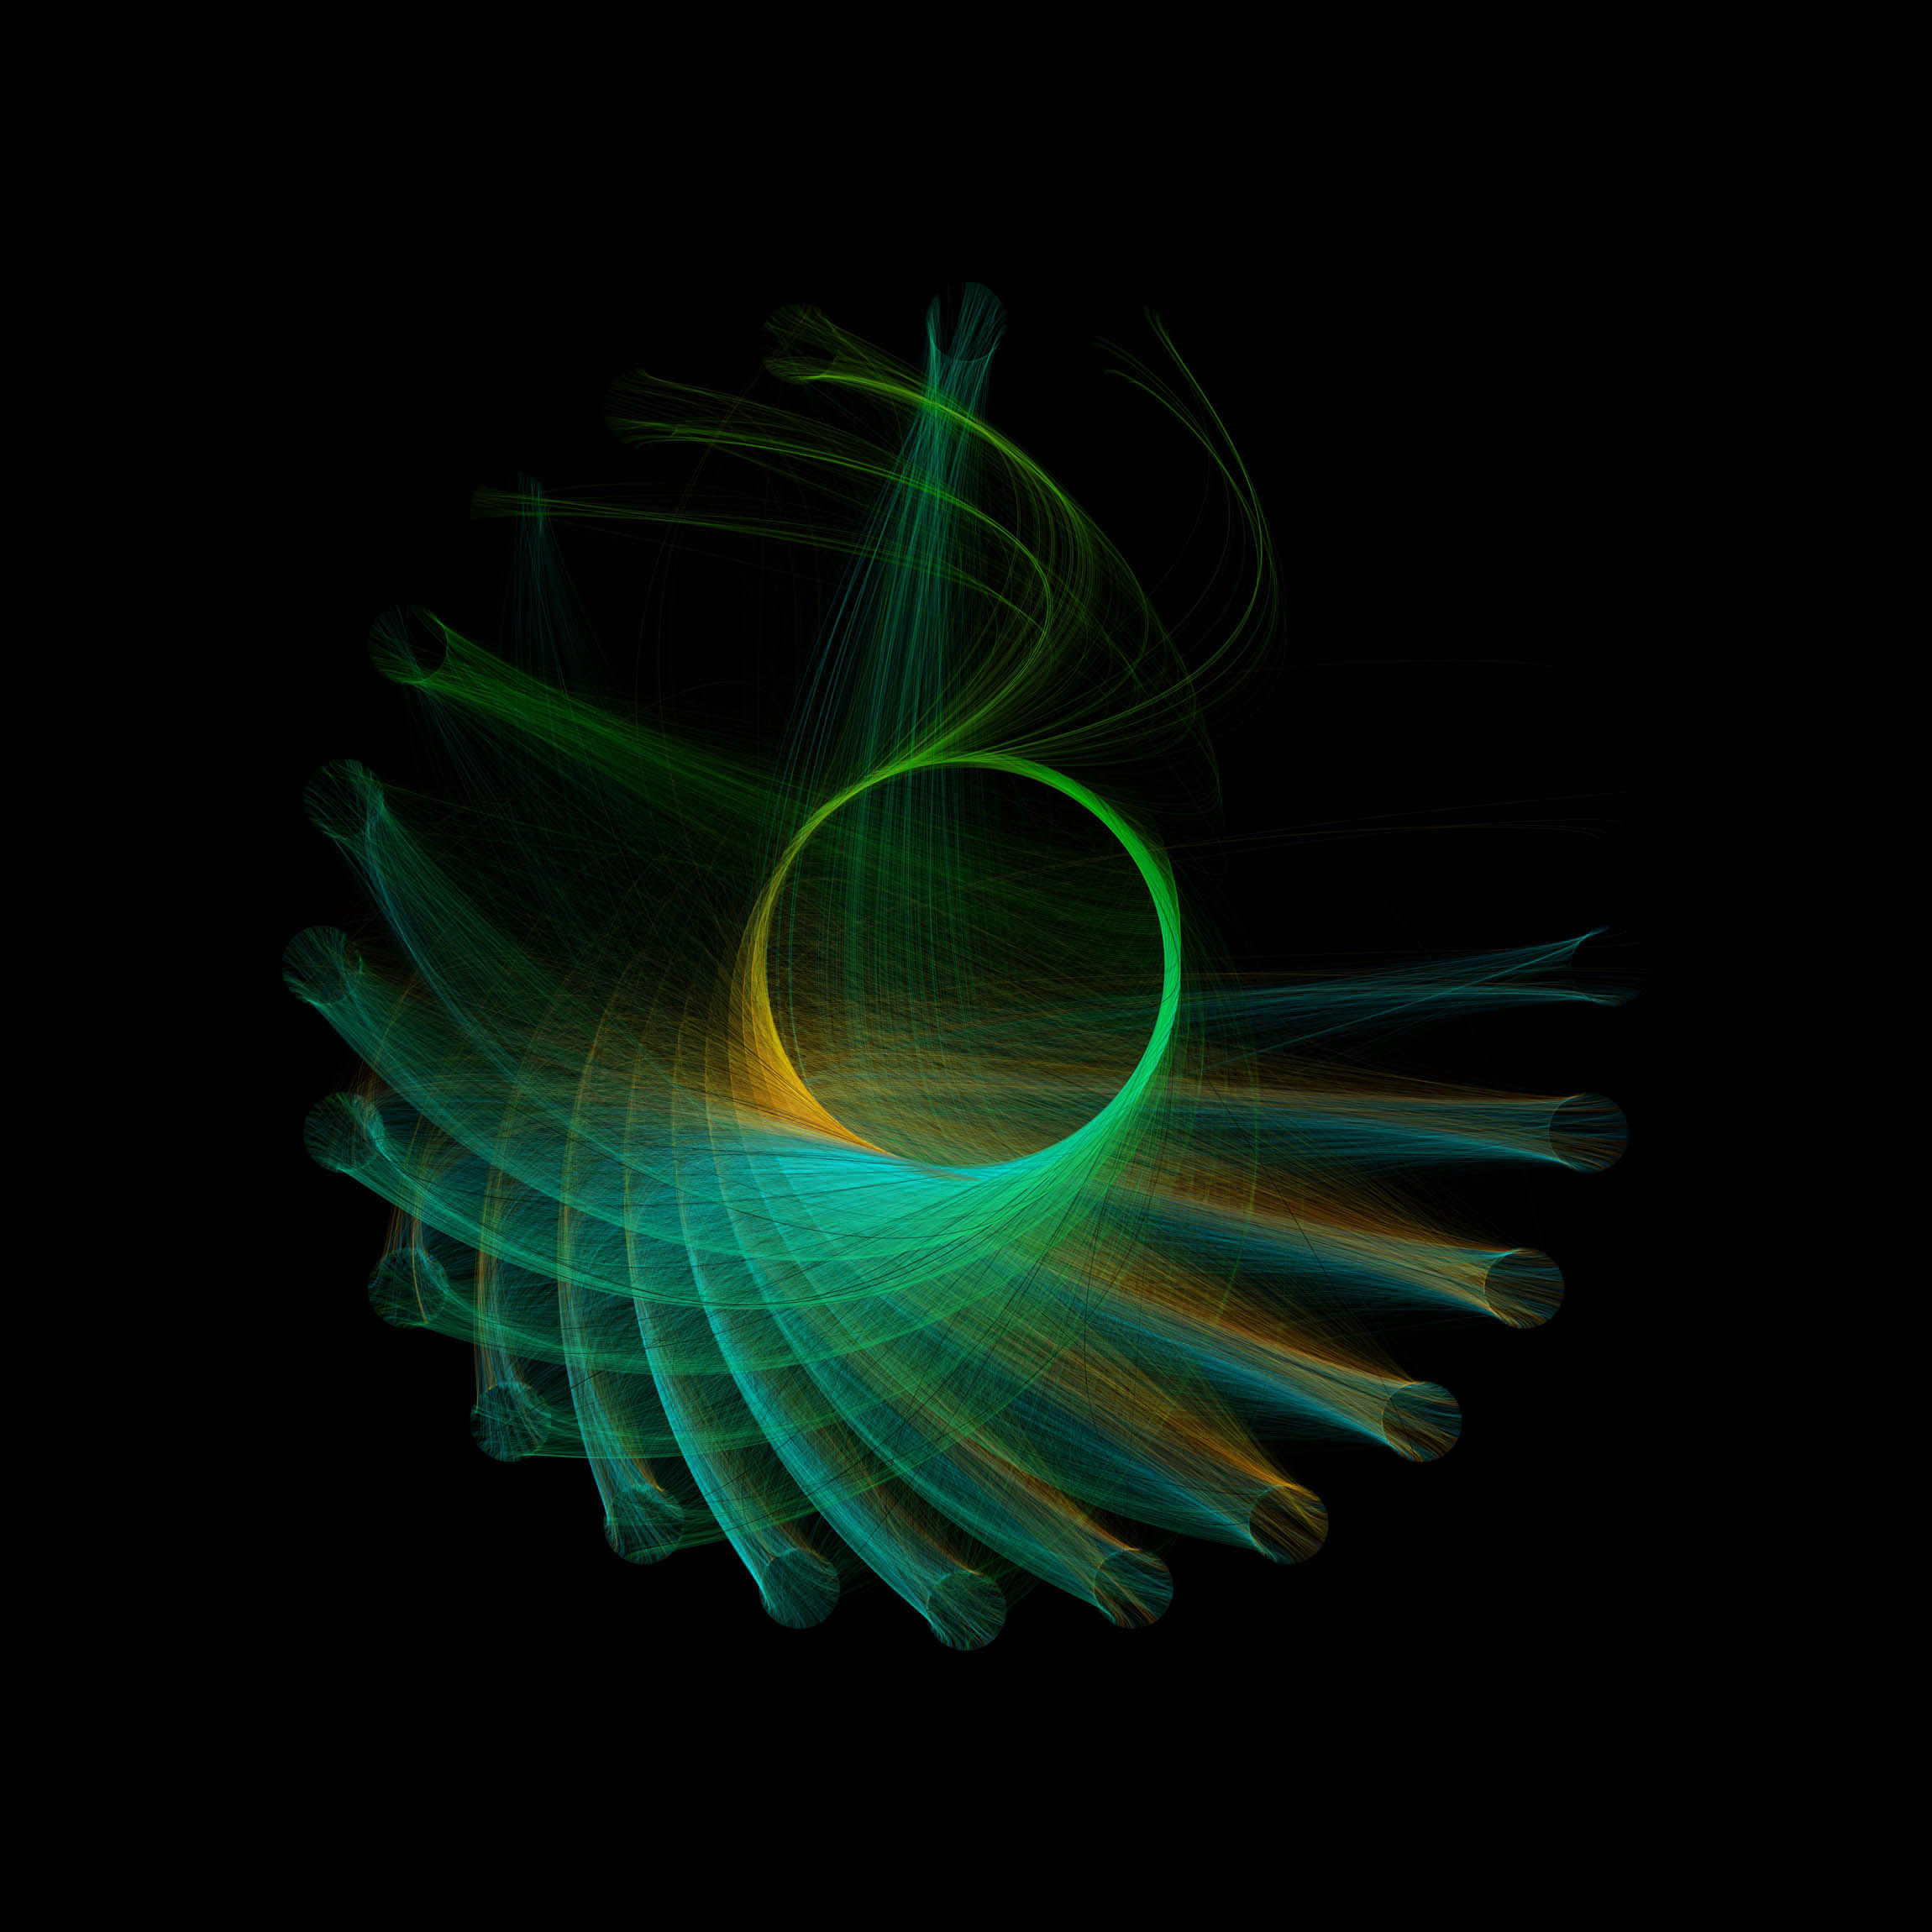
This drawing process combines the organizing principles of clocks and compasses. A ring of twenty-four small circles—representing time—surround a larger inner circle representing direction. This process uses wind data I collected with weather instruments at a rate of one measurement per second. The outer ring has a circle for every hour of the day with the first hour at the top. Curves are drawn for each second of data from the outer circles to points on the inner one if the wind was blowing during that second.
Each curve’s starting point on the outer circle is at an angle of rotation around that circles’s center relating to the number of seconds that have passed in that hour. The curve’s end point on the inner circle relates to that second’s wind direction. Winds from the south, for example, place the endpoint at the top of the inner circle. Curve colors are keyed to wind direction while their opacities are keyed to wind speed.