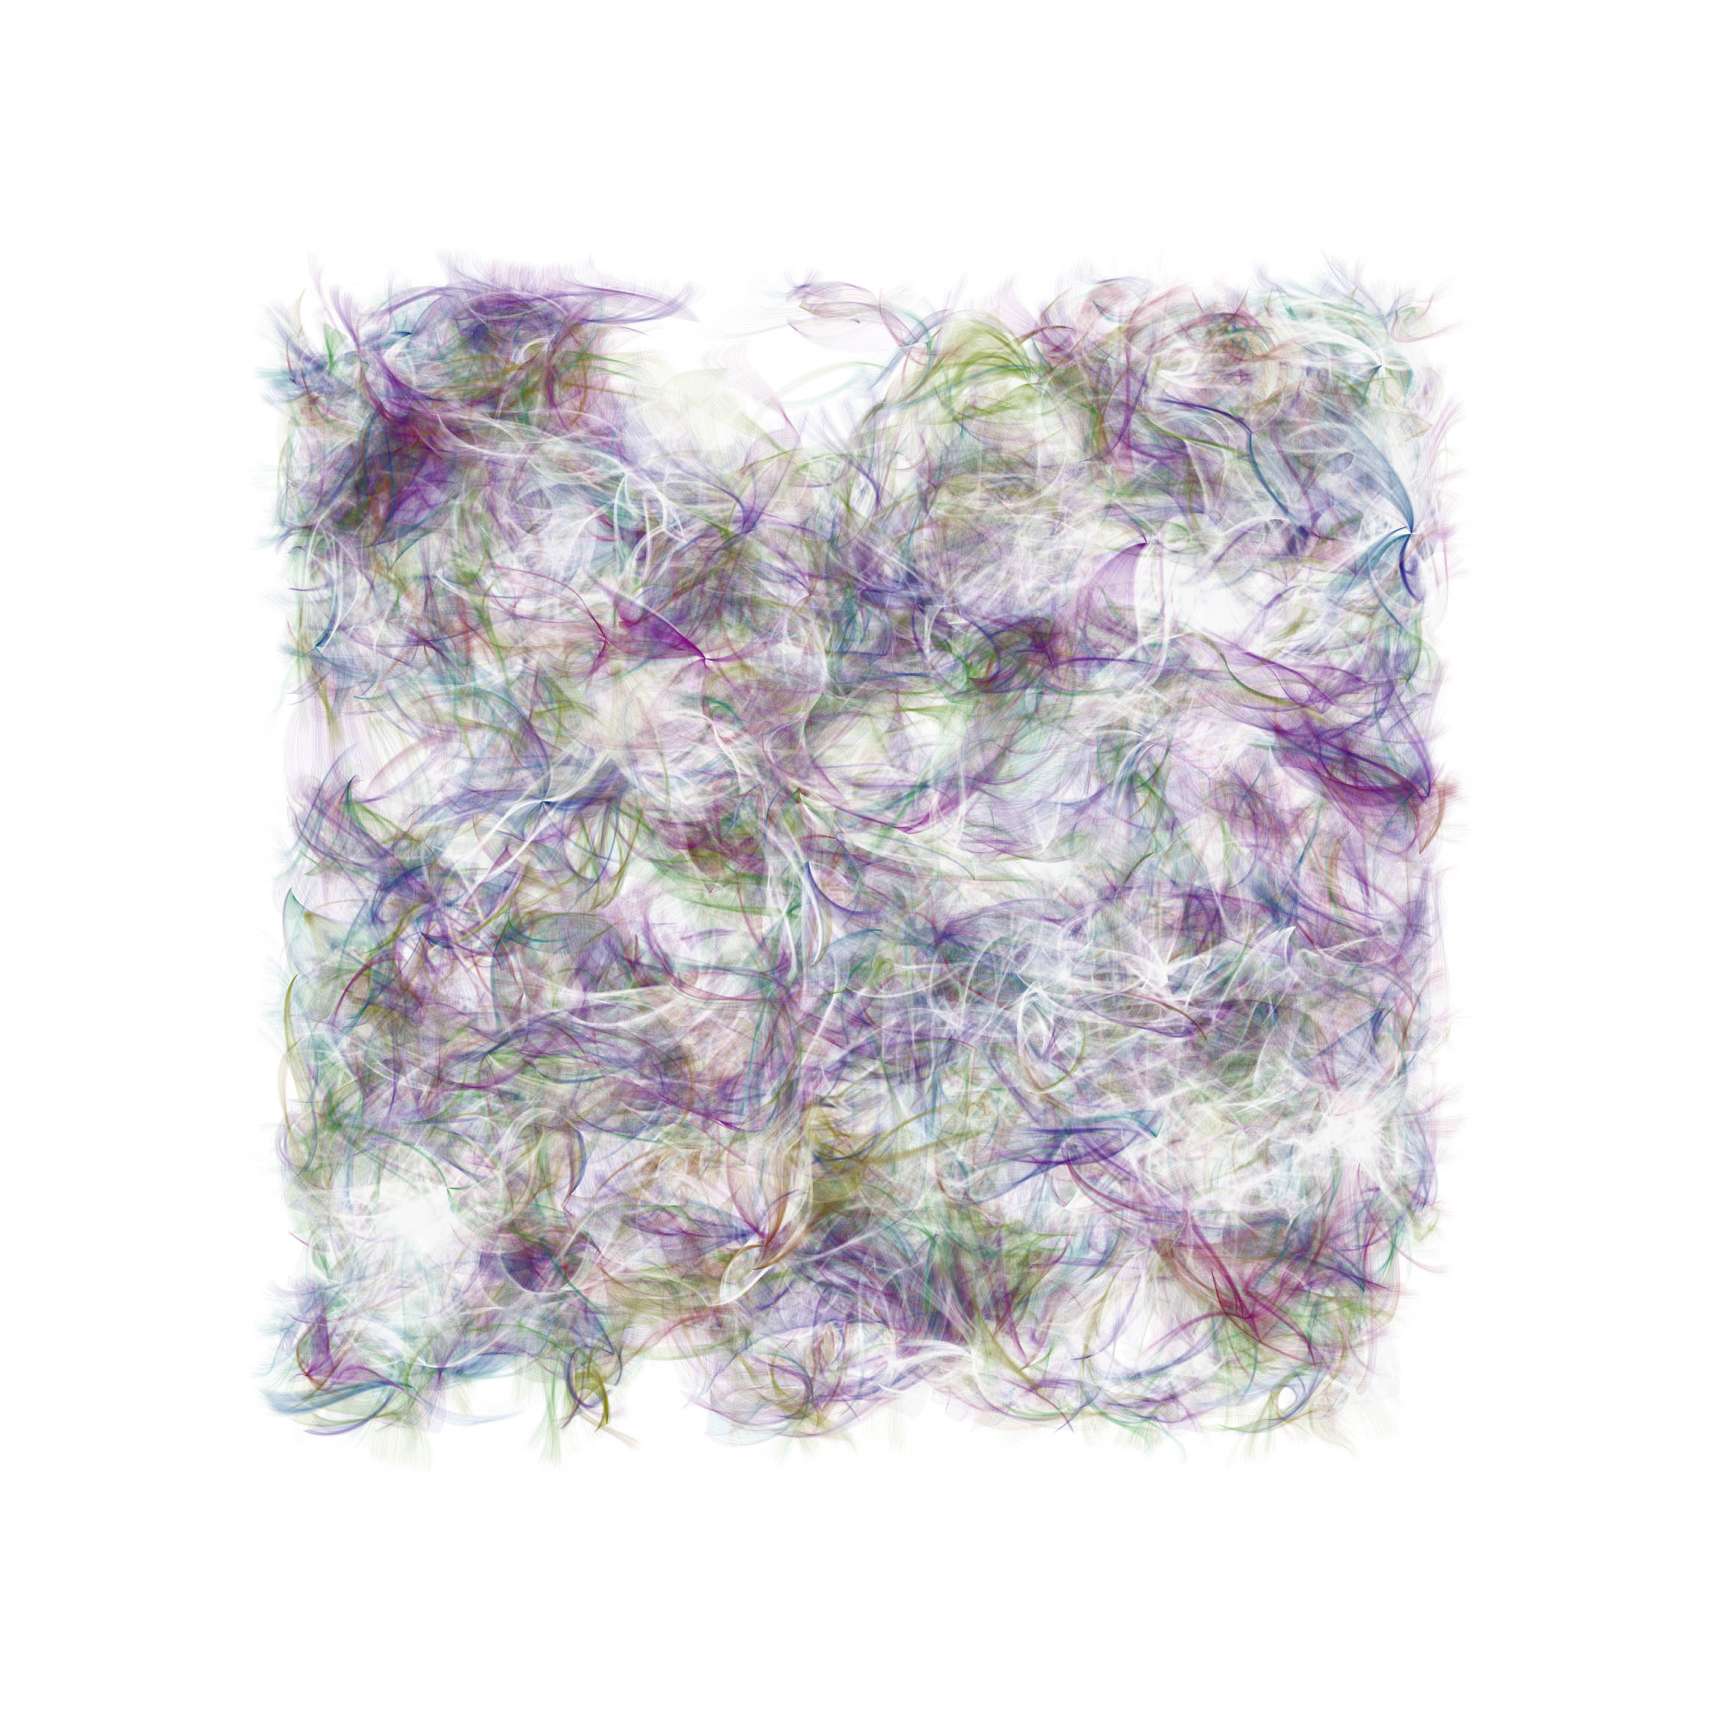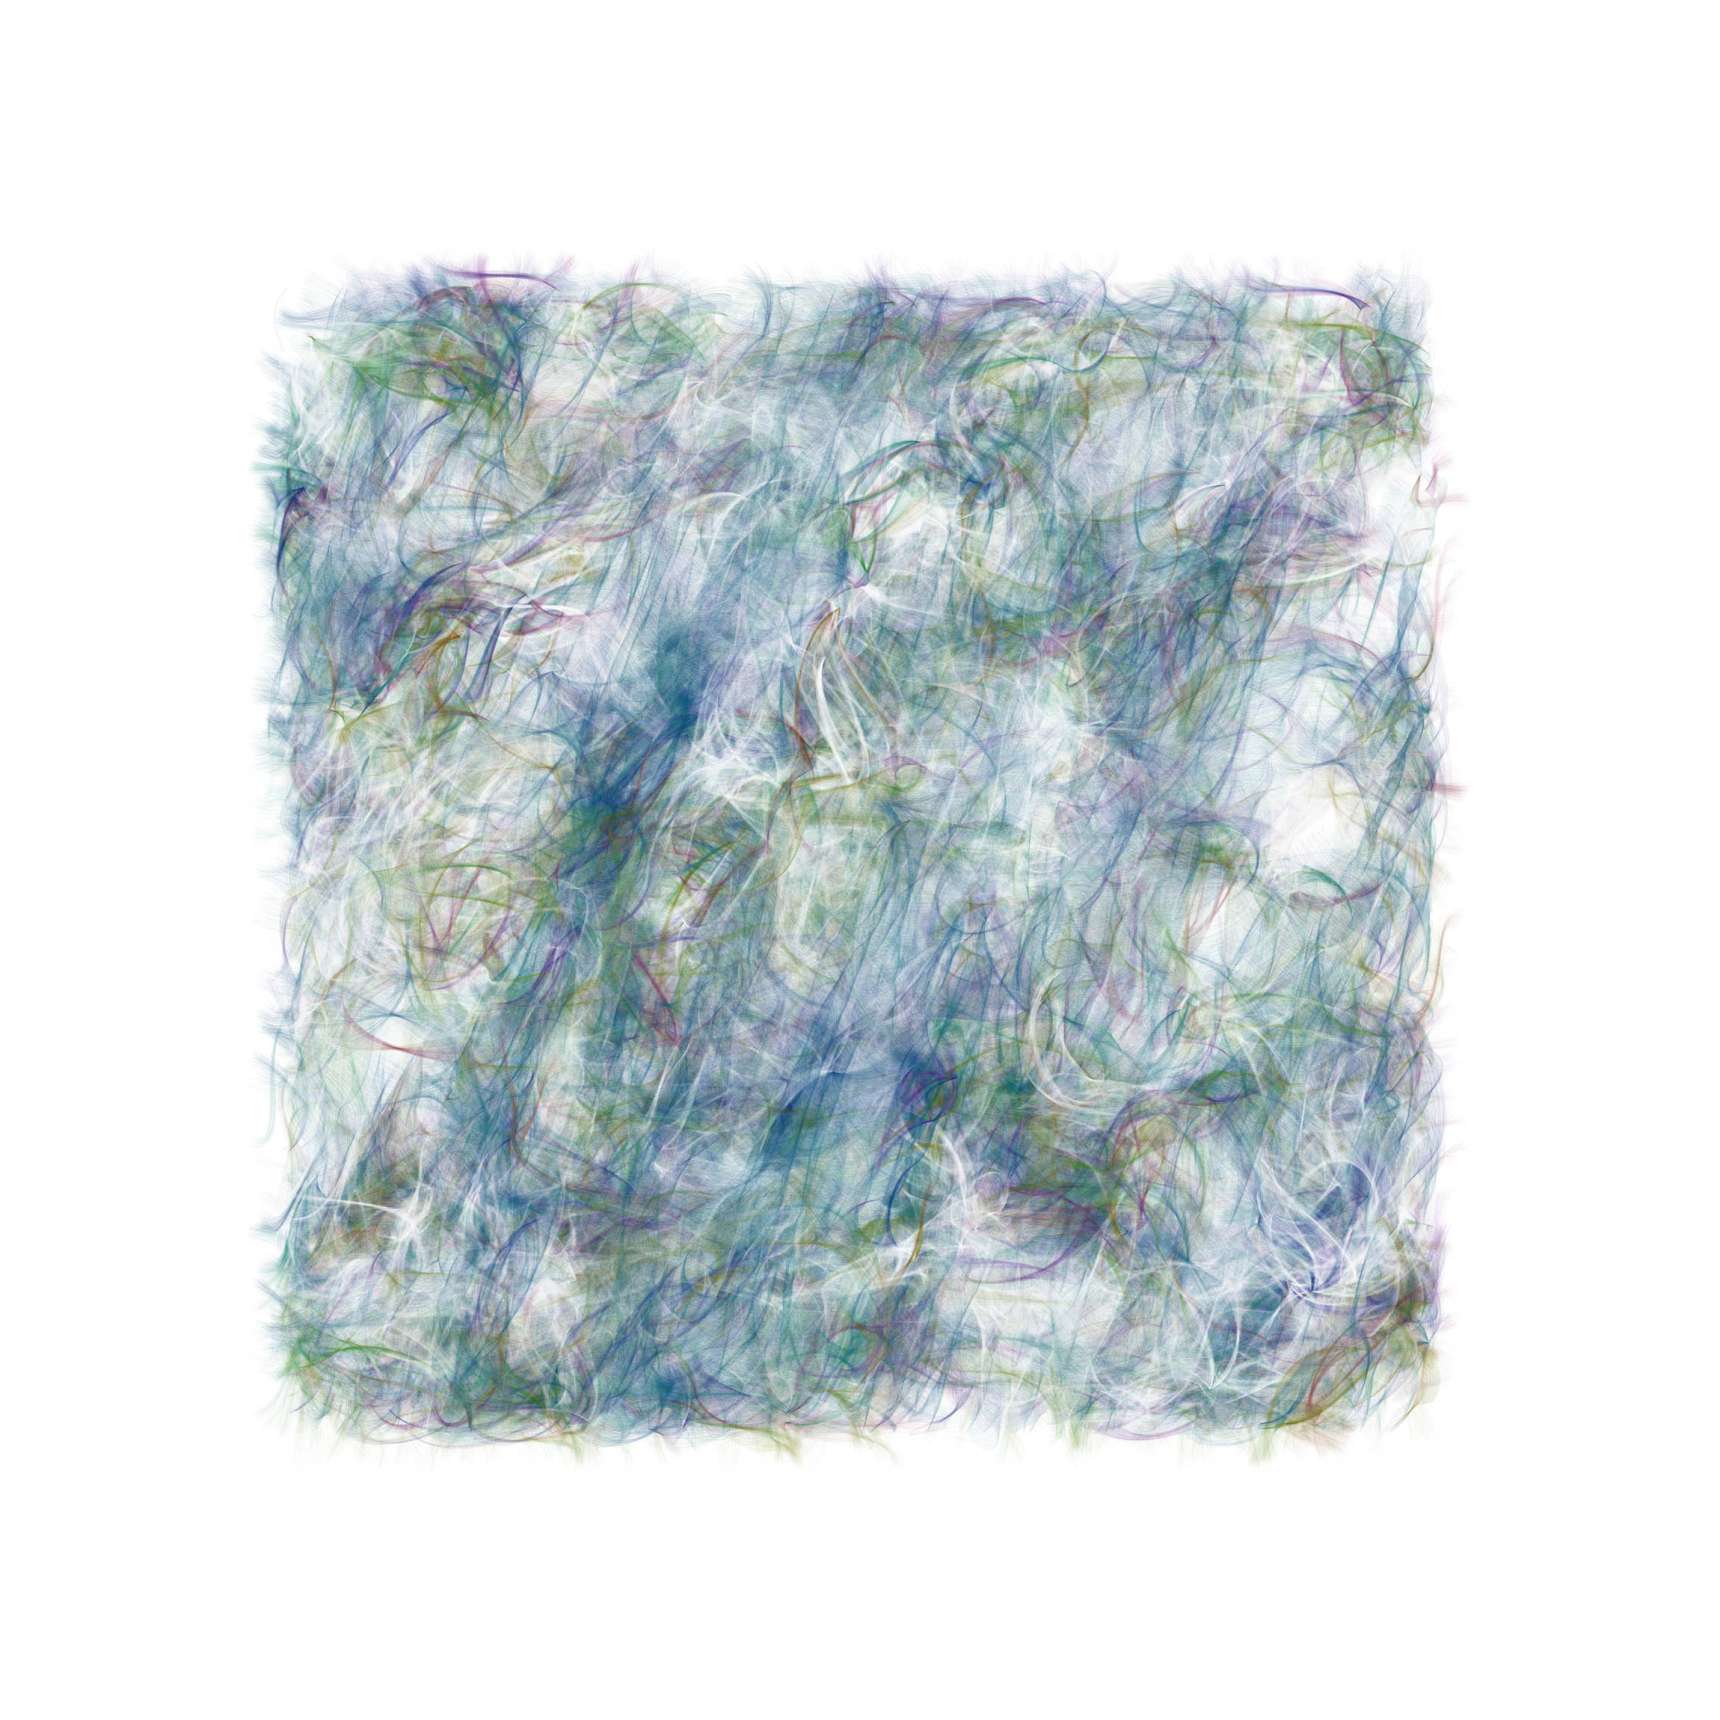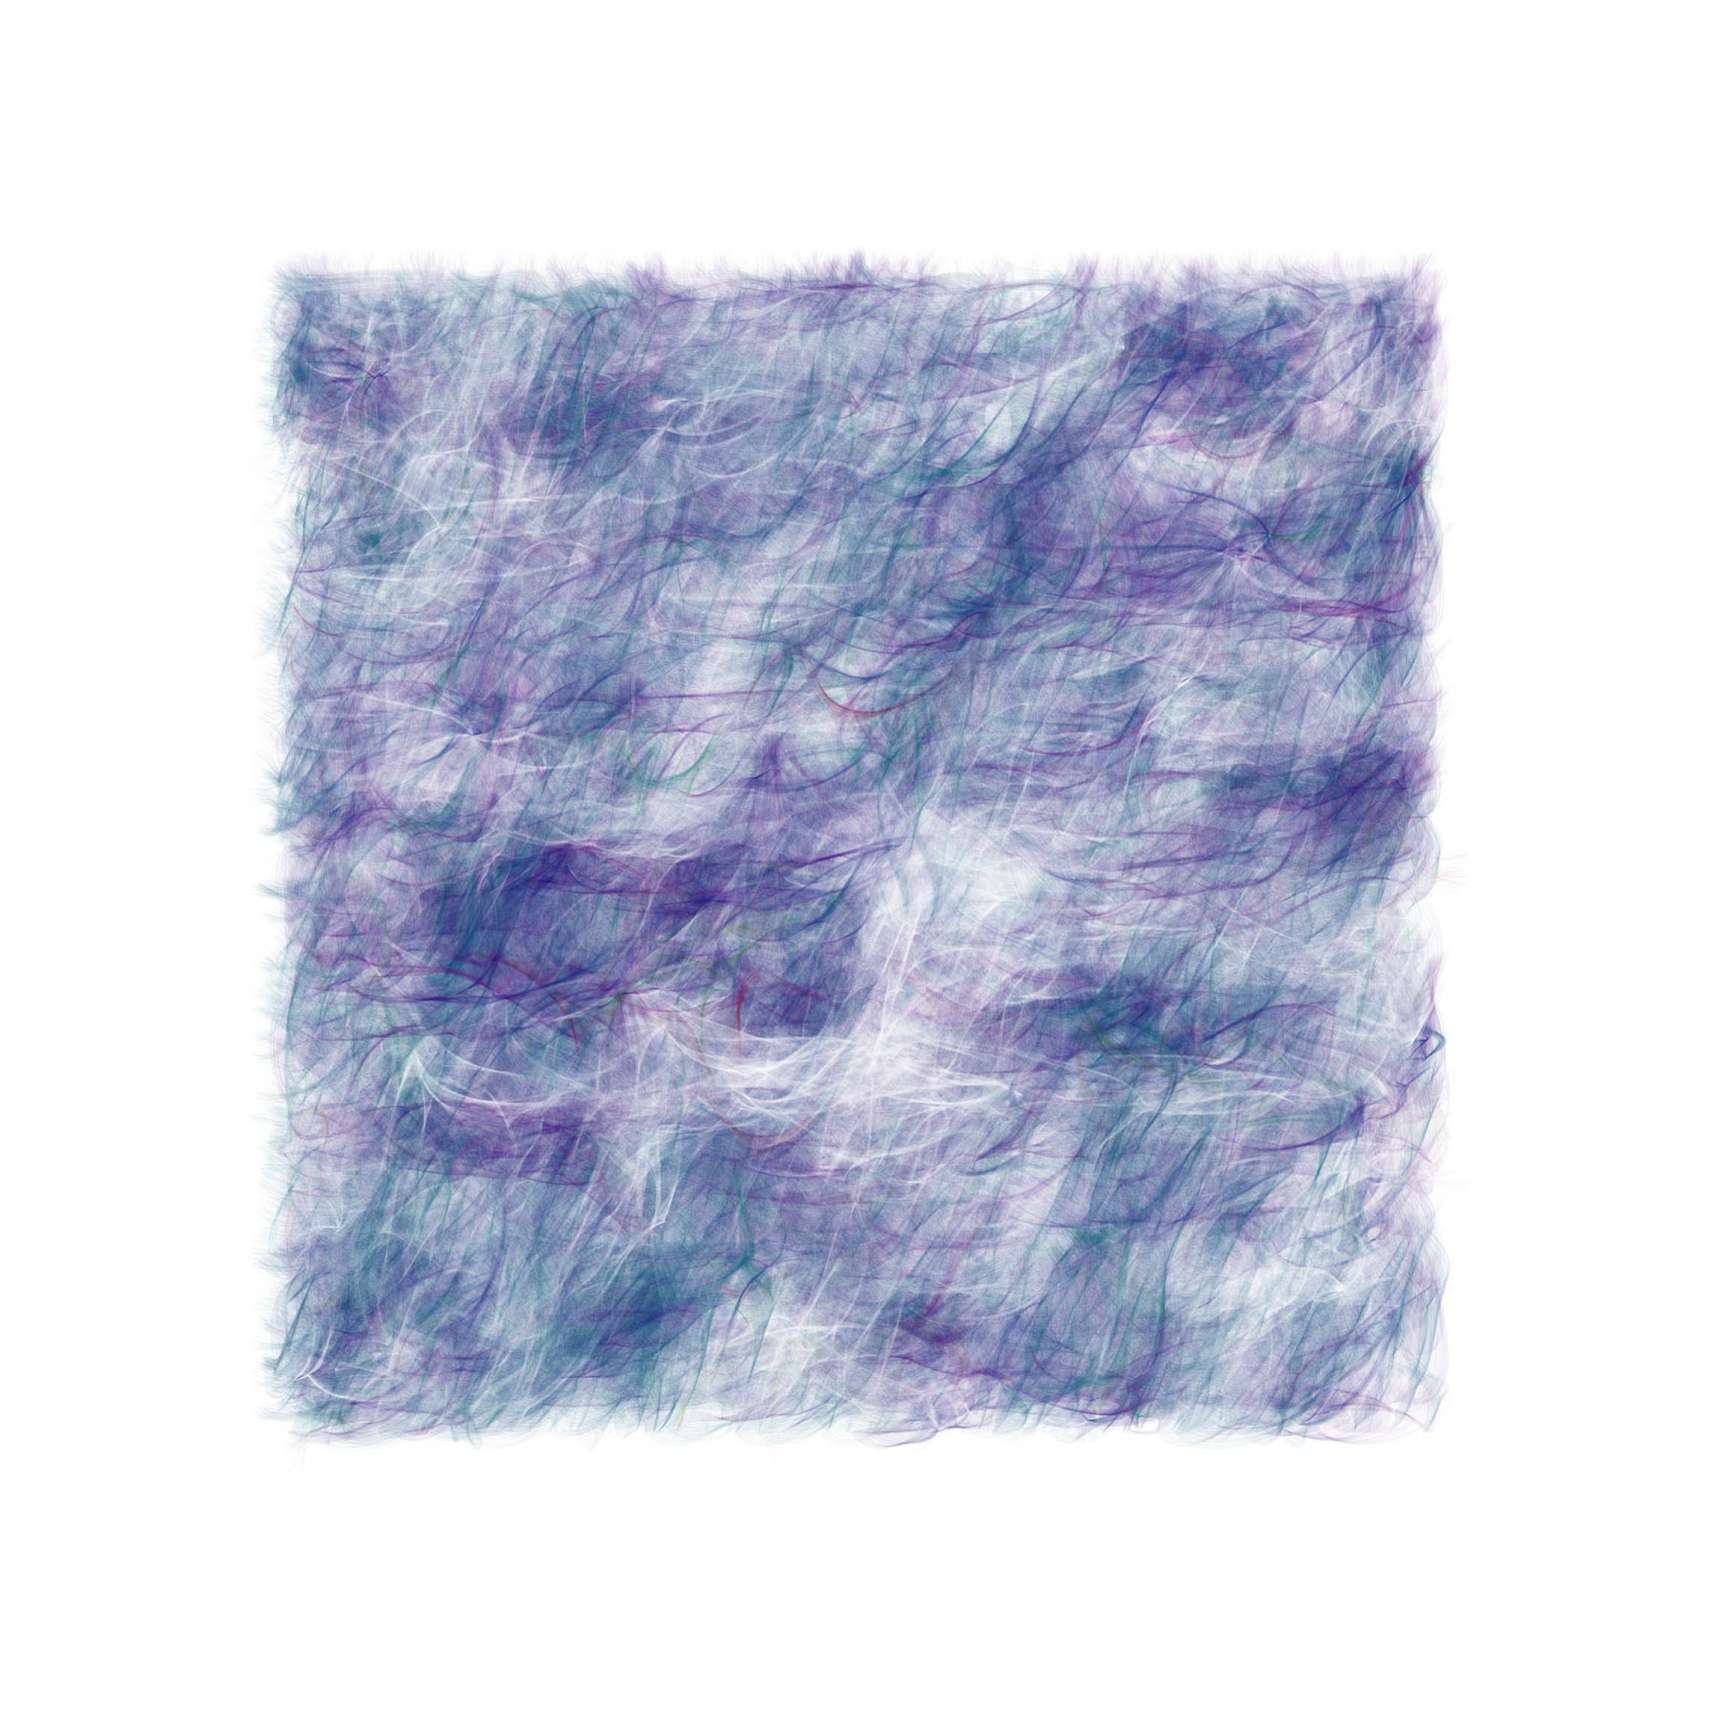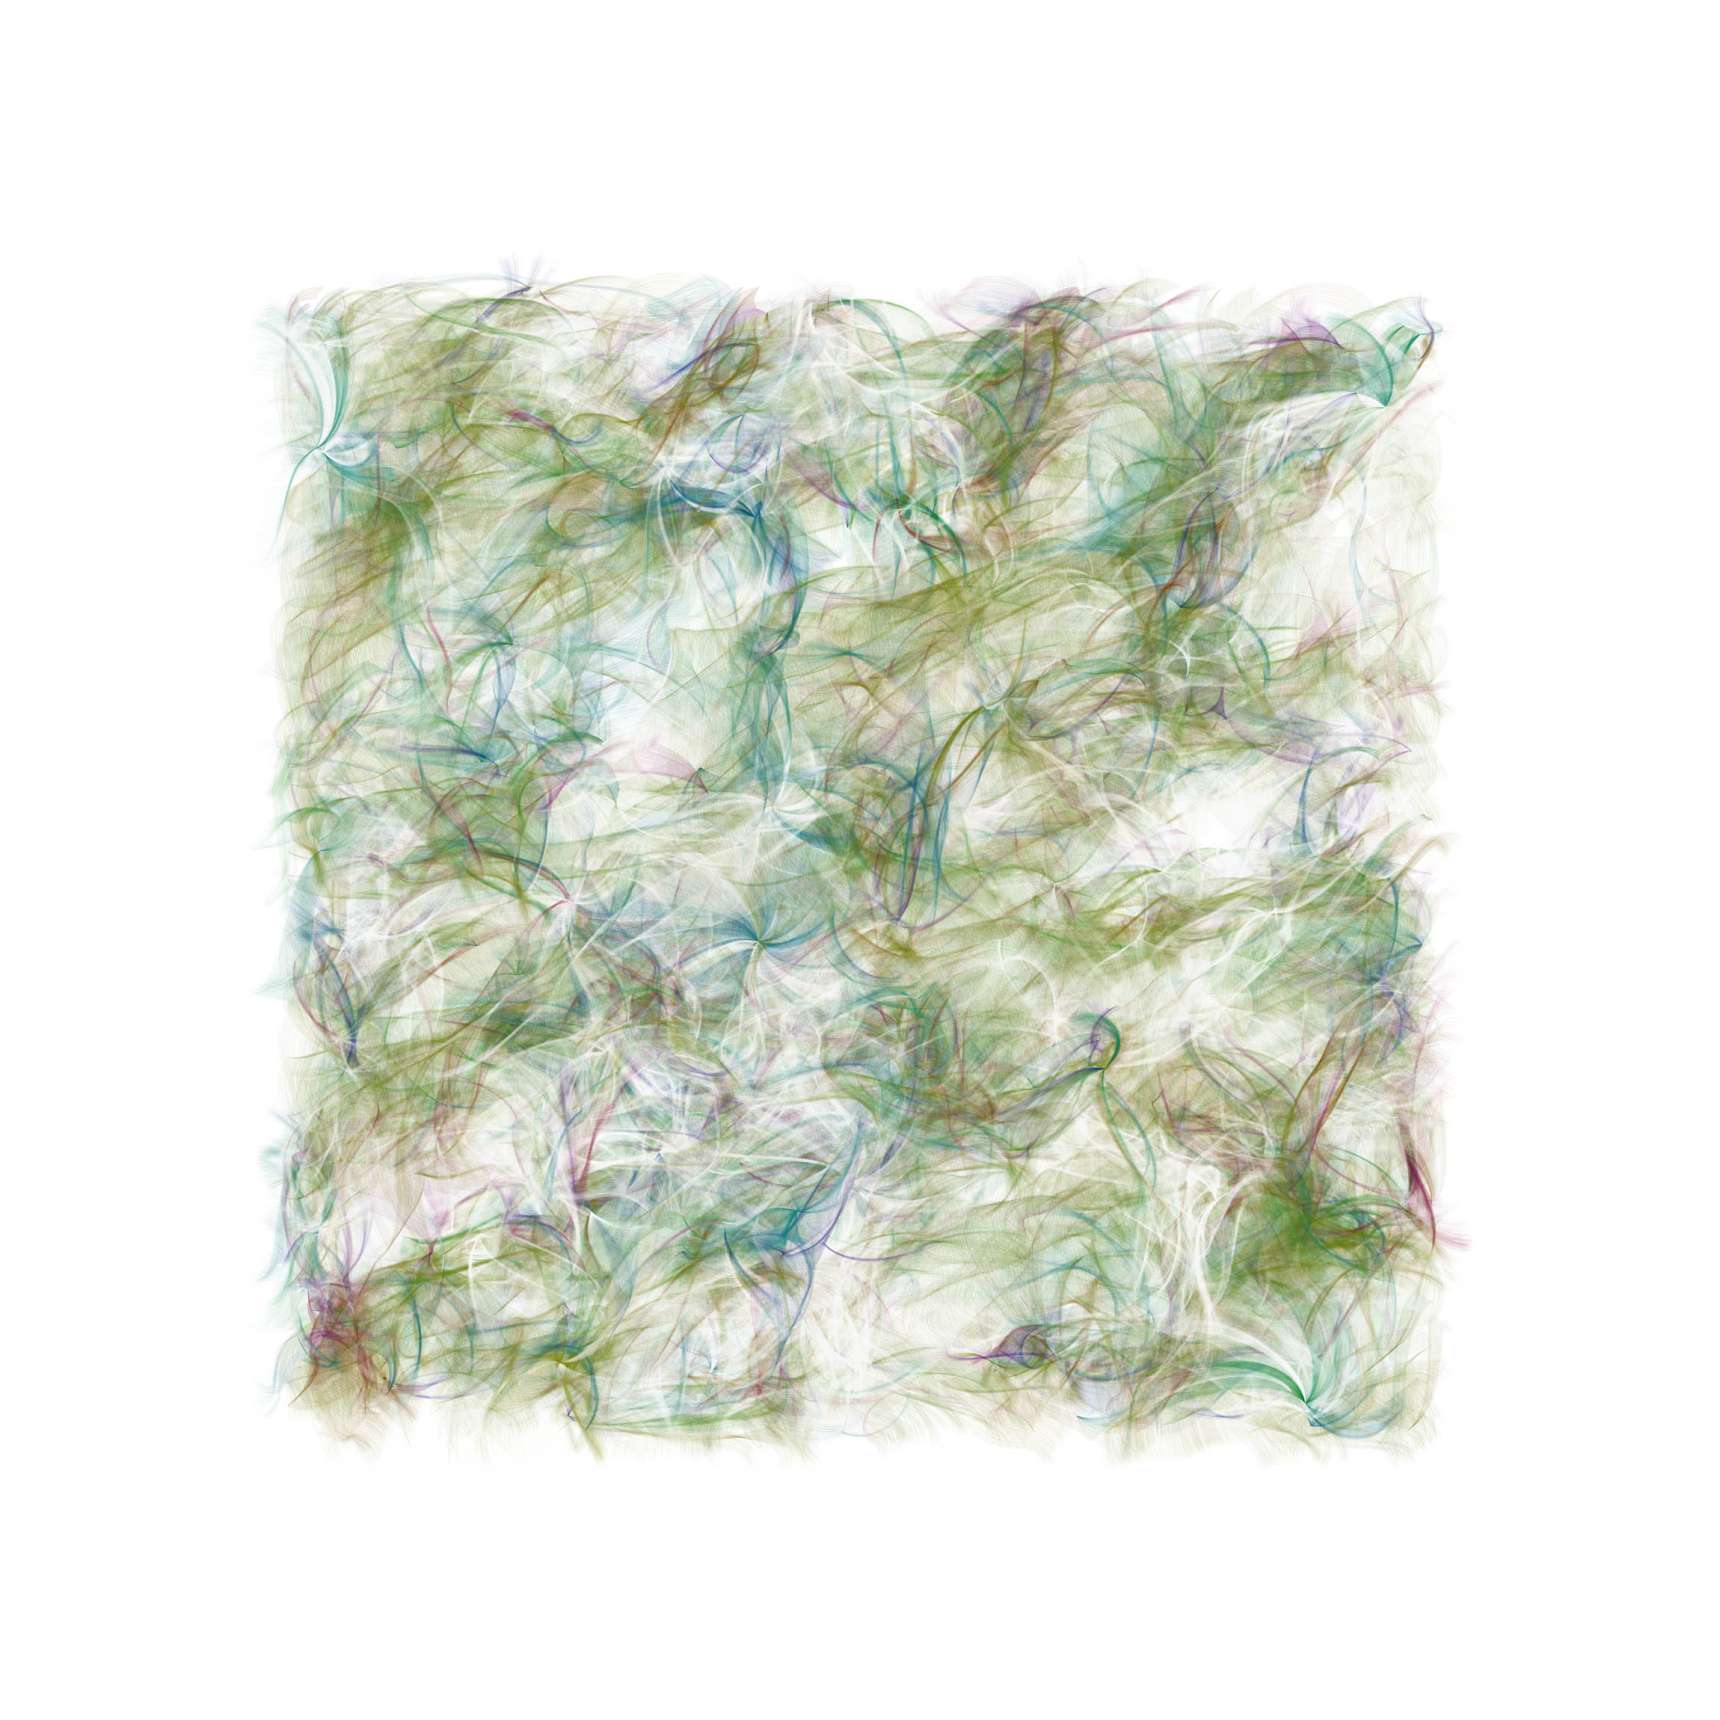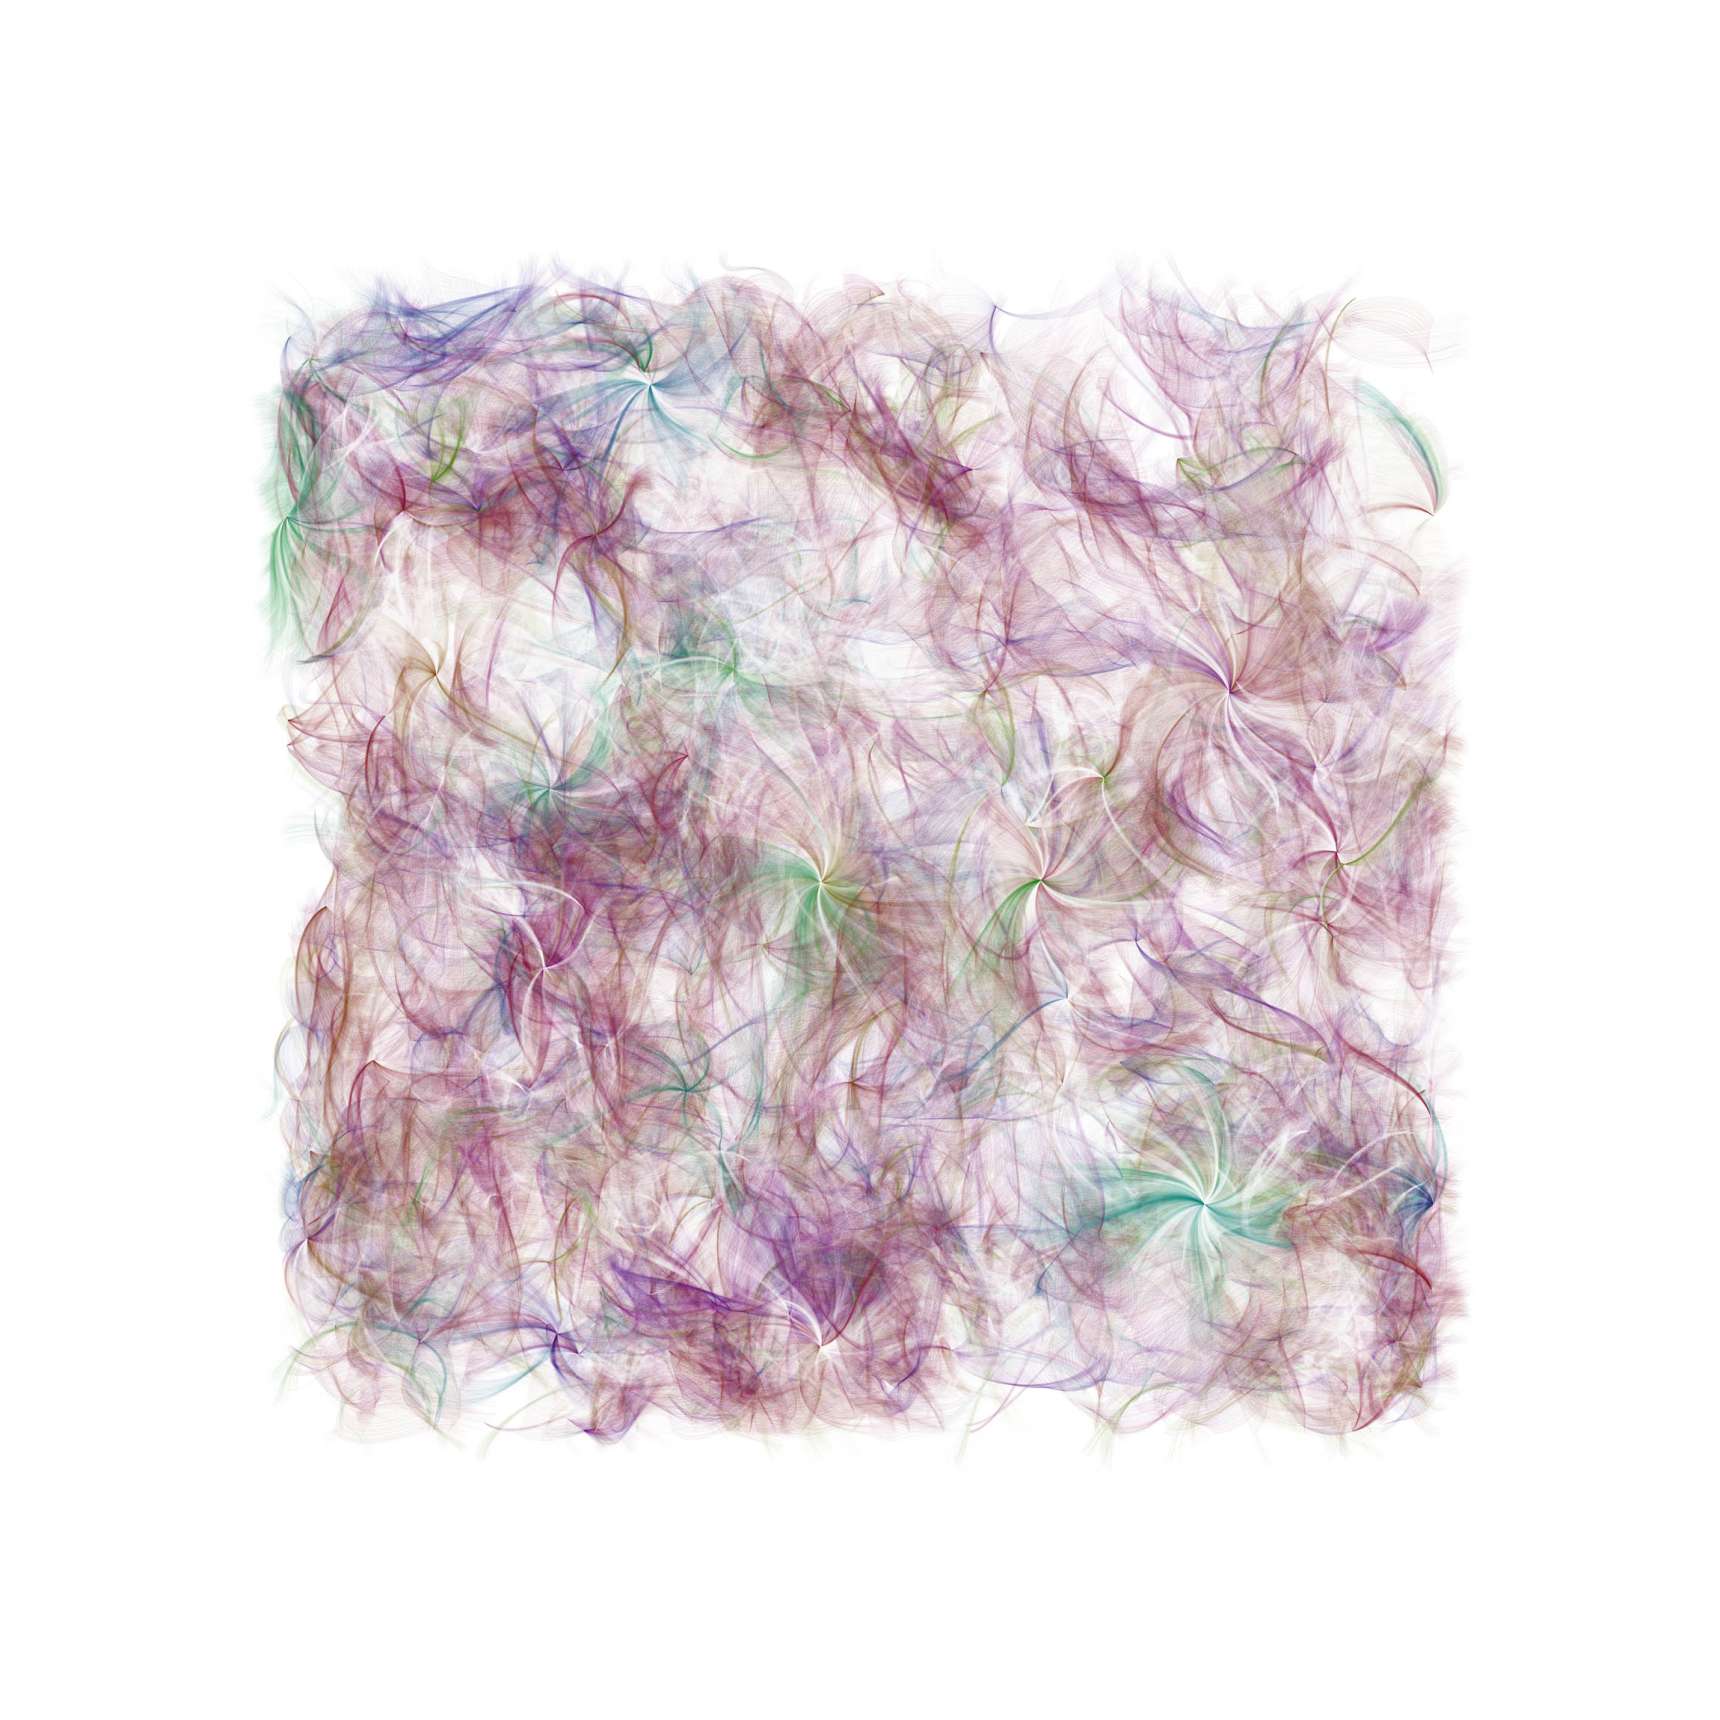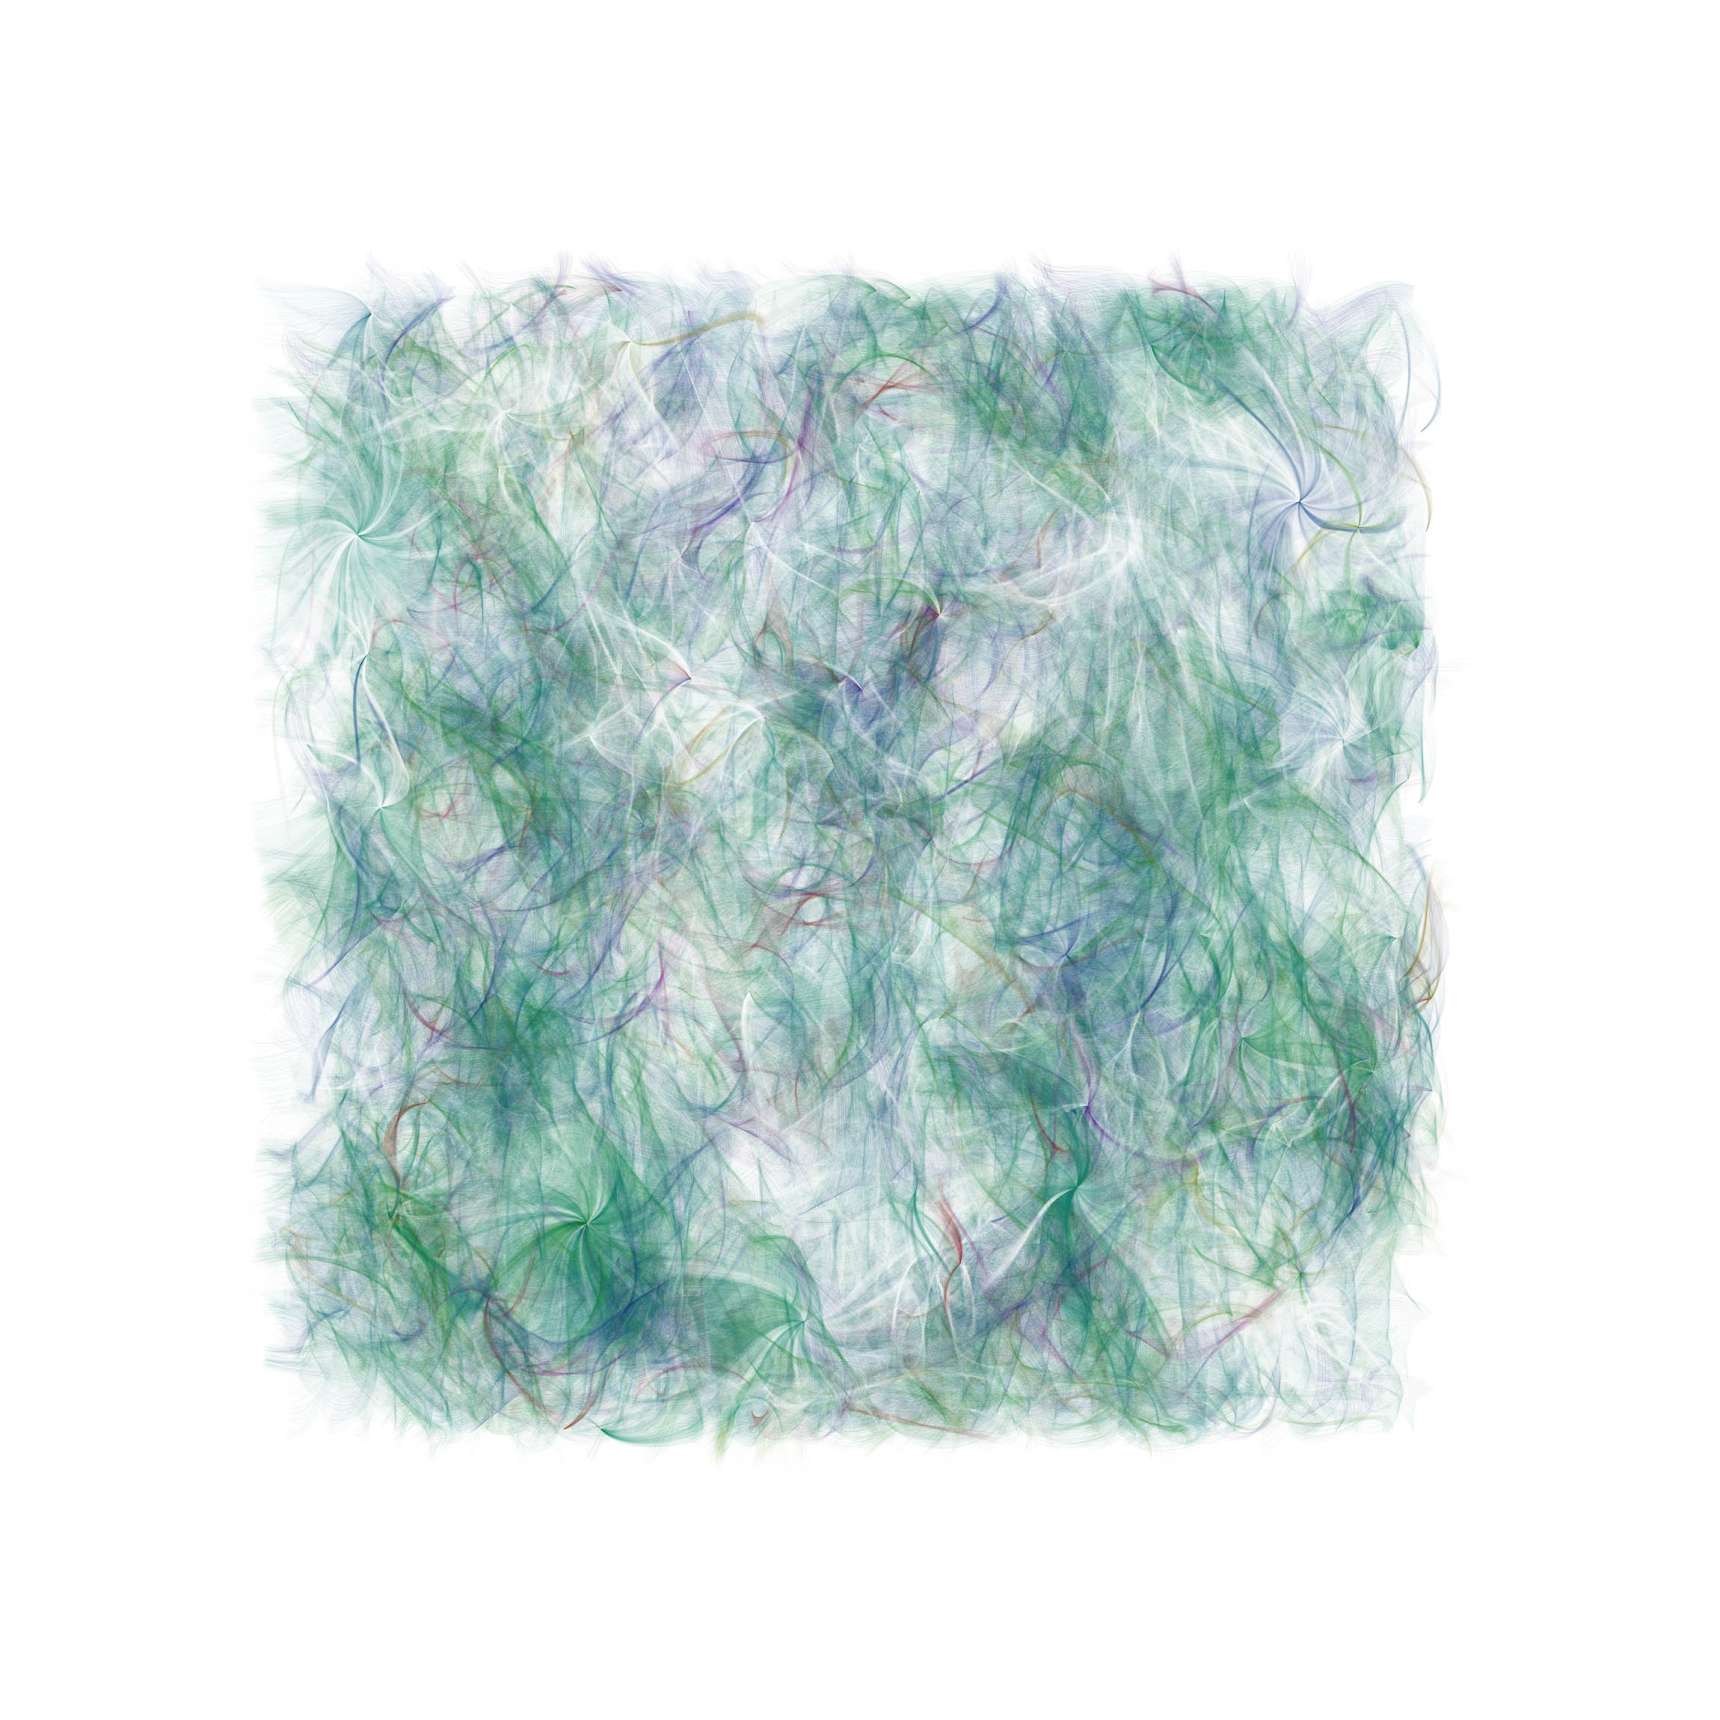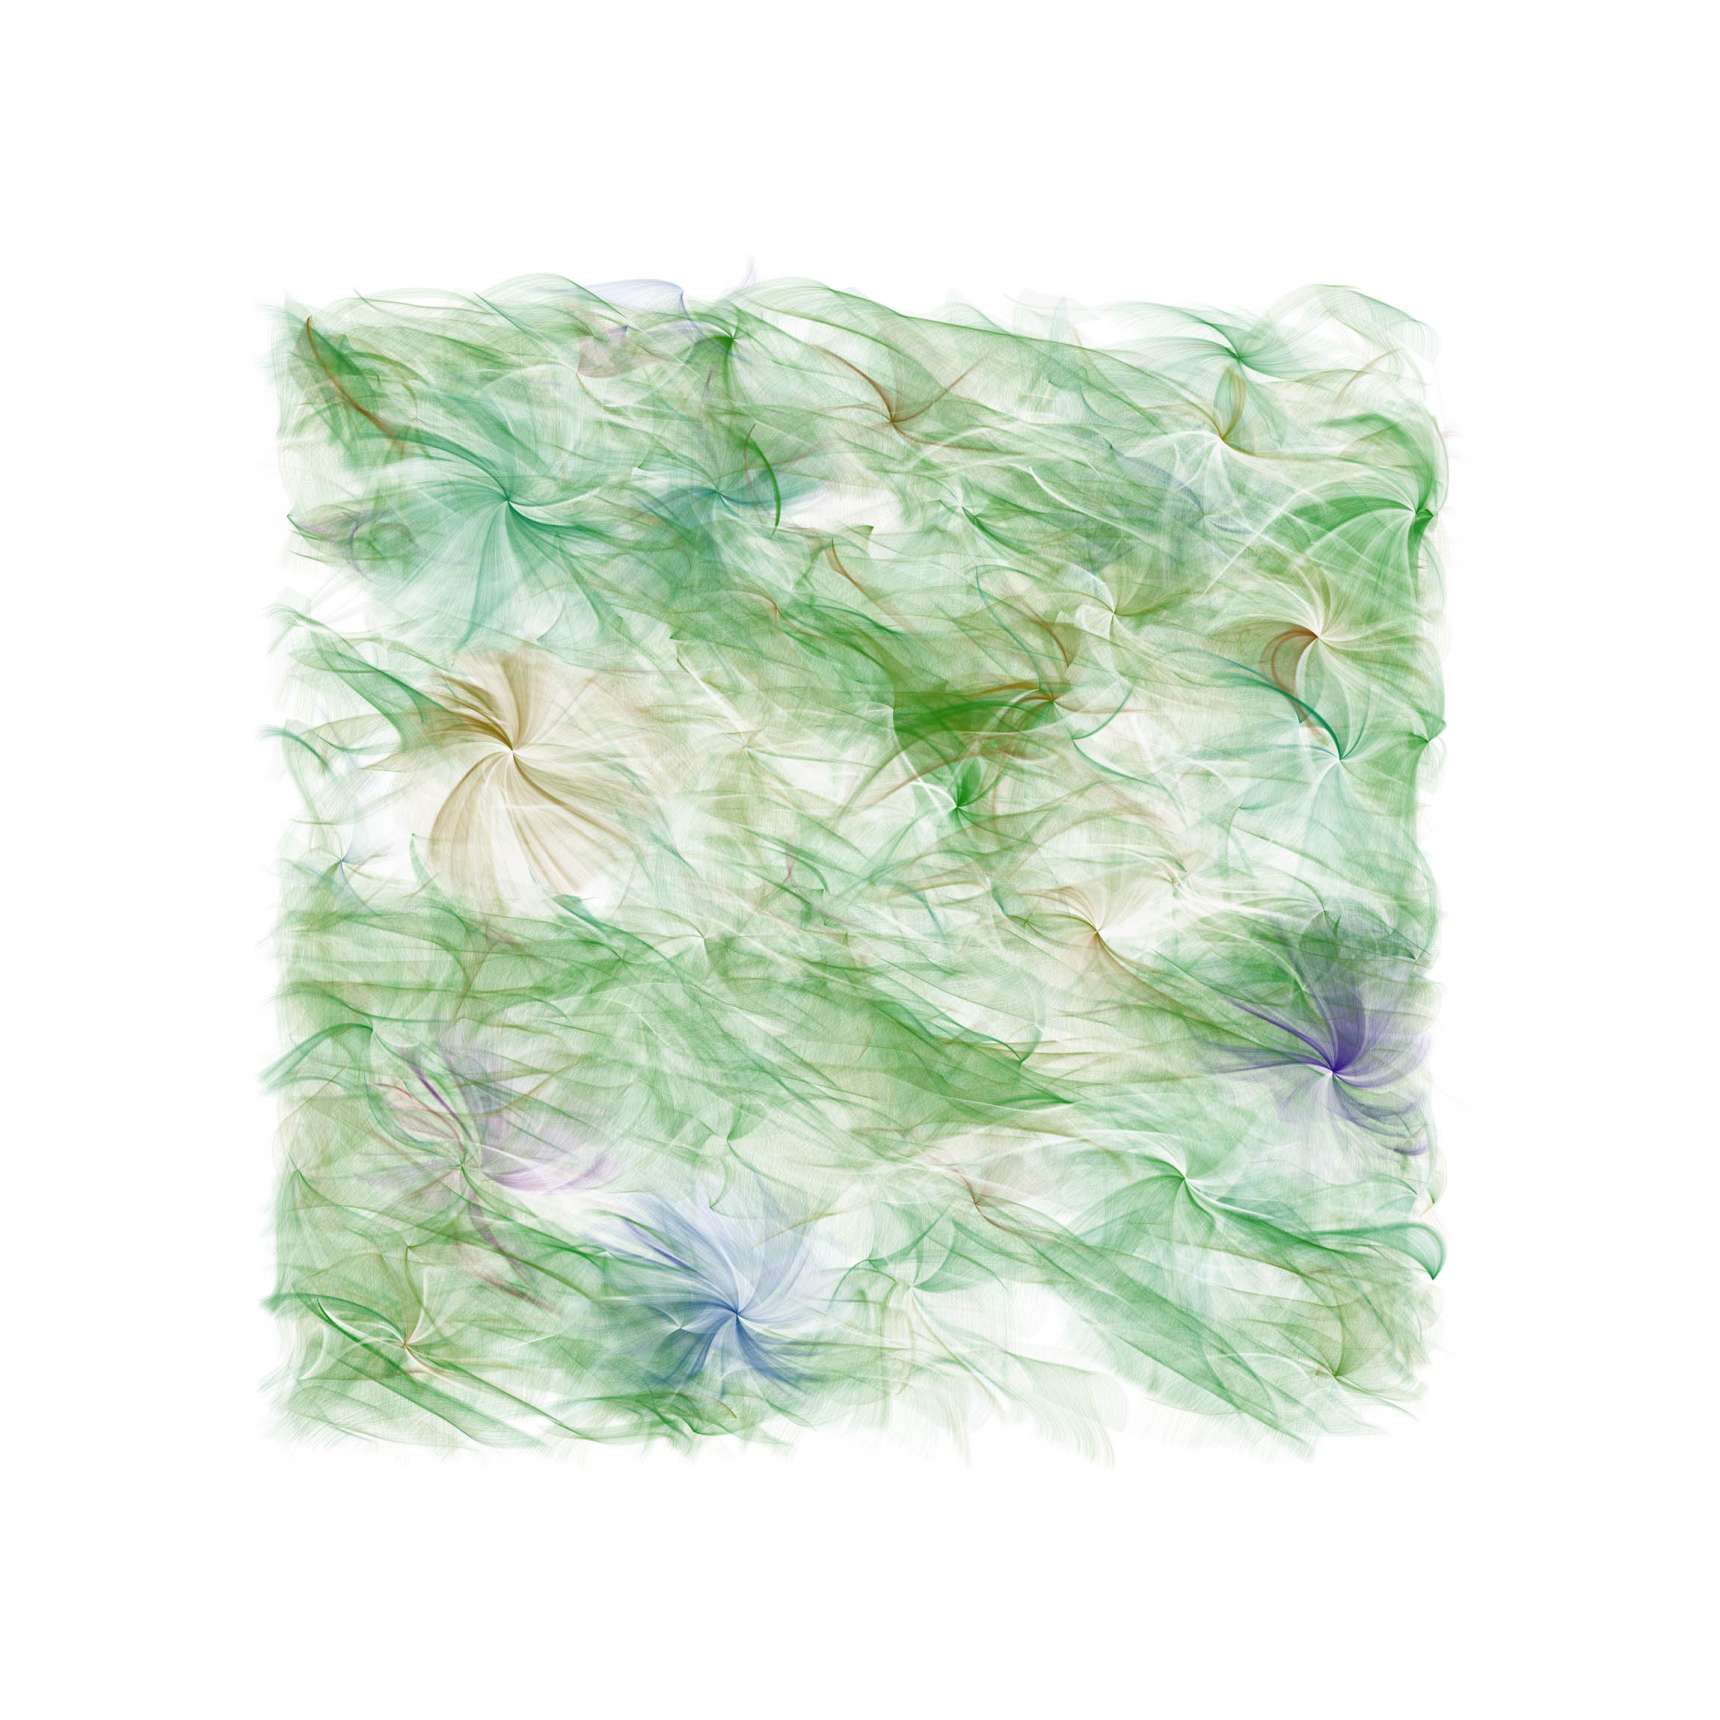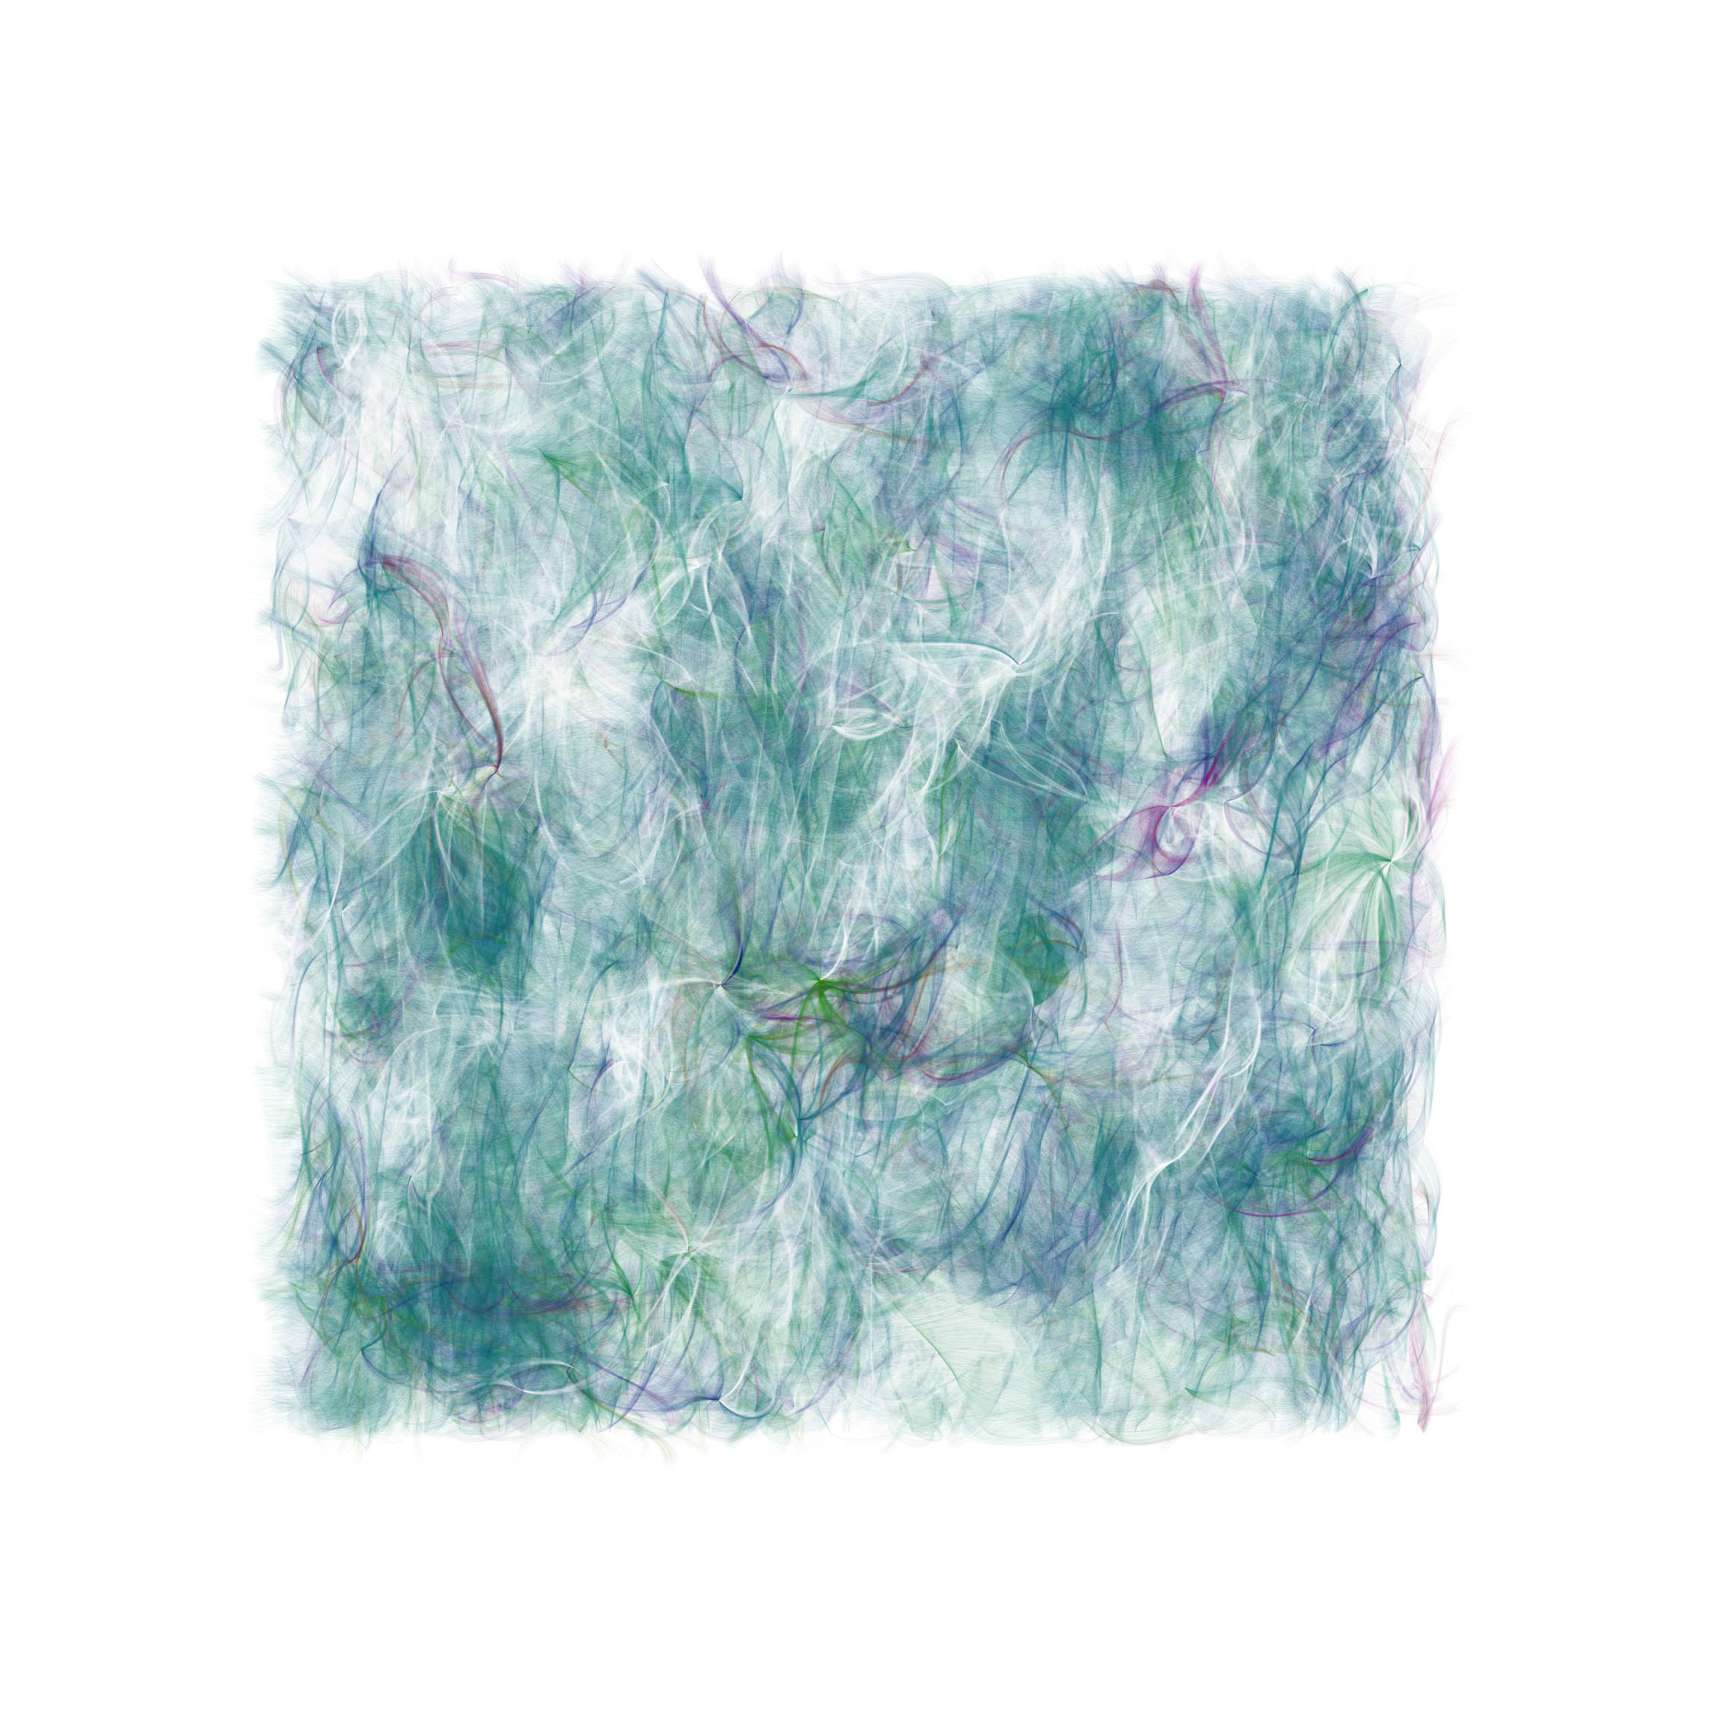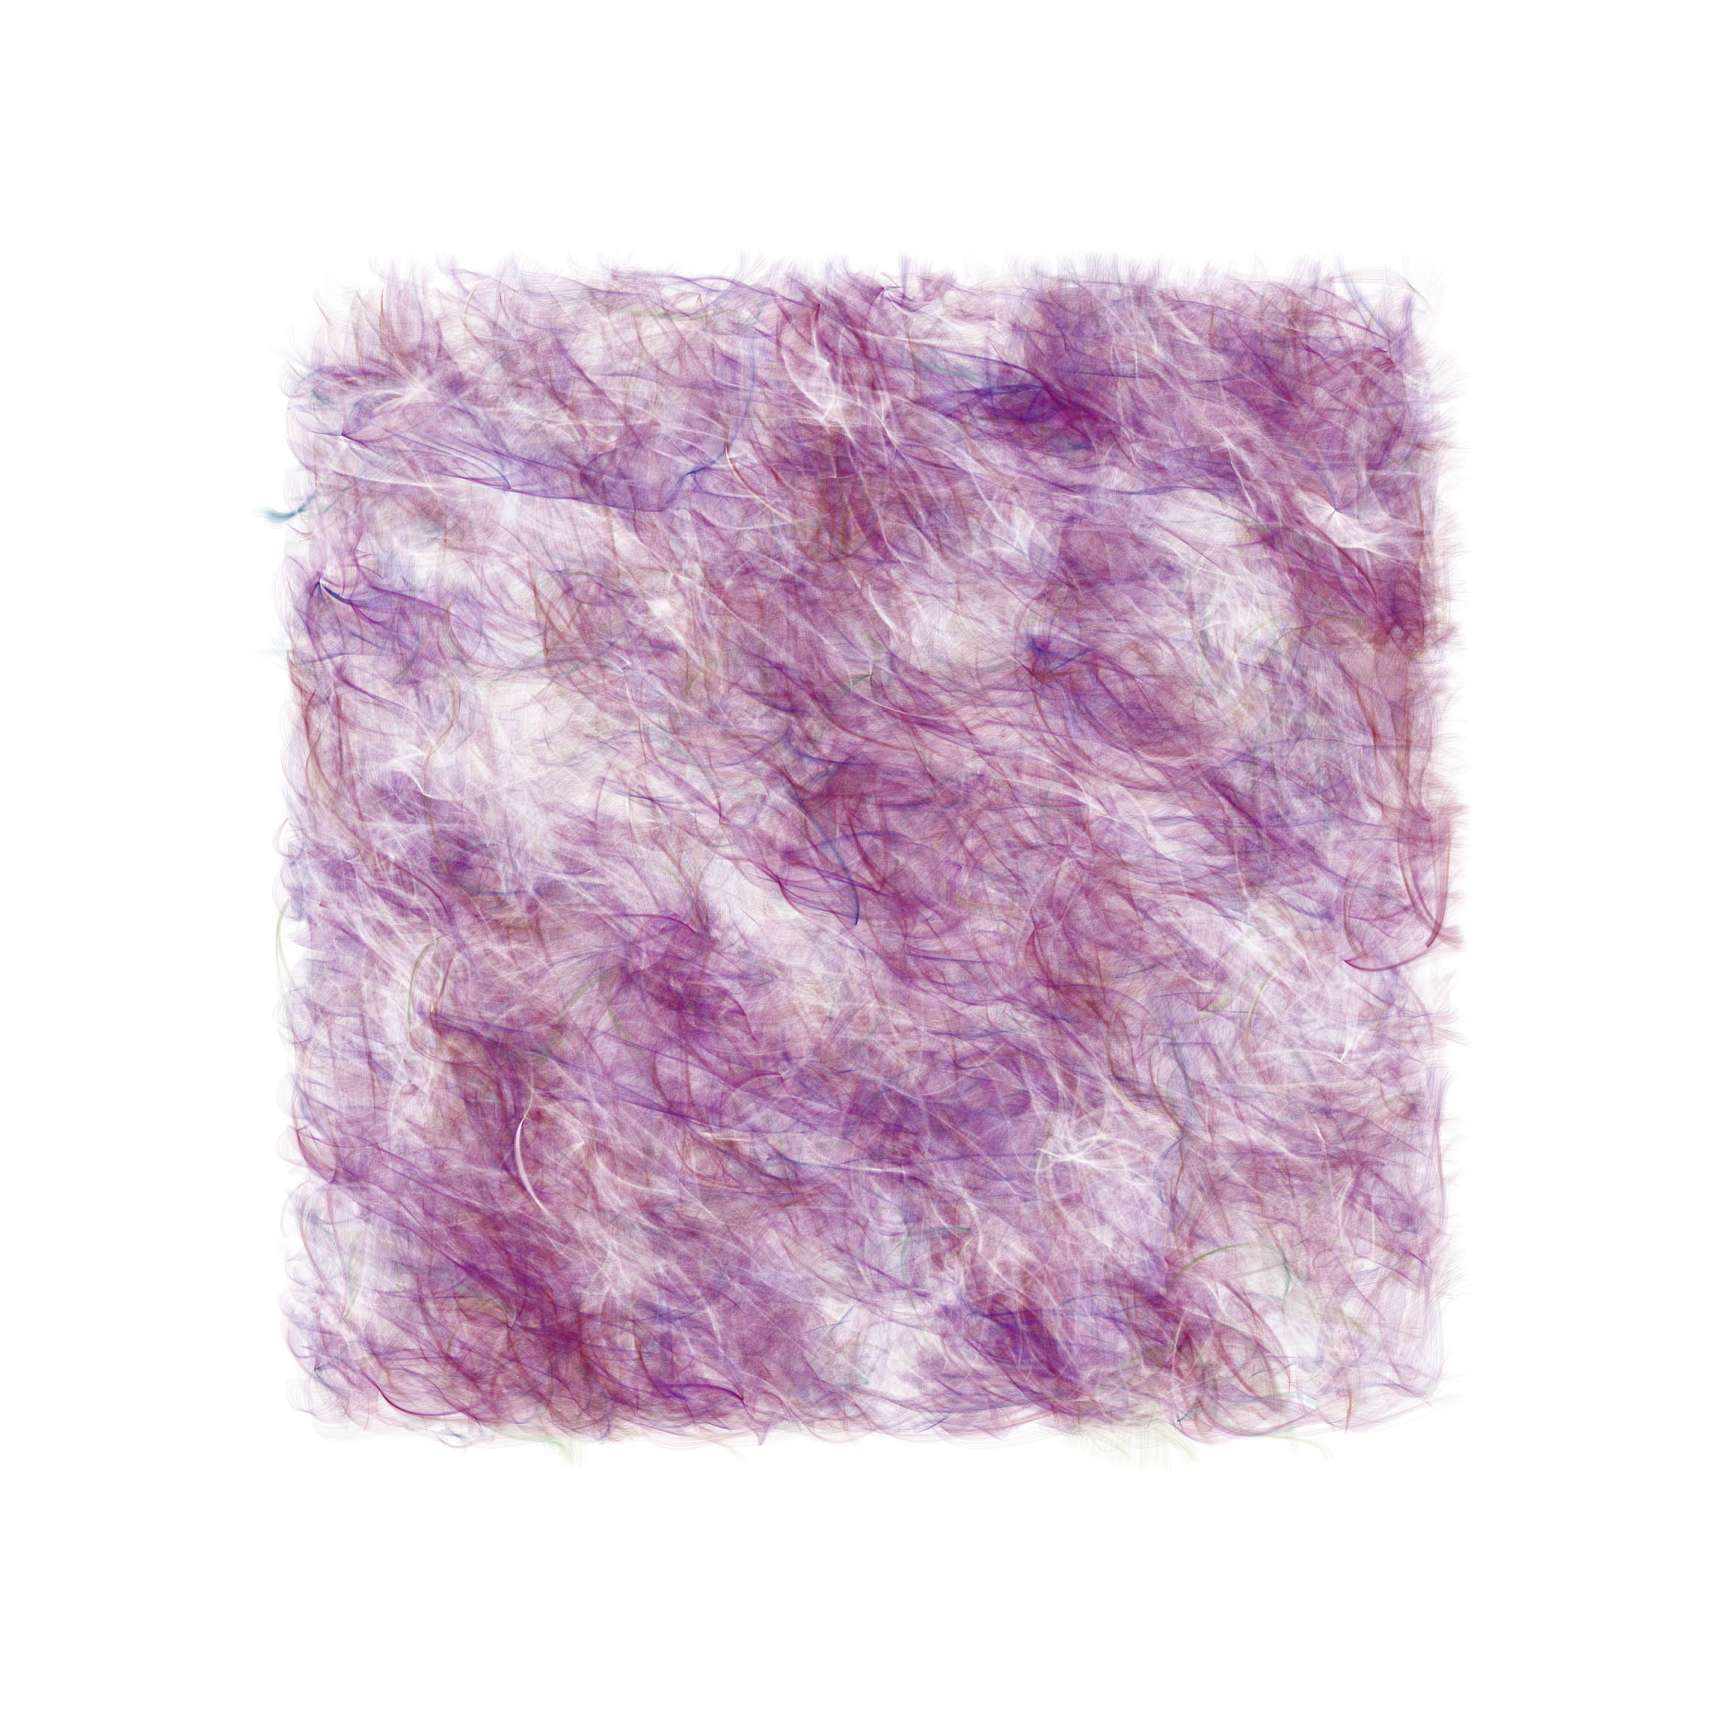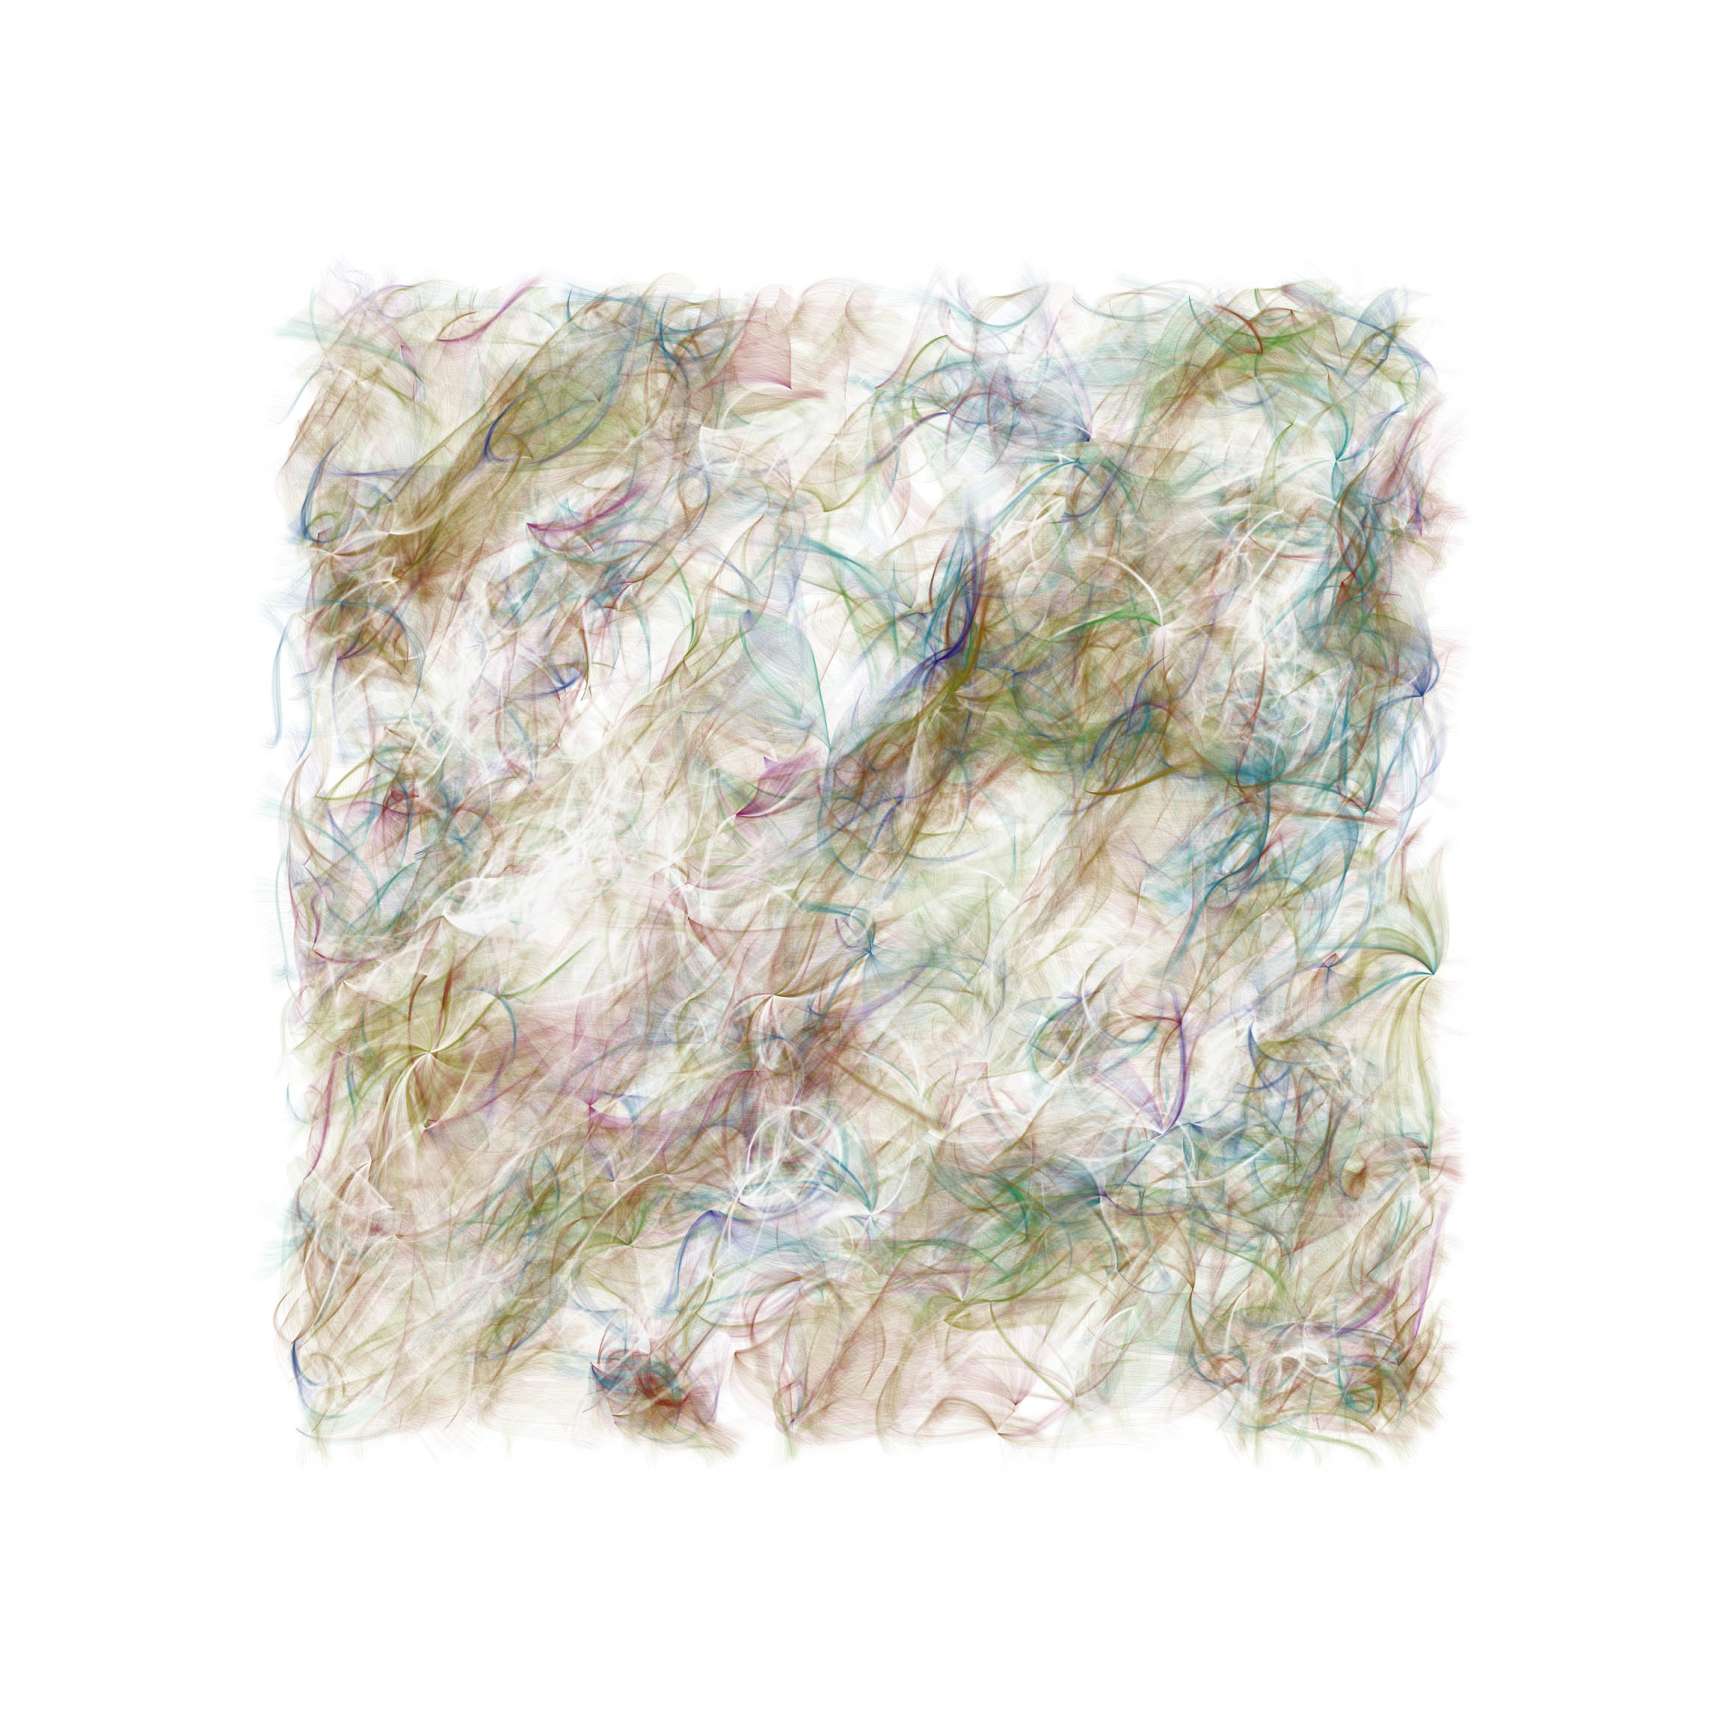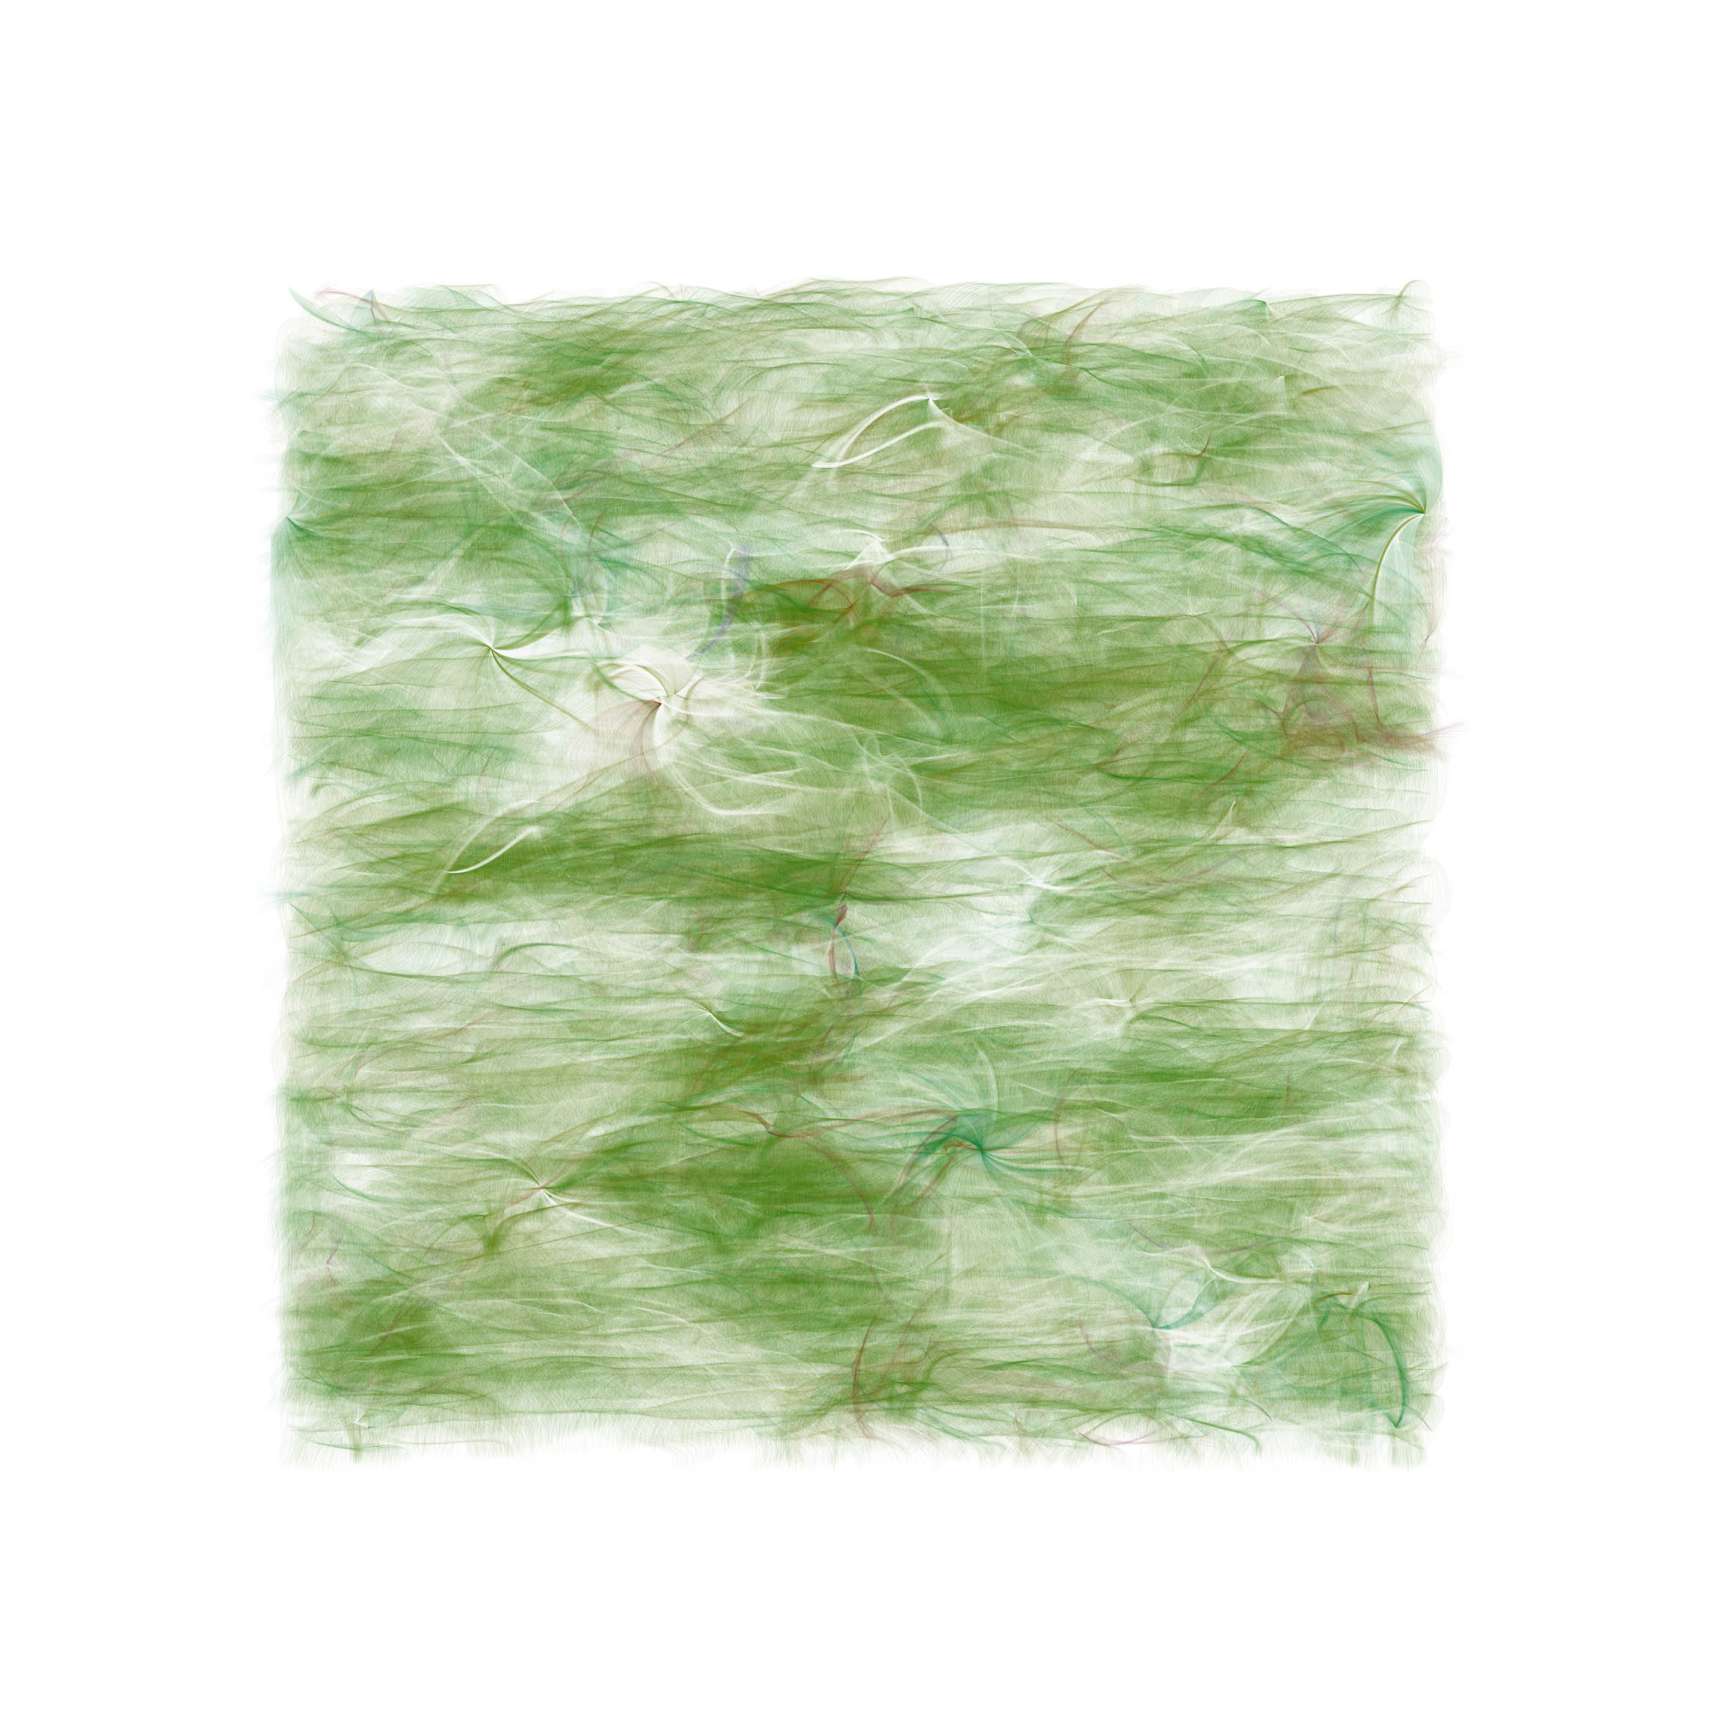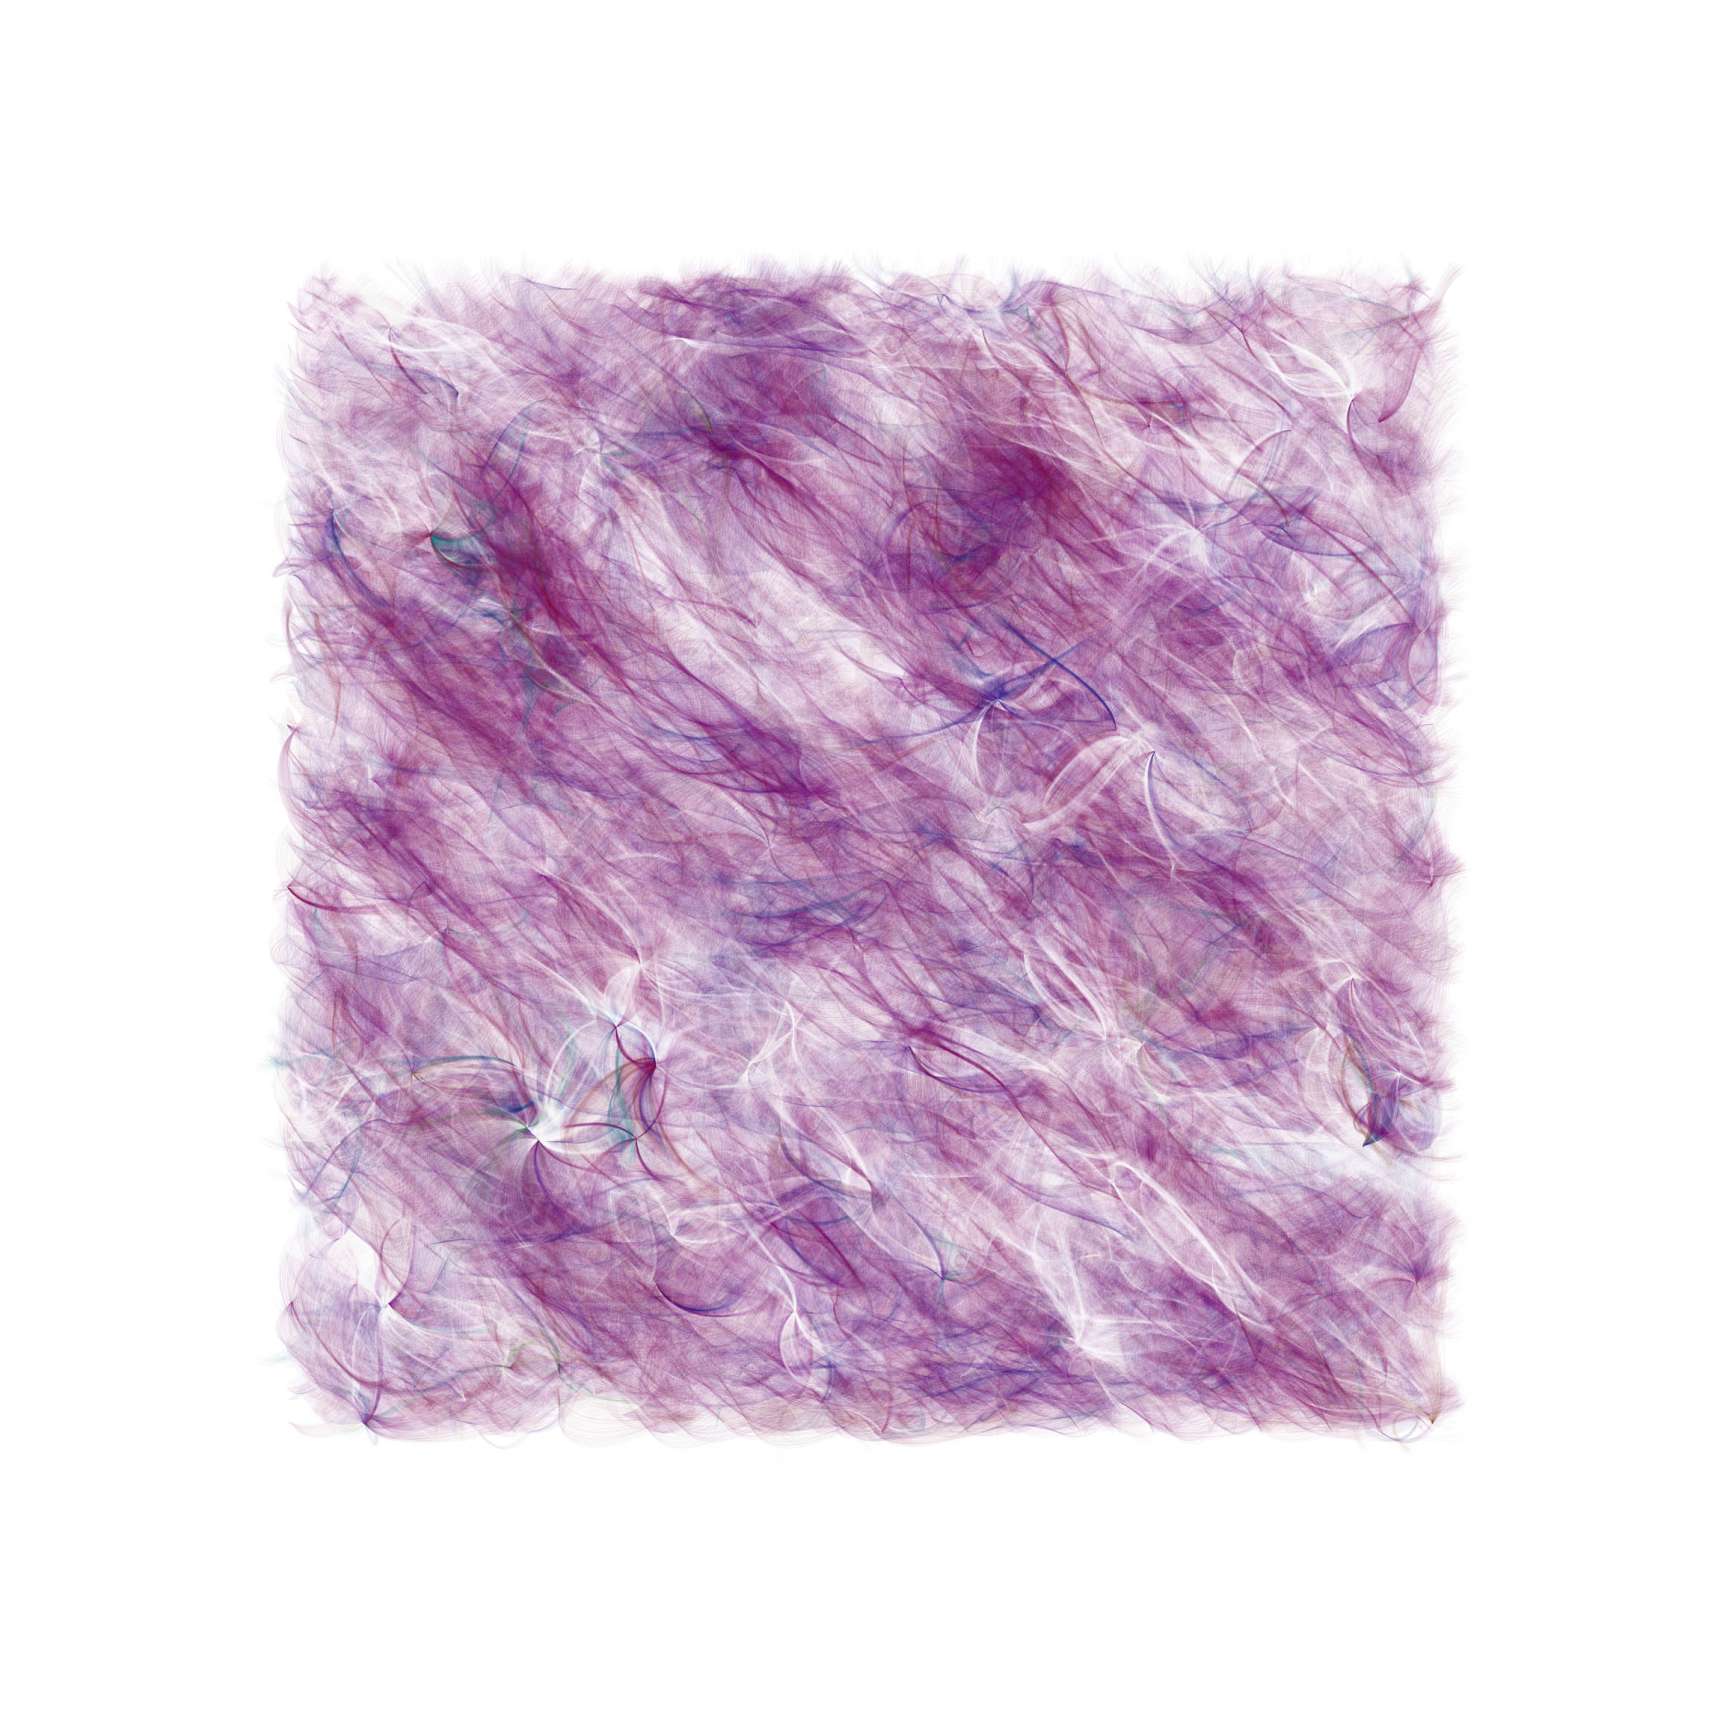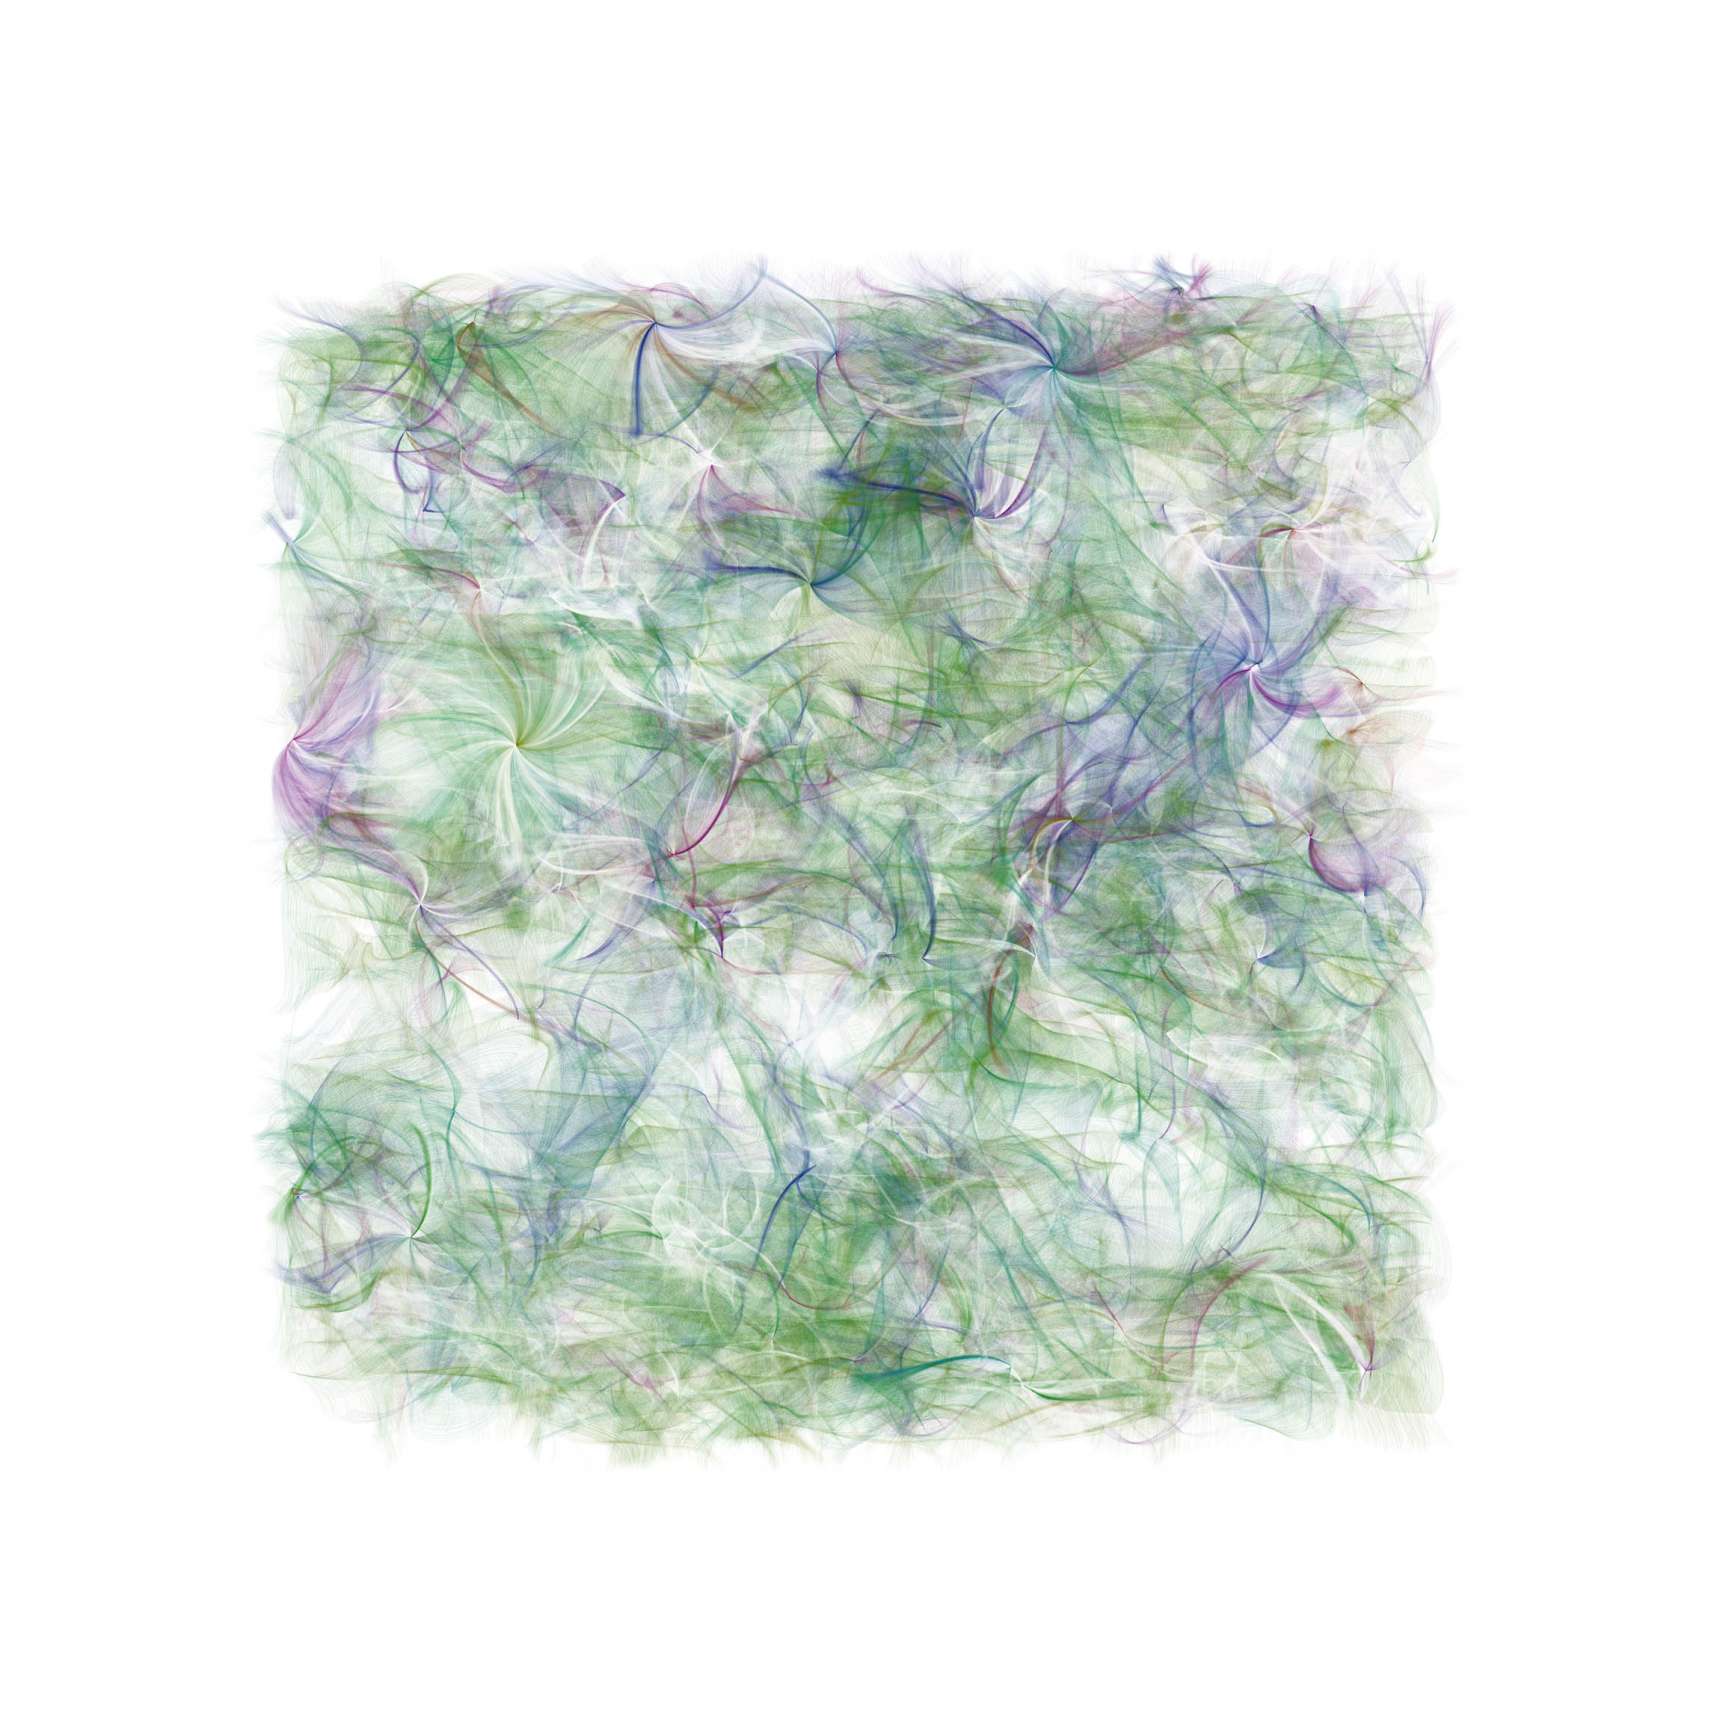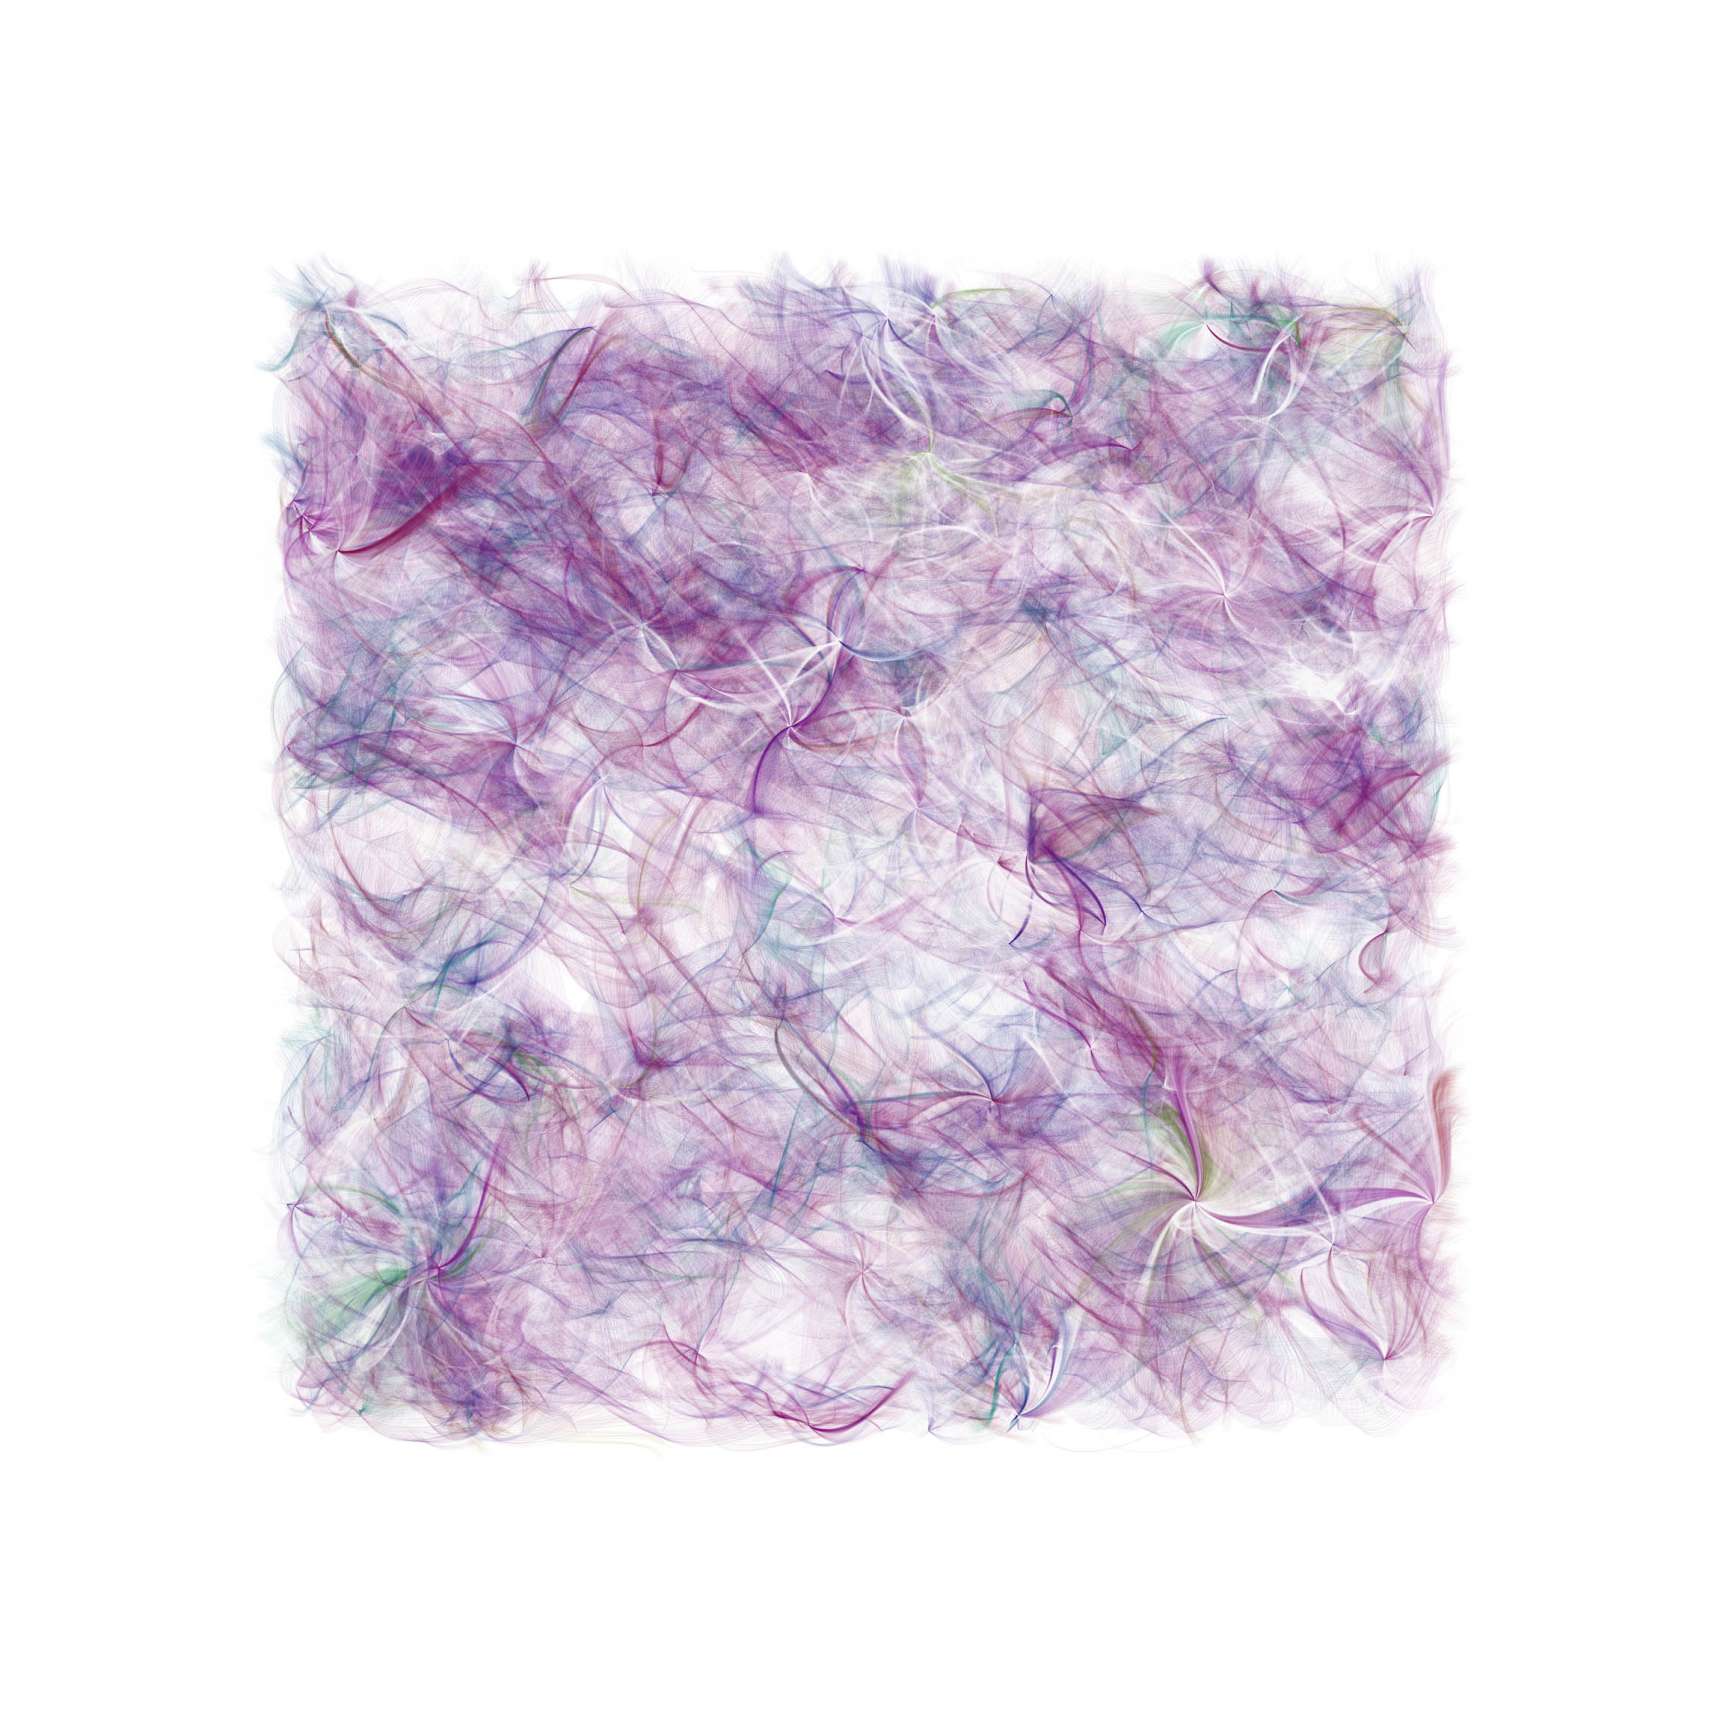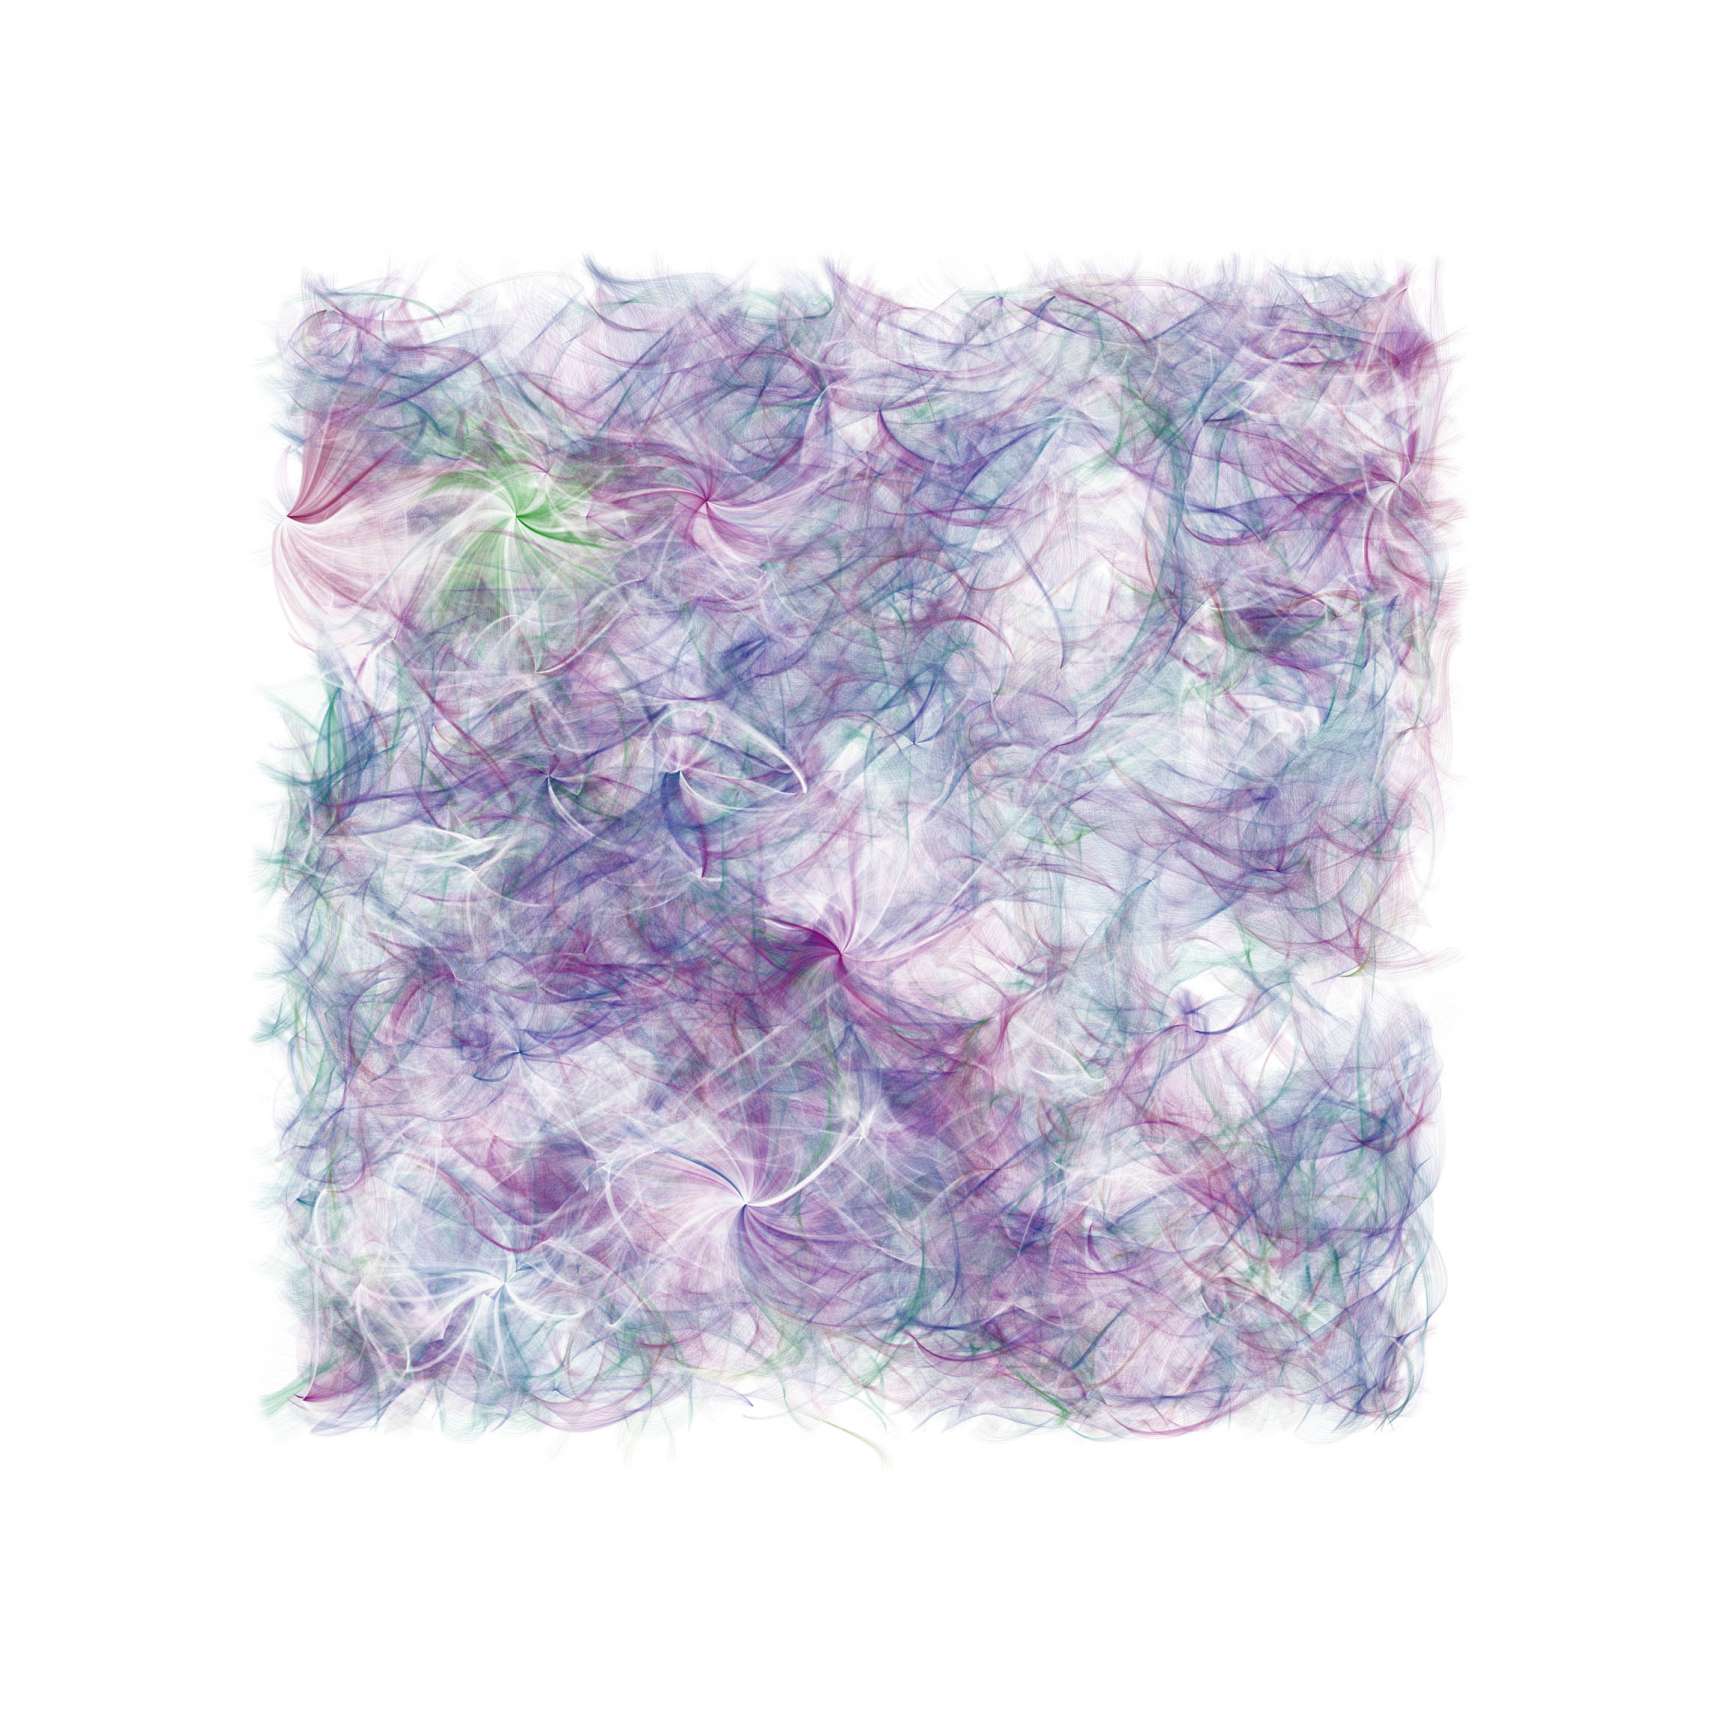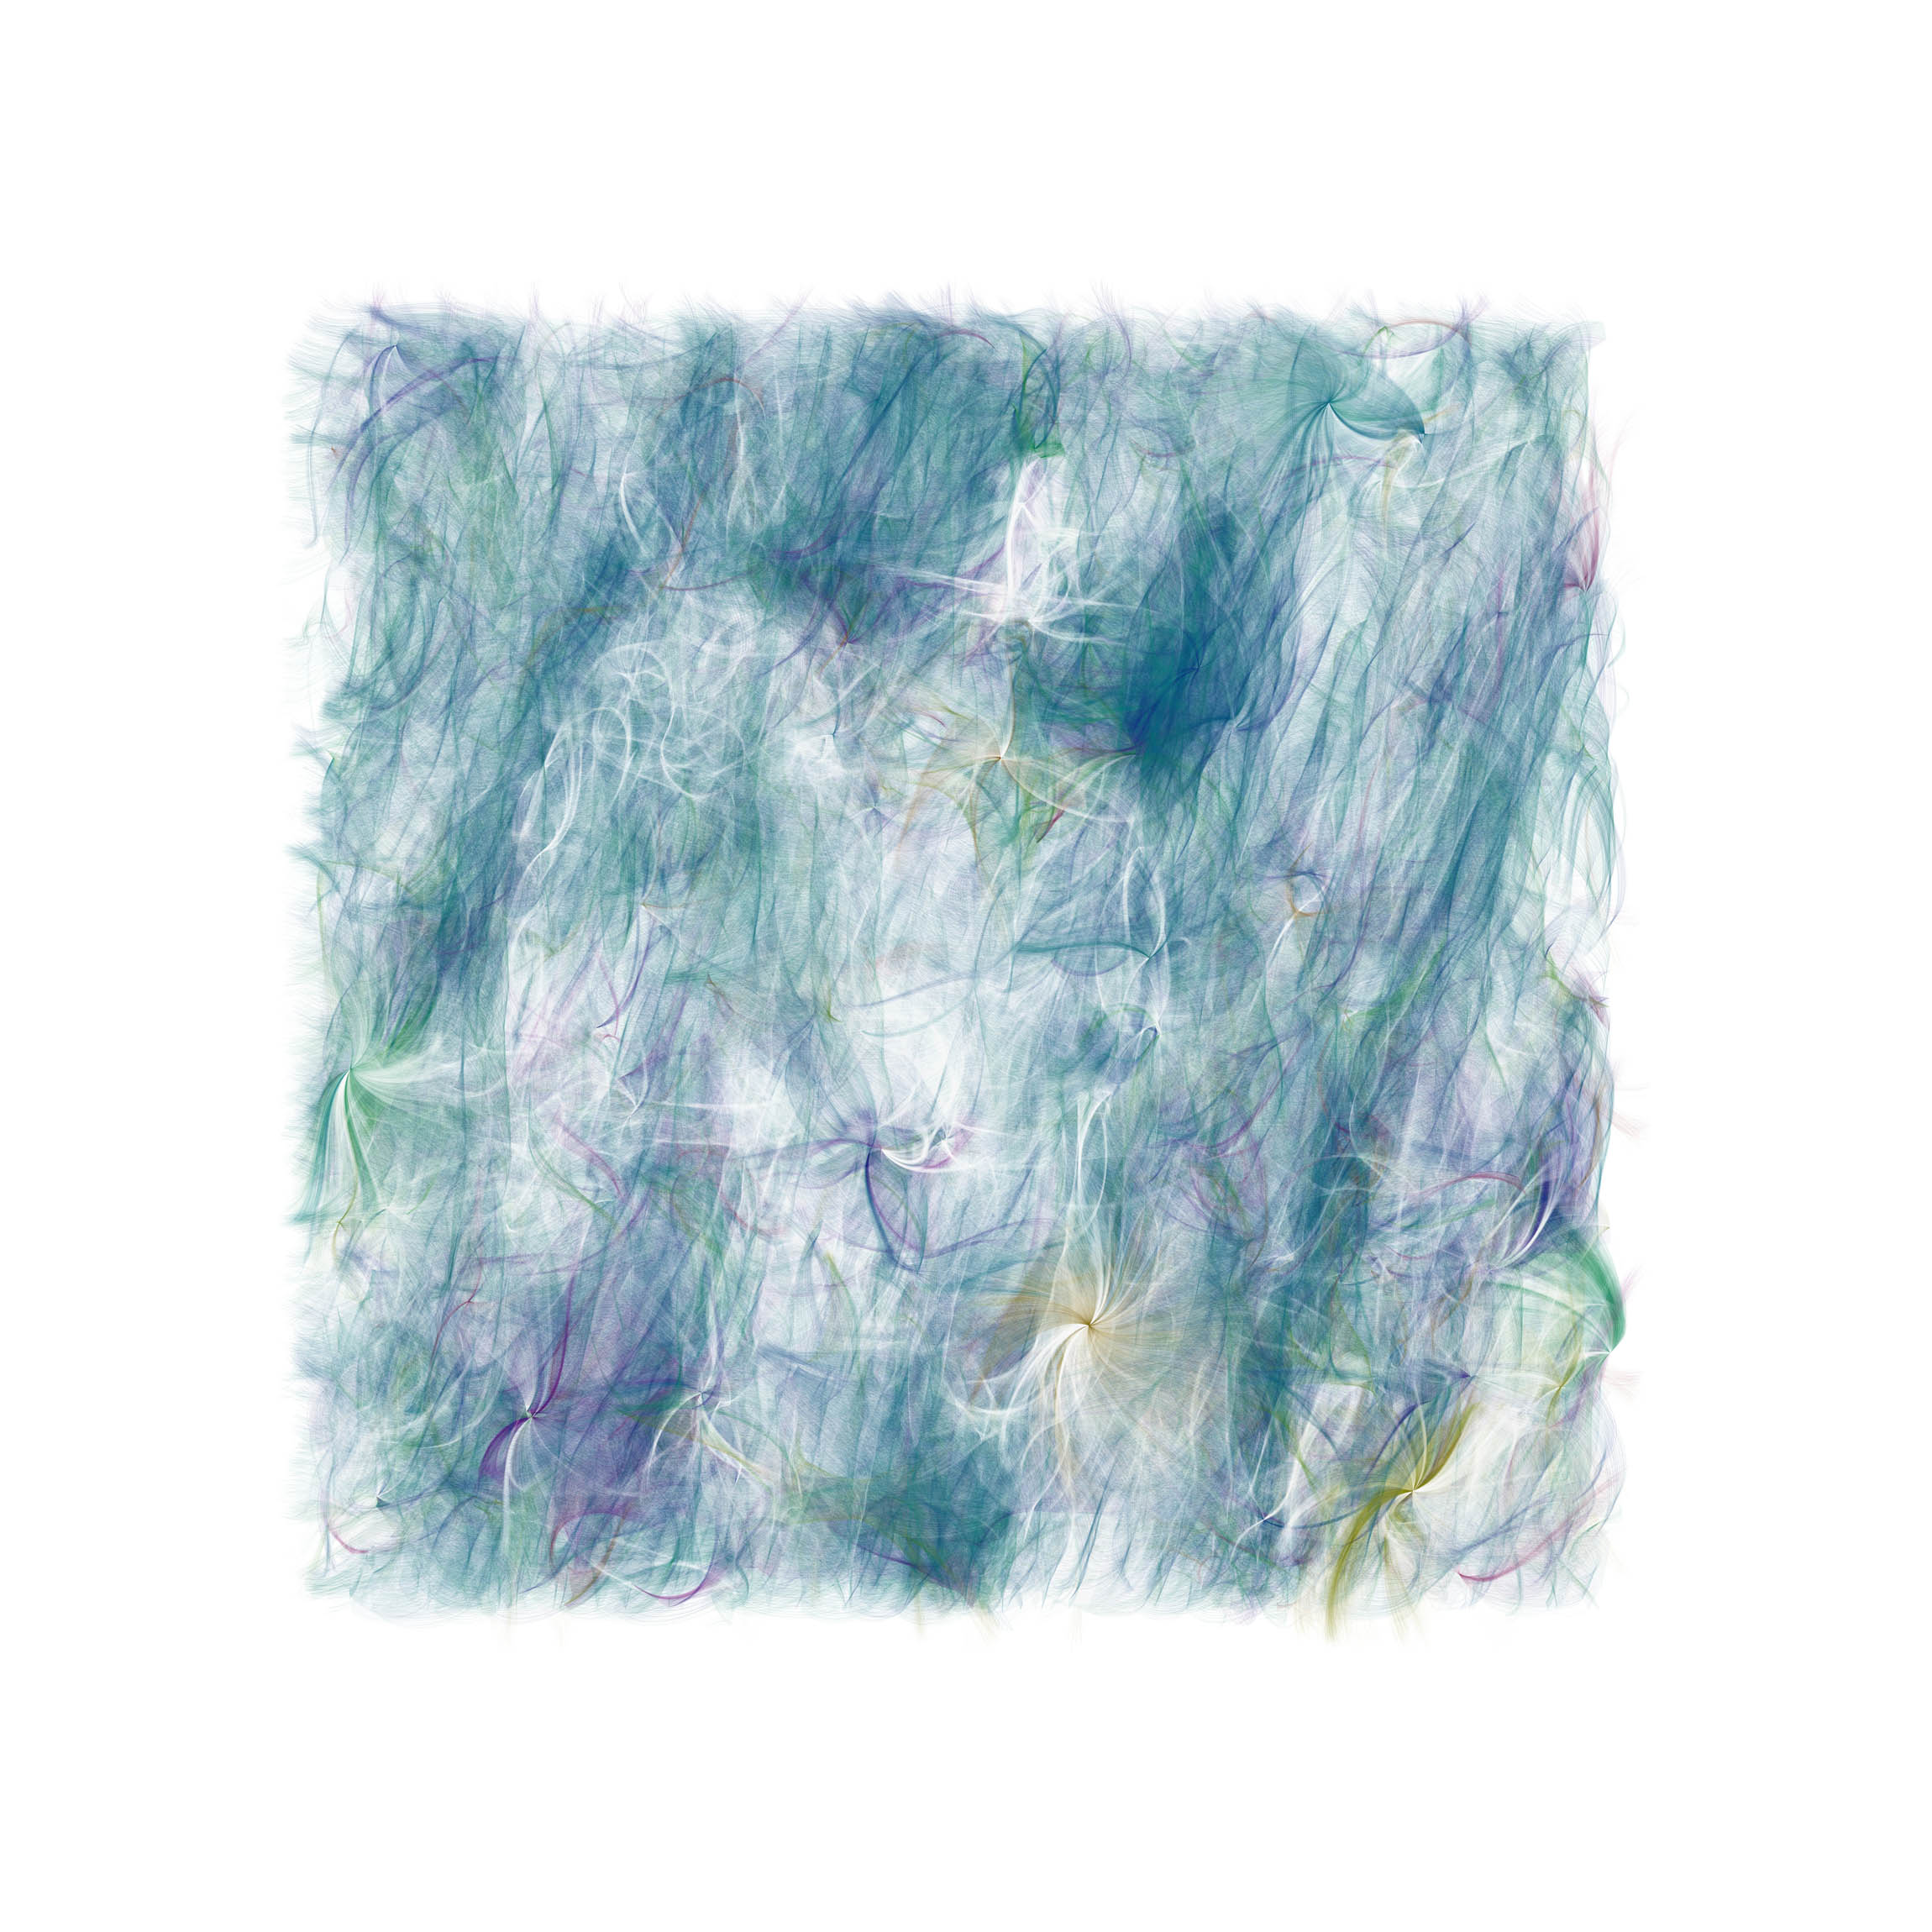
Winds.Process.2014.10
This process is a combination of Process.2014.09 and Air Current(s) 2.0. The drawing process starts with a 6x4 grid of twenty-four invisible circles. Each circle is assigned to an hour of a day’s wind data. Each hour of a day’s data is processed simultaneously and each invisible circle moves according to its hour’s data.
If the wind was blowing from the south during the first hour of the day, for example, the first circle moves up at rate corresponding to the wind speed. If the winds were from the east during the noon hour, the twelfth circle would move to the left. As the invisible circles move about the drawing space, their distance from each other is constantly being measured. If a circle overlaps with another, lines are drawn between them in colors keyed to wind direction. White is drawn instead if the data was collected during an even numbered minute. If a circle moves beyond the drawing space’s boundary, it reappears on the opposite side.
A drawing generated with data collected in Greensboro, NC in 2010 graced the cover of the Winter 2016 issue of Creative Nonfiction. Drawings generated with other processes also appeared in the magazine.