Winds.Process.2014.07
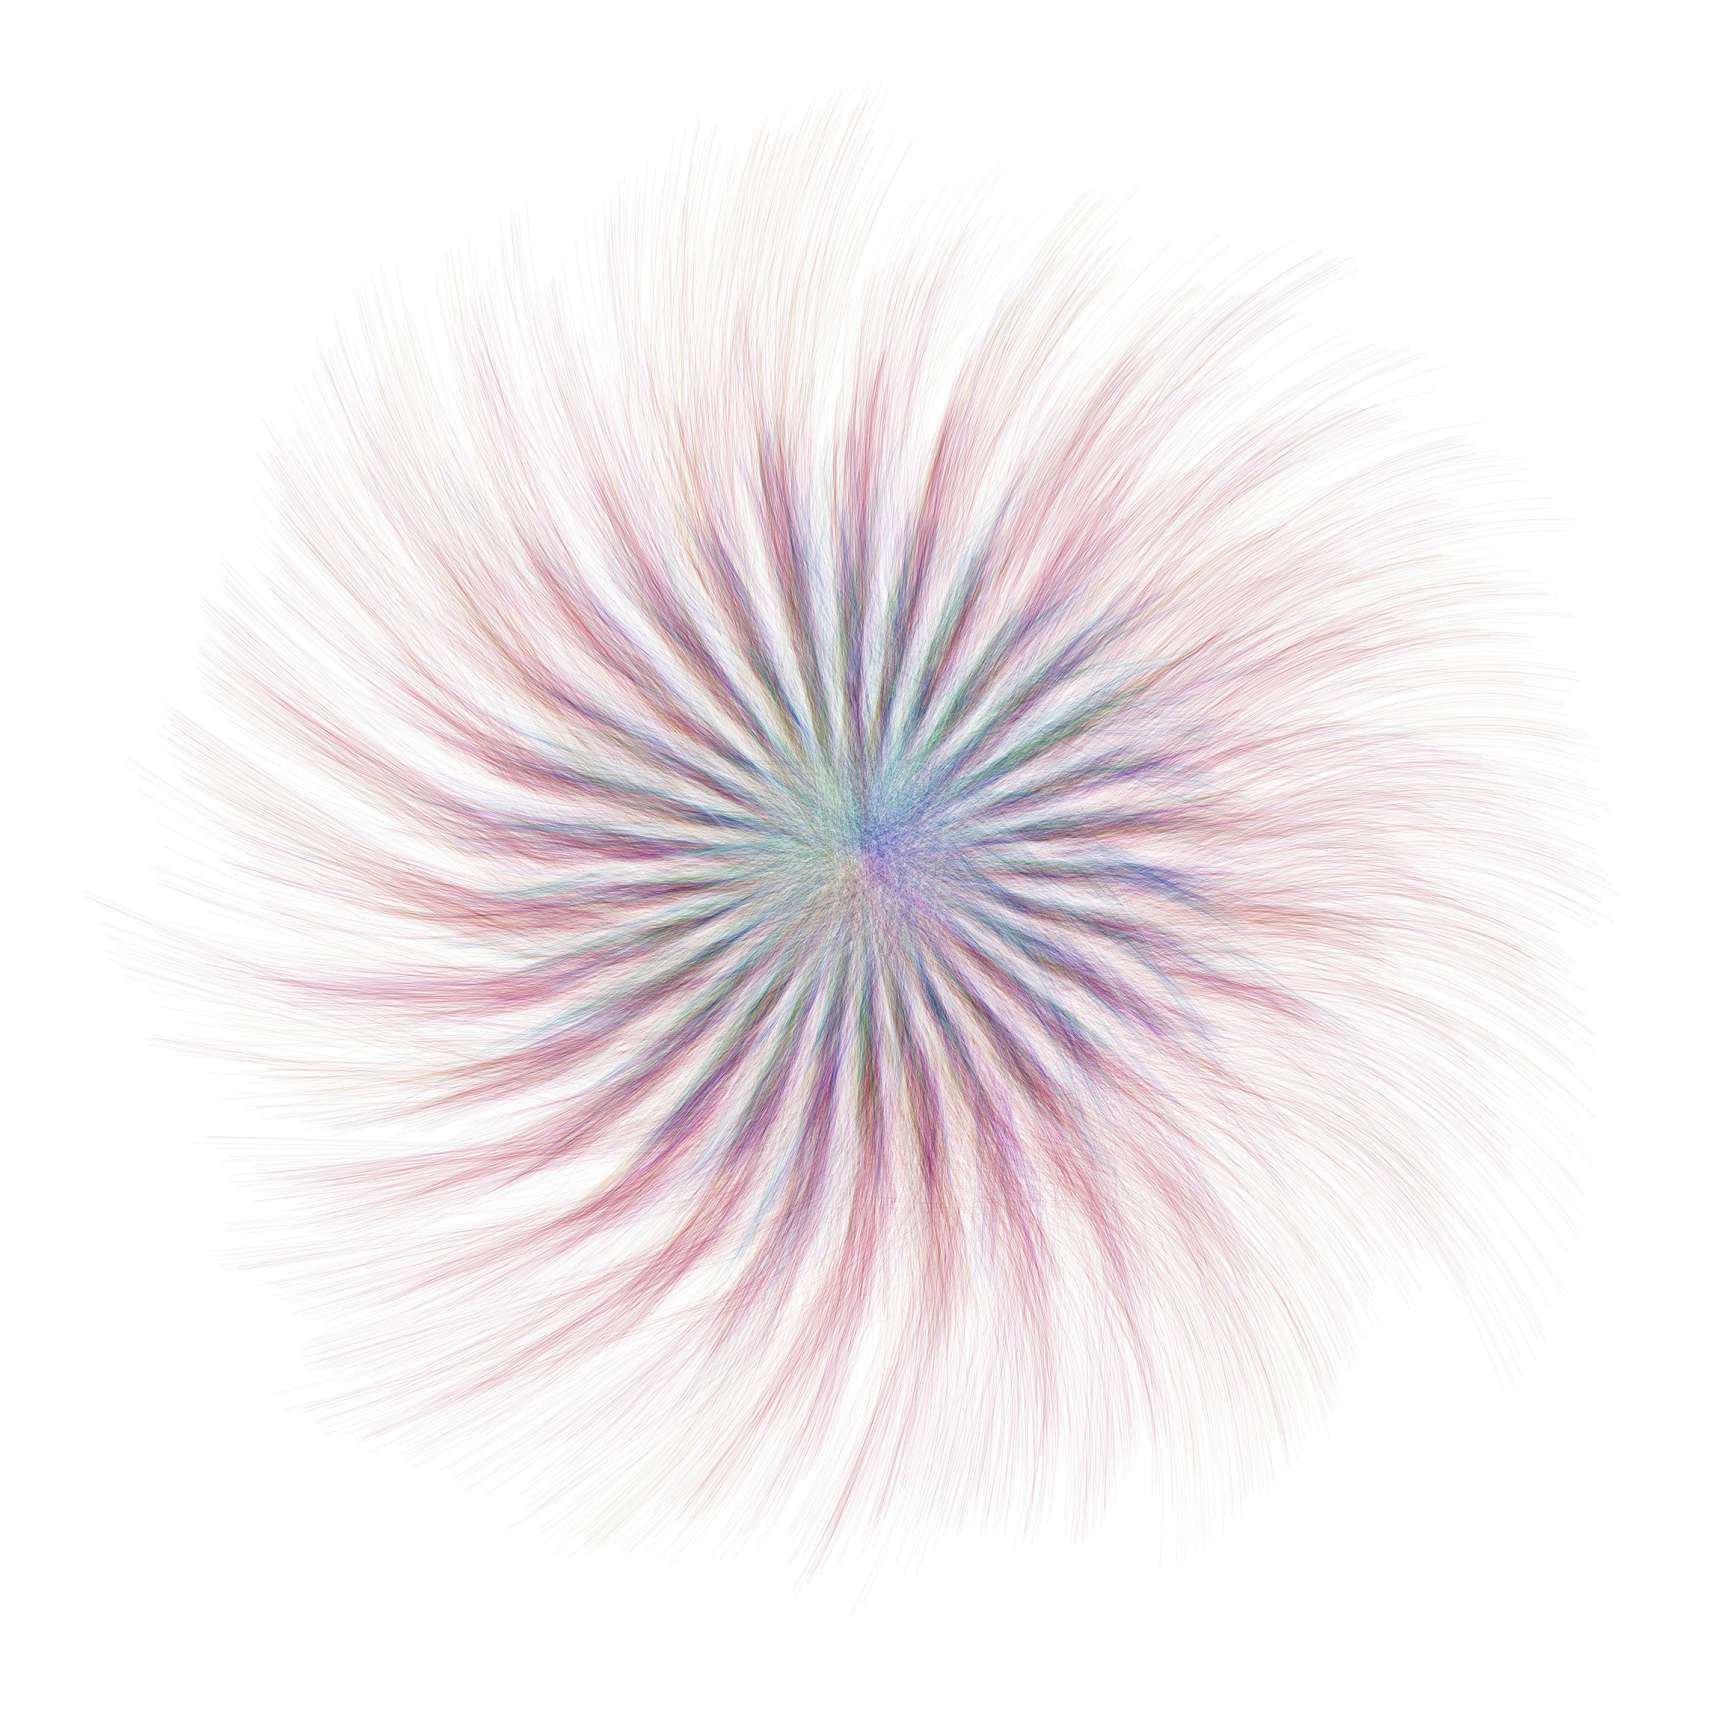
This process combines the organizing principles of a clock and a compass. Like Process.2013.03, these drawings use concentric rings around the center for each hour of a day’s data. The first hour of the day is on the outer edge. Each line is an interpretation of one second of data.
The drawing process starts at the twelve o’clock position of the outermost ring and rotates clockwise. A point of origin on the ring is determined for each second of an hour. From that point, the starting point for a line is determined based on wind speed and direction. The end point of that line is a point around the center based on wind speed and direction. If the wind is blowing during that second, the line curves at a degree in proportion to wind speed. Color is keyed to wind direction, but if a line’s data was collected during an even minute, a white line is drawn instead.