Winds.Process.2014.05
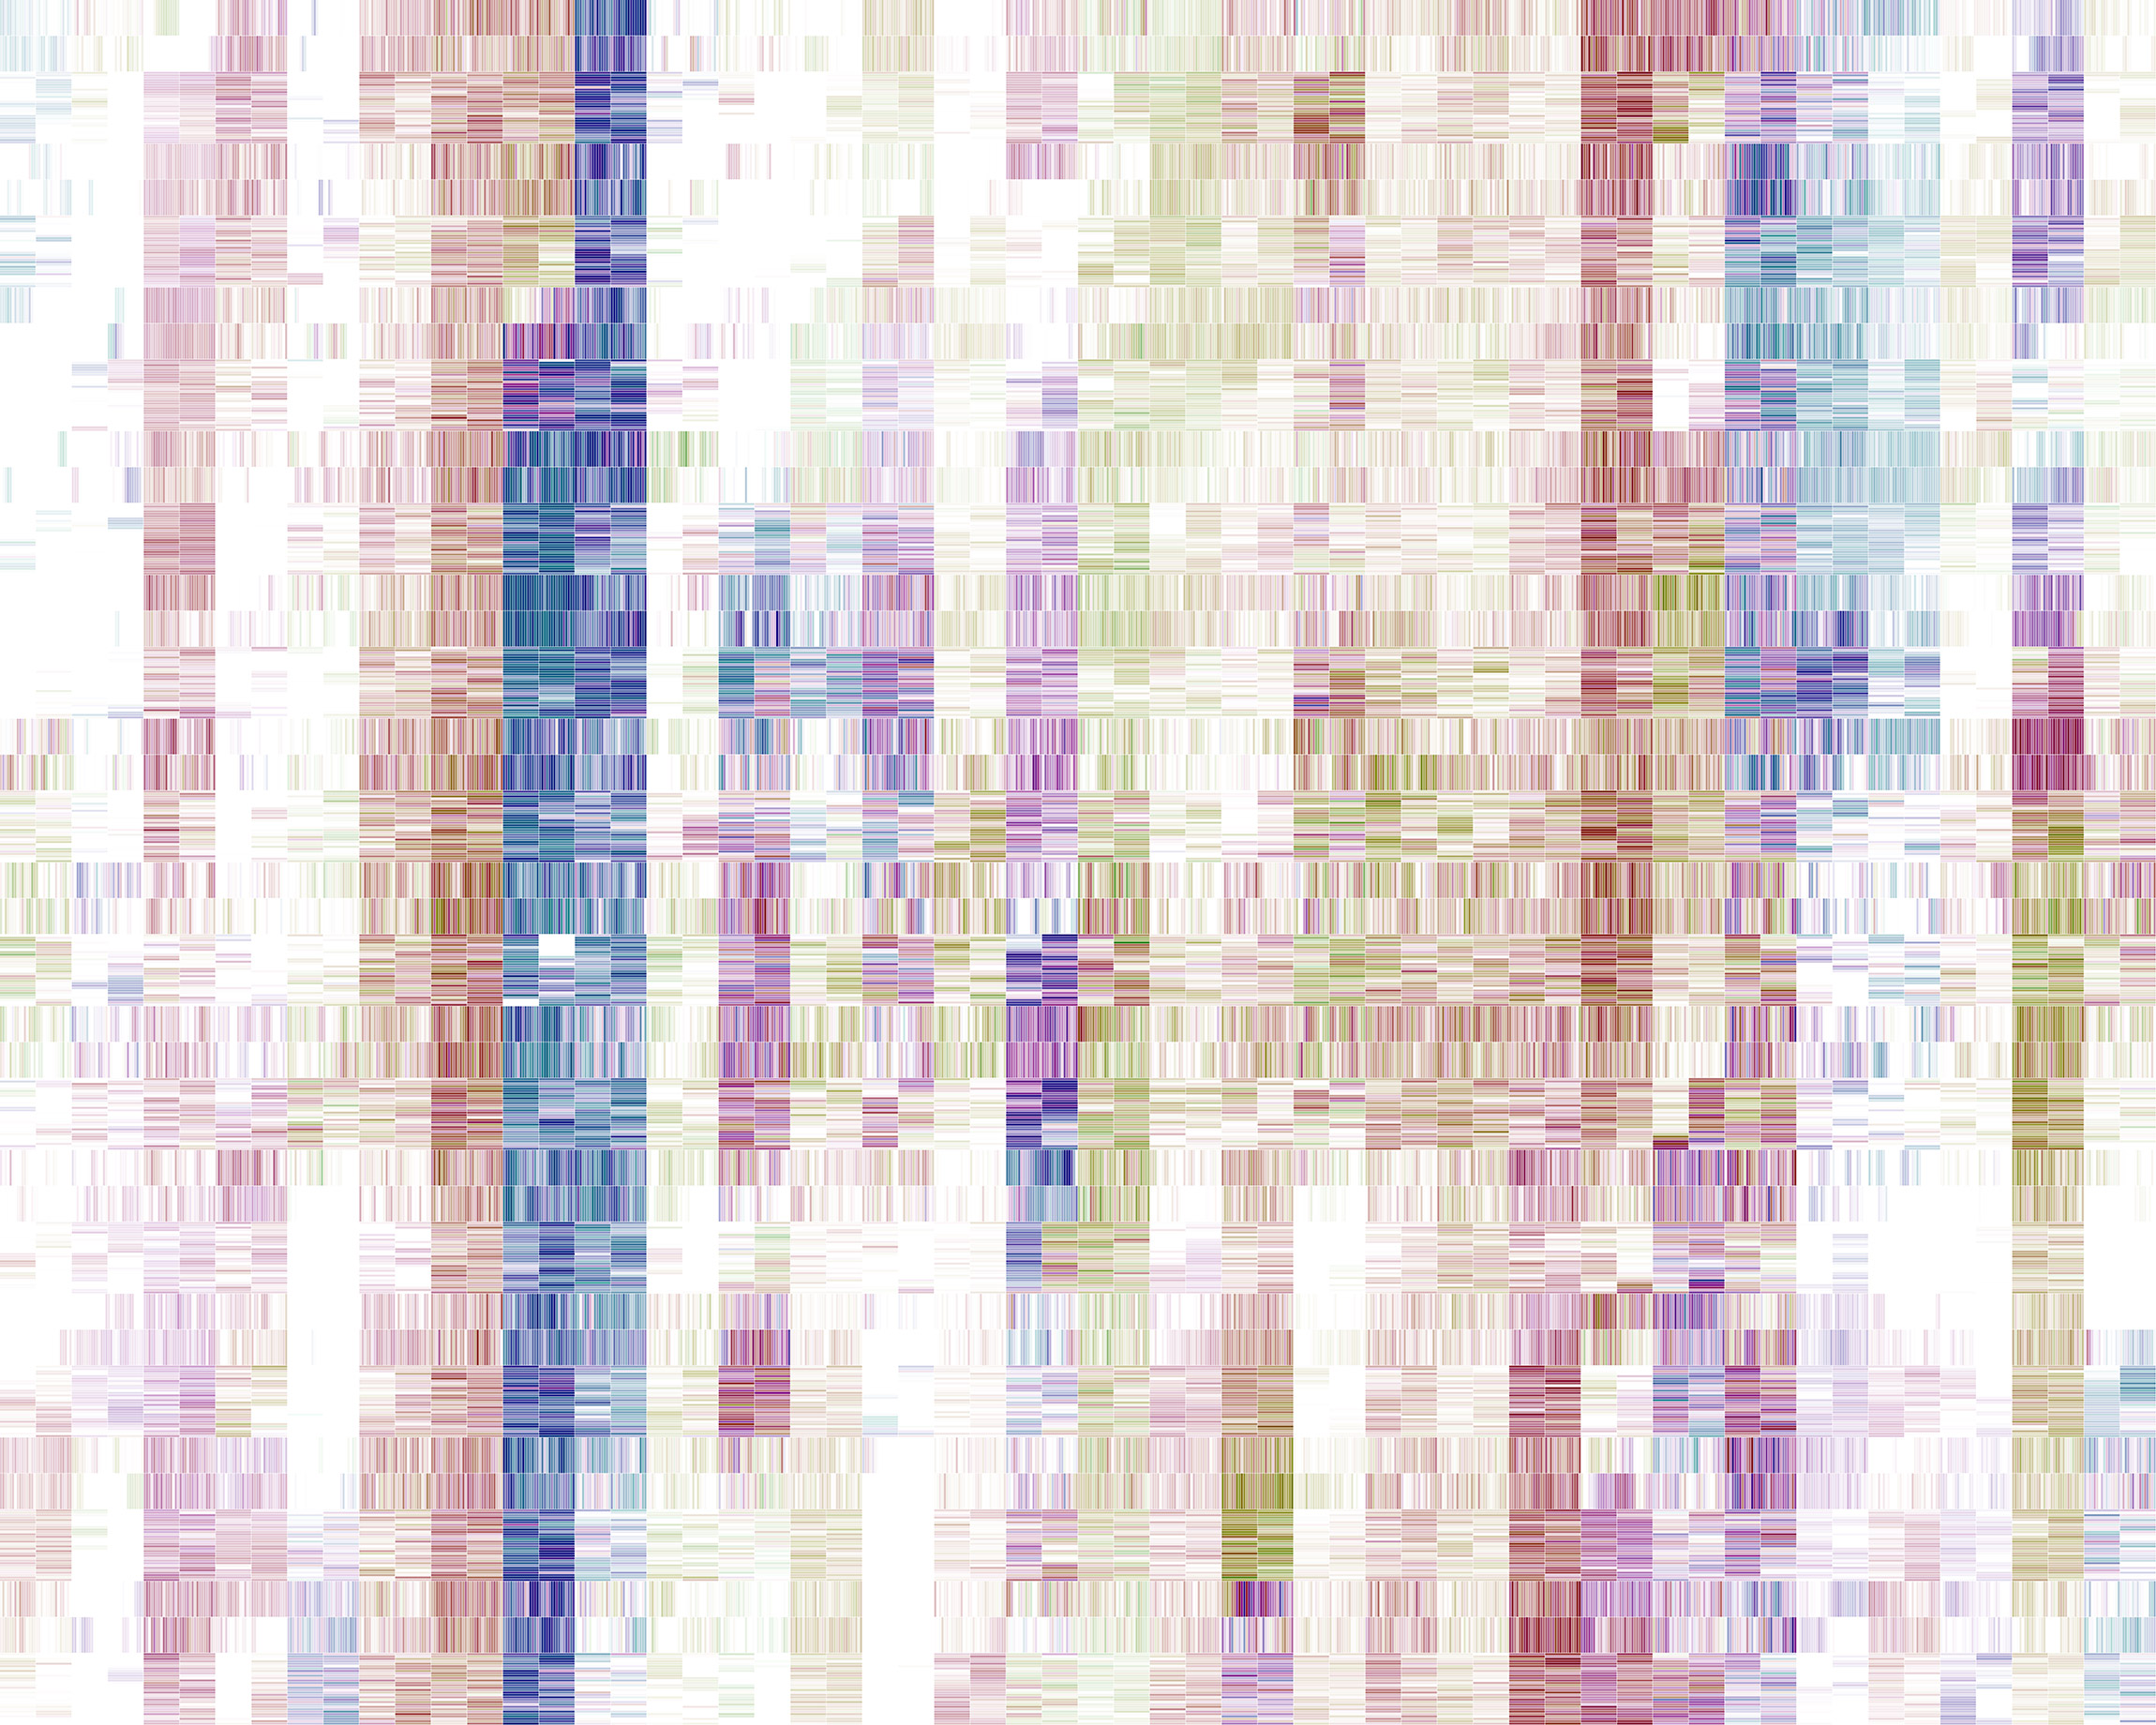
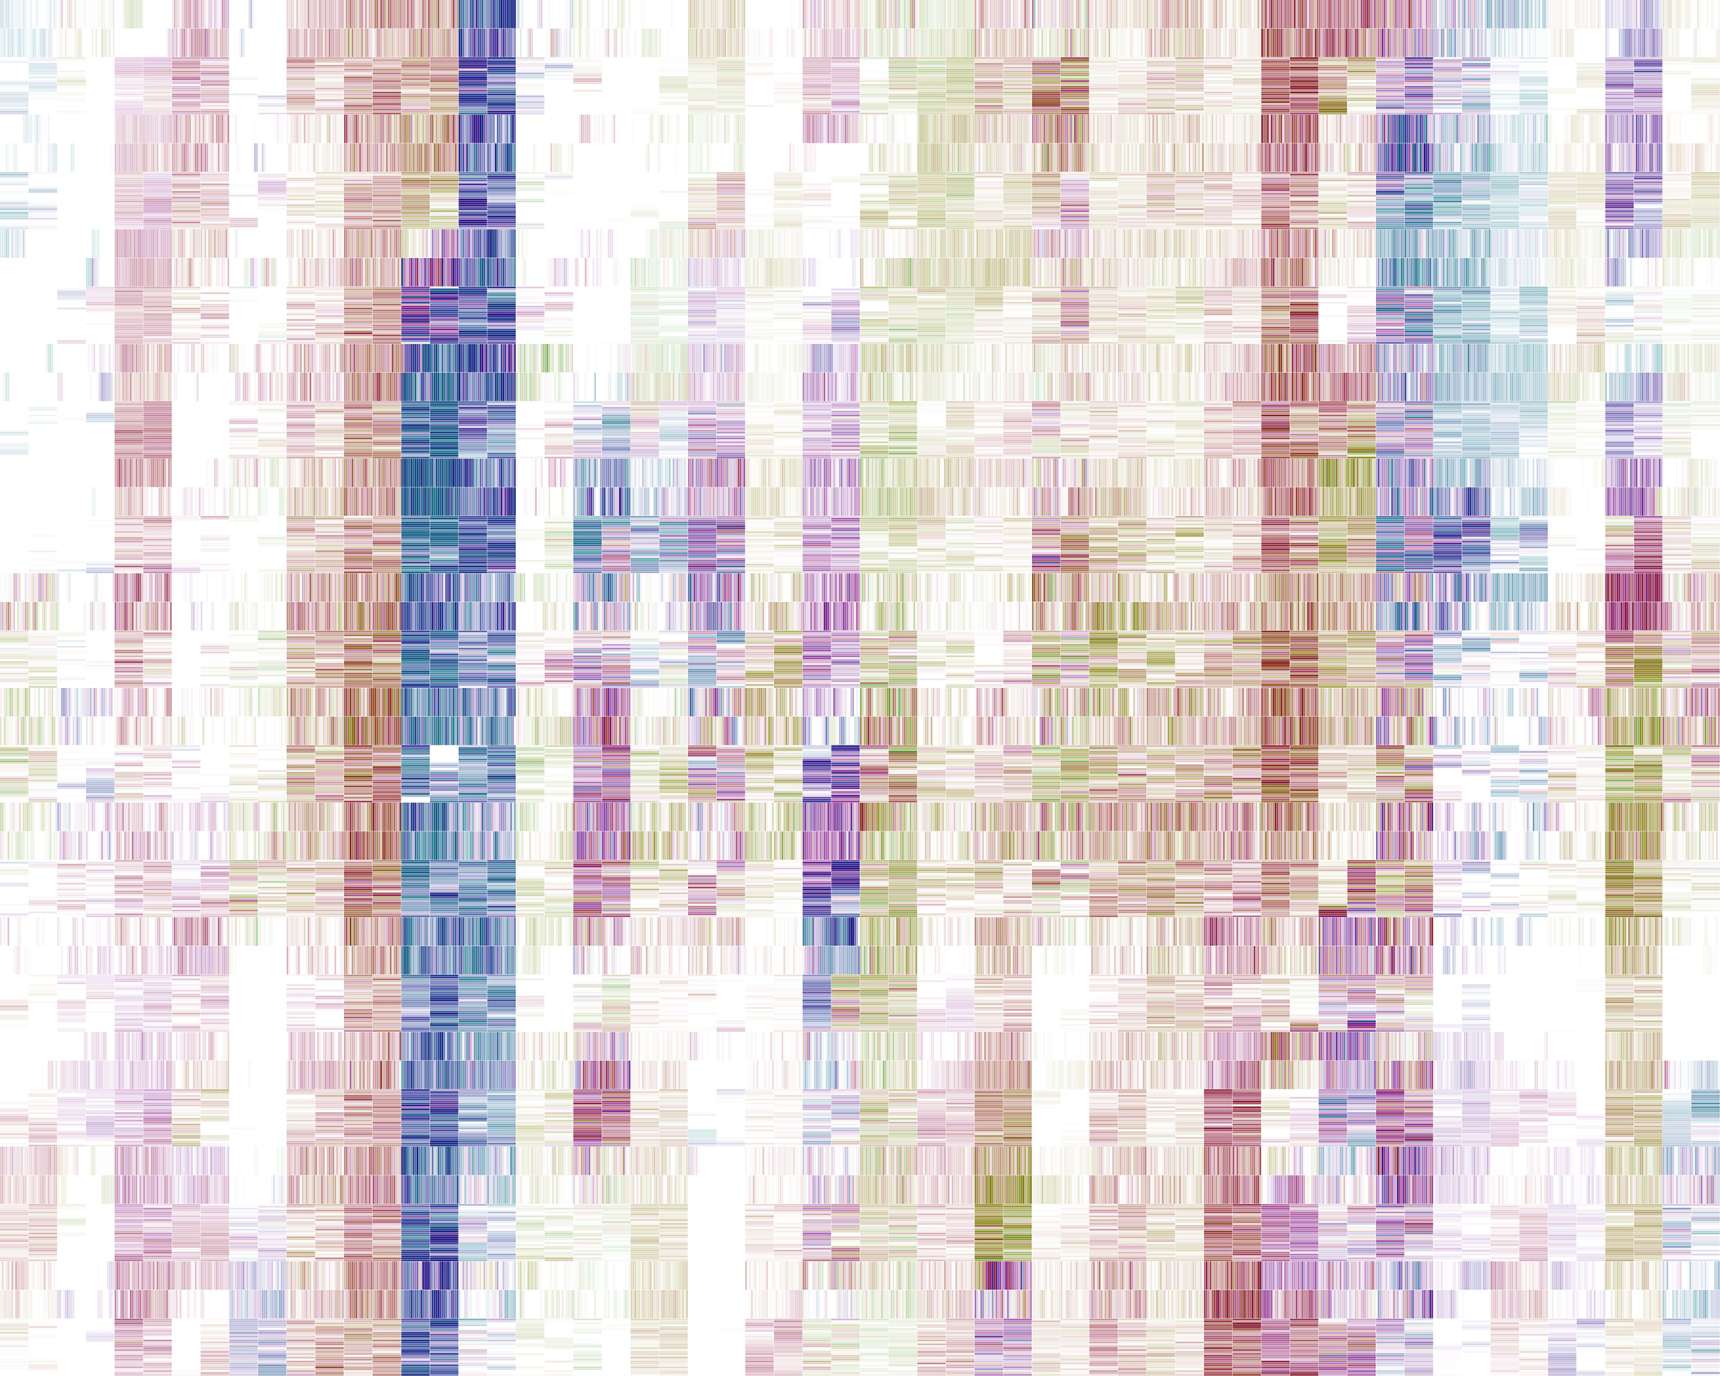
This process is a simplified version of Process.2014.04. Each drawing is generated with wind data collected over a month at one location. The columns in each drawing show conditions for one day and each one is divided into twenty-four squares. In each of these squares, sixty stripes show average wind conditions over one of the hour’s sixty minutes. Color is keyed to wind direction and density to wind speed.
![Winds / December 2013 / Cary, North Carolina / Process.2014.05 [ Detail ]](http://www.marknystrom.com/devmns/sites/default/files/styles/drimage_1720_0/public/2023-03/process_2014_05-cary-composite-december-2013-b-flat-hue-30-detail1.jpg?itok=Wu3QUFl4)
![Winds / December 2013 / Cary, North Carolina / Process.2014.05 [ Detail ]](http://www.marknystrom.com/devmns/sites/default/files/styles/drimage_1720_0/public/2023-03/process_2014_05-cary-composite-december-2013-b-flat-hue-30-detail3.jpg?itok=gnUyj-VS)