Winds.Process.2014.02
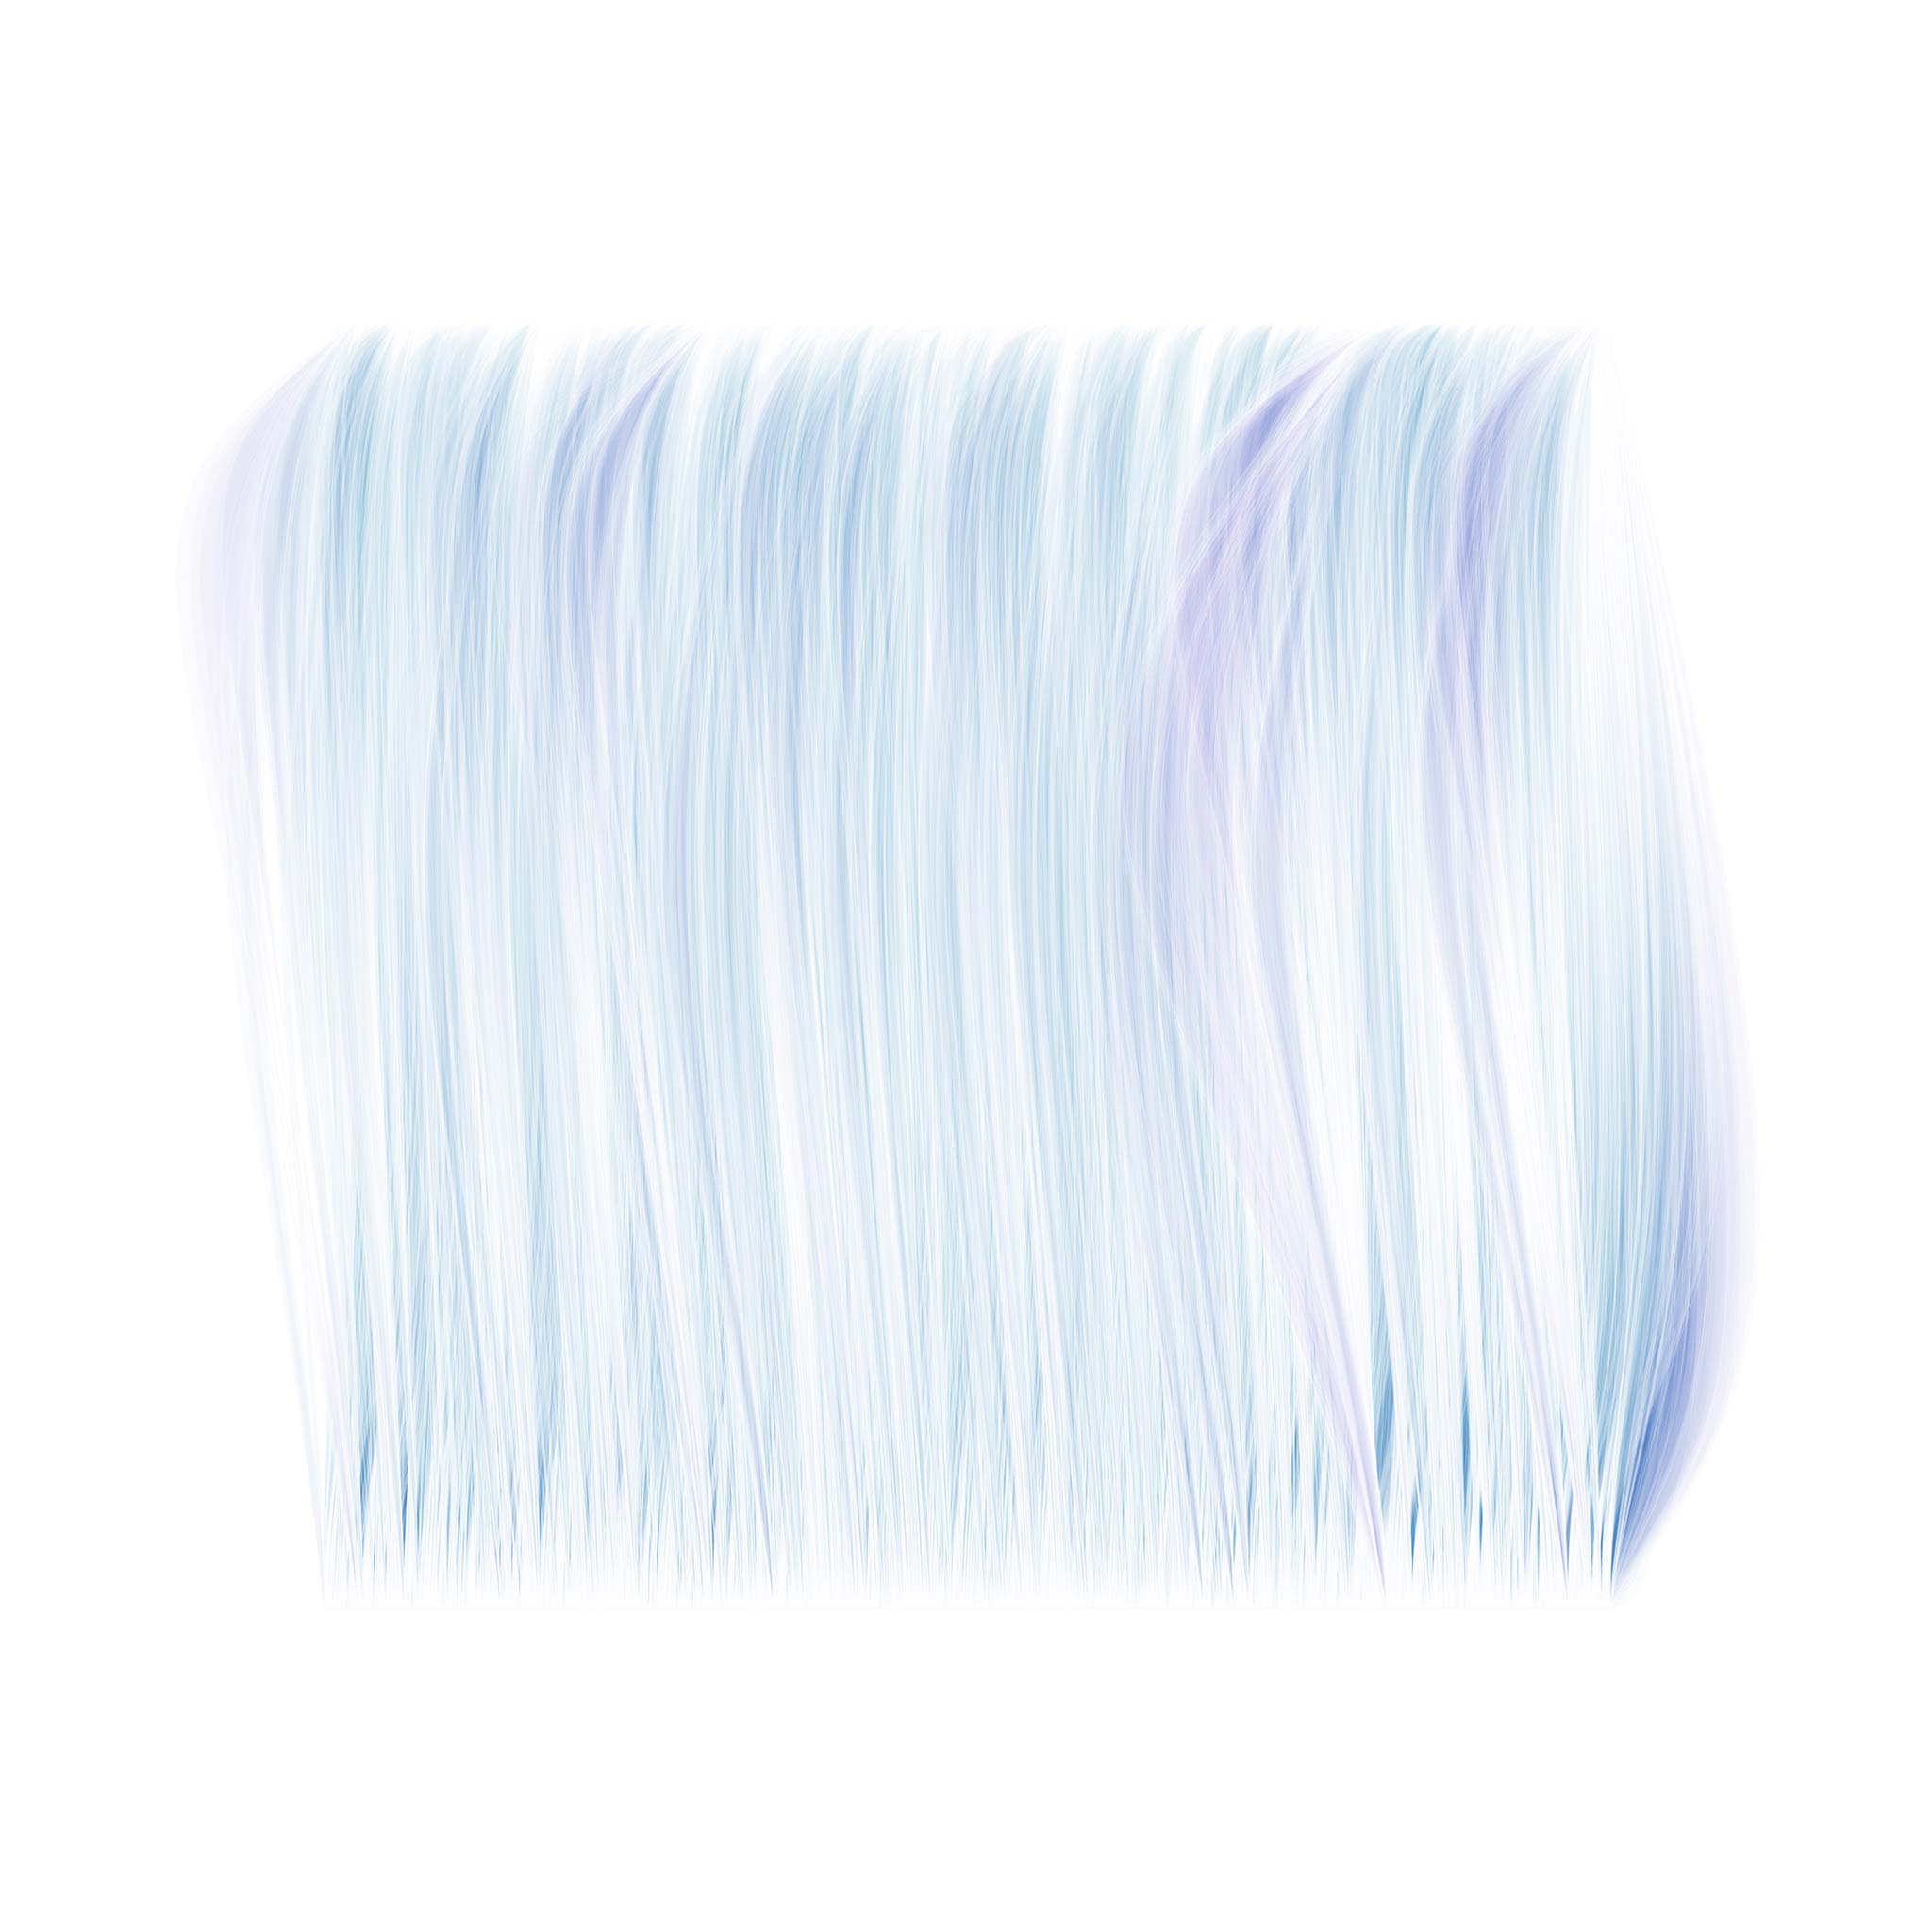
Using weather data found on the internet, this process generates a drawing that shows wind conditions at one location for an entire year. Each drawing can be read like a timeline from top to bottom. Wind speed influences the size and color of the curve. Low wind speeds draw a relatively straight, horizontal line while higher speeds add a curve. Wind direction influences the vertical location of the curve. Winds from the north make curves near the left while winds from the east add curves between the left and middle. Southerly winds curve in the middle and westerly ones curve between the middle and right.