
Winds.Process.2014.01
This process allows for a direct comparison of wind conditions on different days. The drawing uses a 360 x 240 grid with each cell used to show an interpretation of one second’s data. Data from several days is processed with each day a different color and layer. As the data is processed for each cell, if the wind was blowing during that second, a series of lines are drawn with their rotation relating to wind direction. The progression of thickness of these lines is oriented to the direction of the wind. Faster wind speeds increase the density of the lines.
Each drawing shows four days of wind conditions. Day 1 is in blue, Day 2 in green, Day 3 in Orange and Day 4 in yellow.


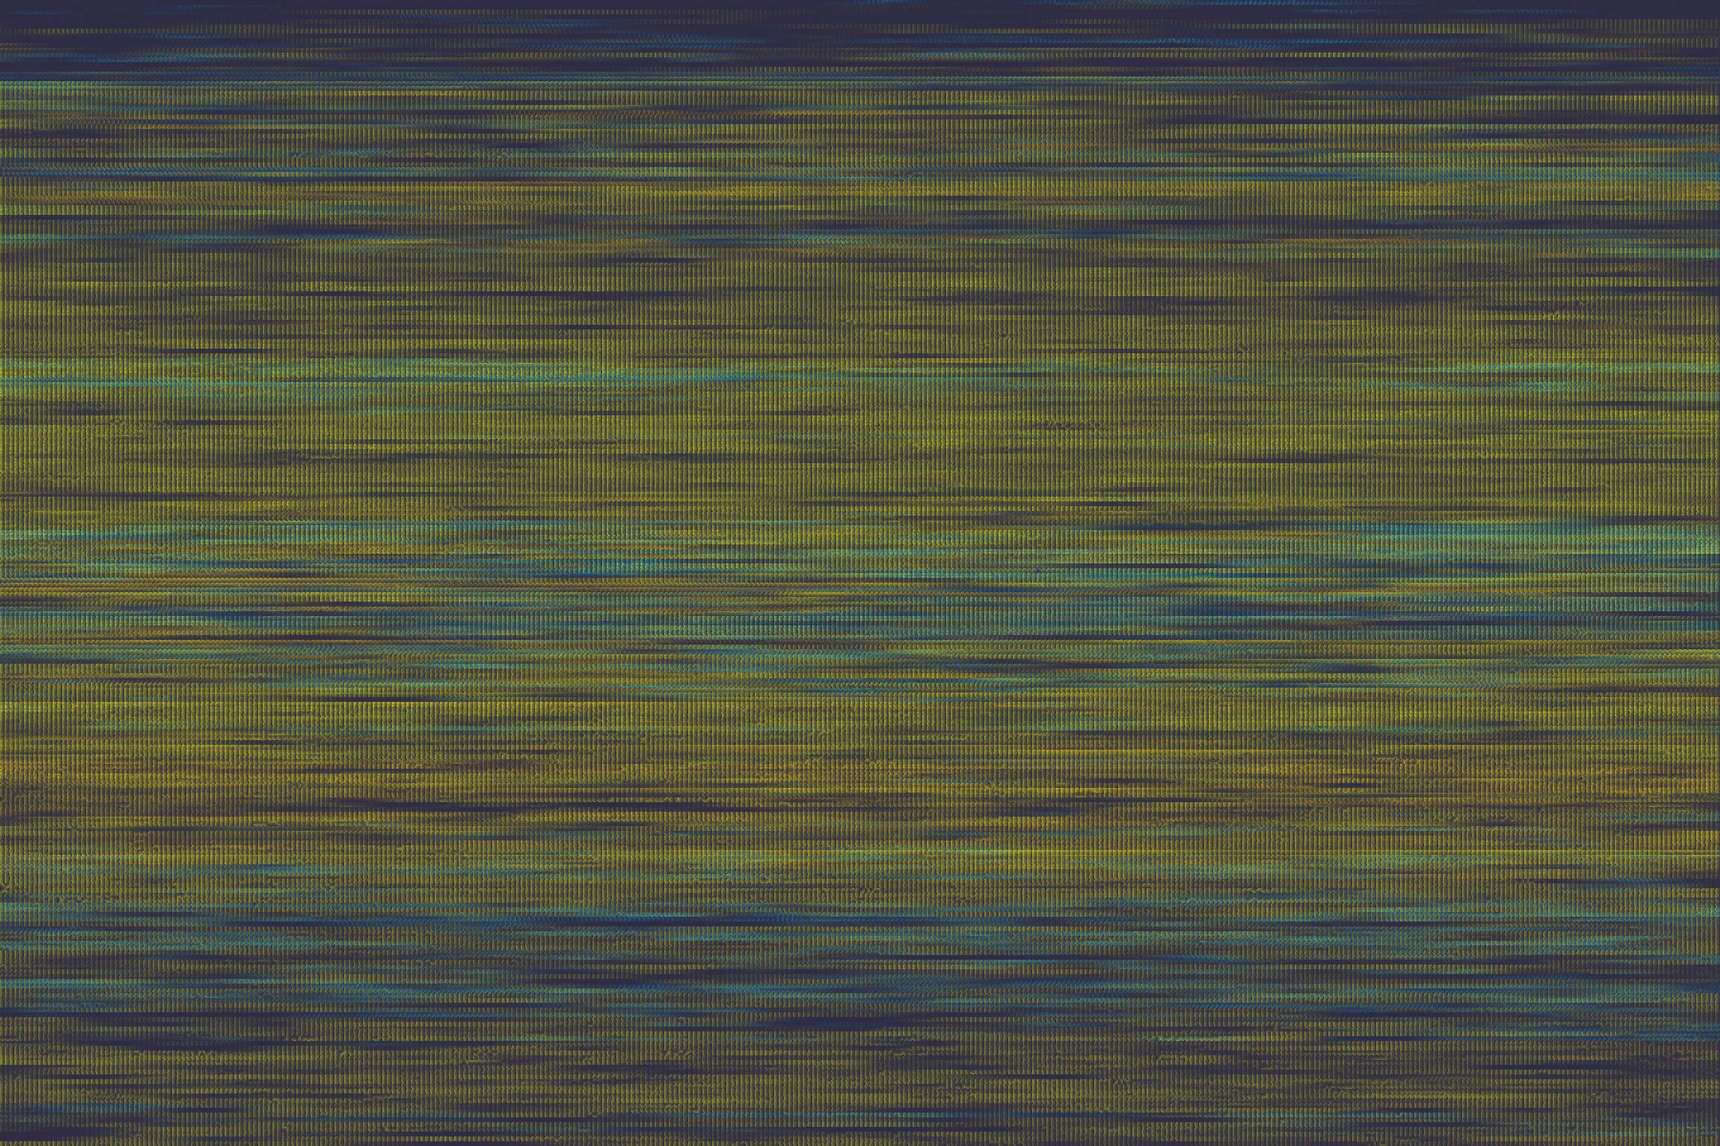
![Winds / March 1–4, 2014 / Boone, North Carolina / Process.2014.01 [ Detail ]](http://www.marknystrom.com/devmns/sites/default/files/styles/drimage_1720_0/public/2023-03/process_2014_01-march1-4-detail1.jpg?itok=lEqDZViJ)
![Winds / March 1–4, 2014 / Boone, North Carolina / Process.2014.01 [ Detail ]](http://www.marknystrom.com/devmns/sites/default/files/styles/drimage_1720_0/public/2023-03/process_2014_01-march1-4-detail2.jpg?itok=AXgzitg4)
![Winds / March 2–5, 2014 / Boone, North Carolina / Process.2014.01 [ Detail ]](http://www.marknystrom.com/devmns/sites/default/files/styles/drimage_1720_0/public/2023-03/process_2014_01-march2-5-detail1.jpg?itok=QszvnVLe)
![Winds / March 2–5, 2014 / Boone, North Carolina / Process.2014.01 [ Detail ]](http://www.marknystrom.com/devmns/sites/default/files/styles/drimage_1720_0/public/2023-03/process_2014_01-march2-5-detail2.jpg?itok=jrdNatKV)
![Winds / March 3–6, 2014 / Boone, North Carolina / Process.2014.01 [ Detail ]](http://www.marknystrom.com/devmns/sites/default/files/styles/drimage_1720_0/public/2023-03/process_2014_01-march3-6-detail1.jpg?itok=r6nkAxgC)
![Winds / March 3–6, 2014 / Boone, North Carolina / Process.2014.01 [ Detail ]](http://www.marknystrom.com/devmns/sites/default/files/styles/drimage_1720_0/public/2023-03/process_2014_01-march3-6-detail2.jpg?itok=jfyO0yB4)