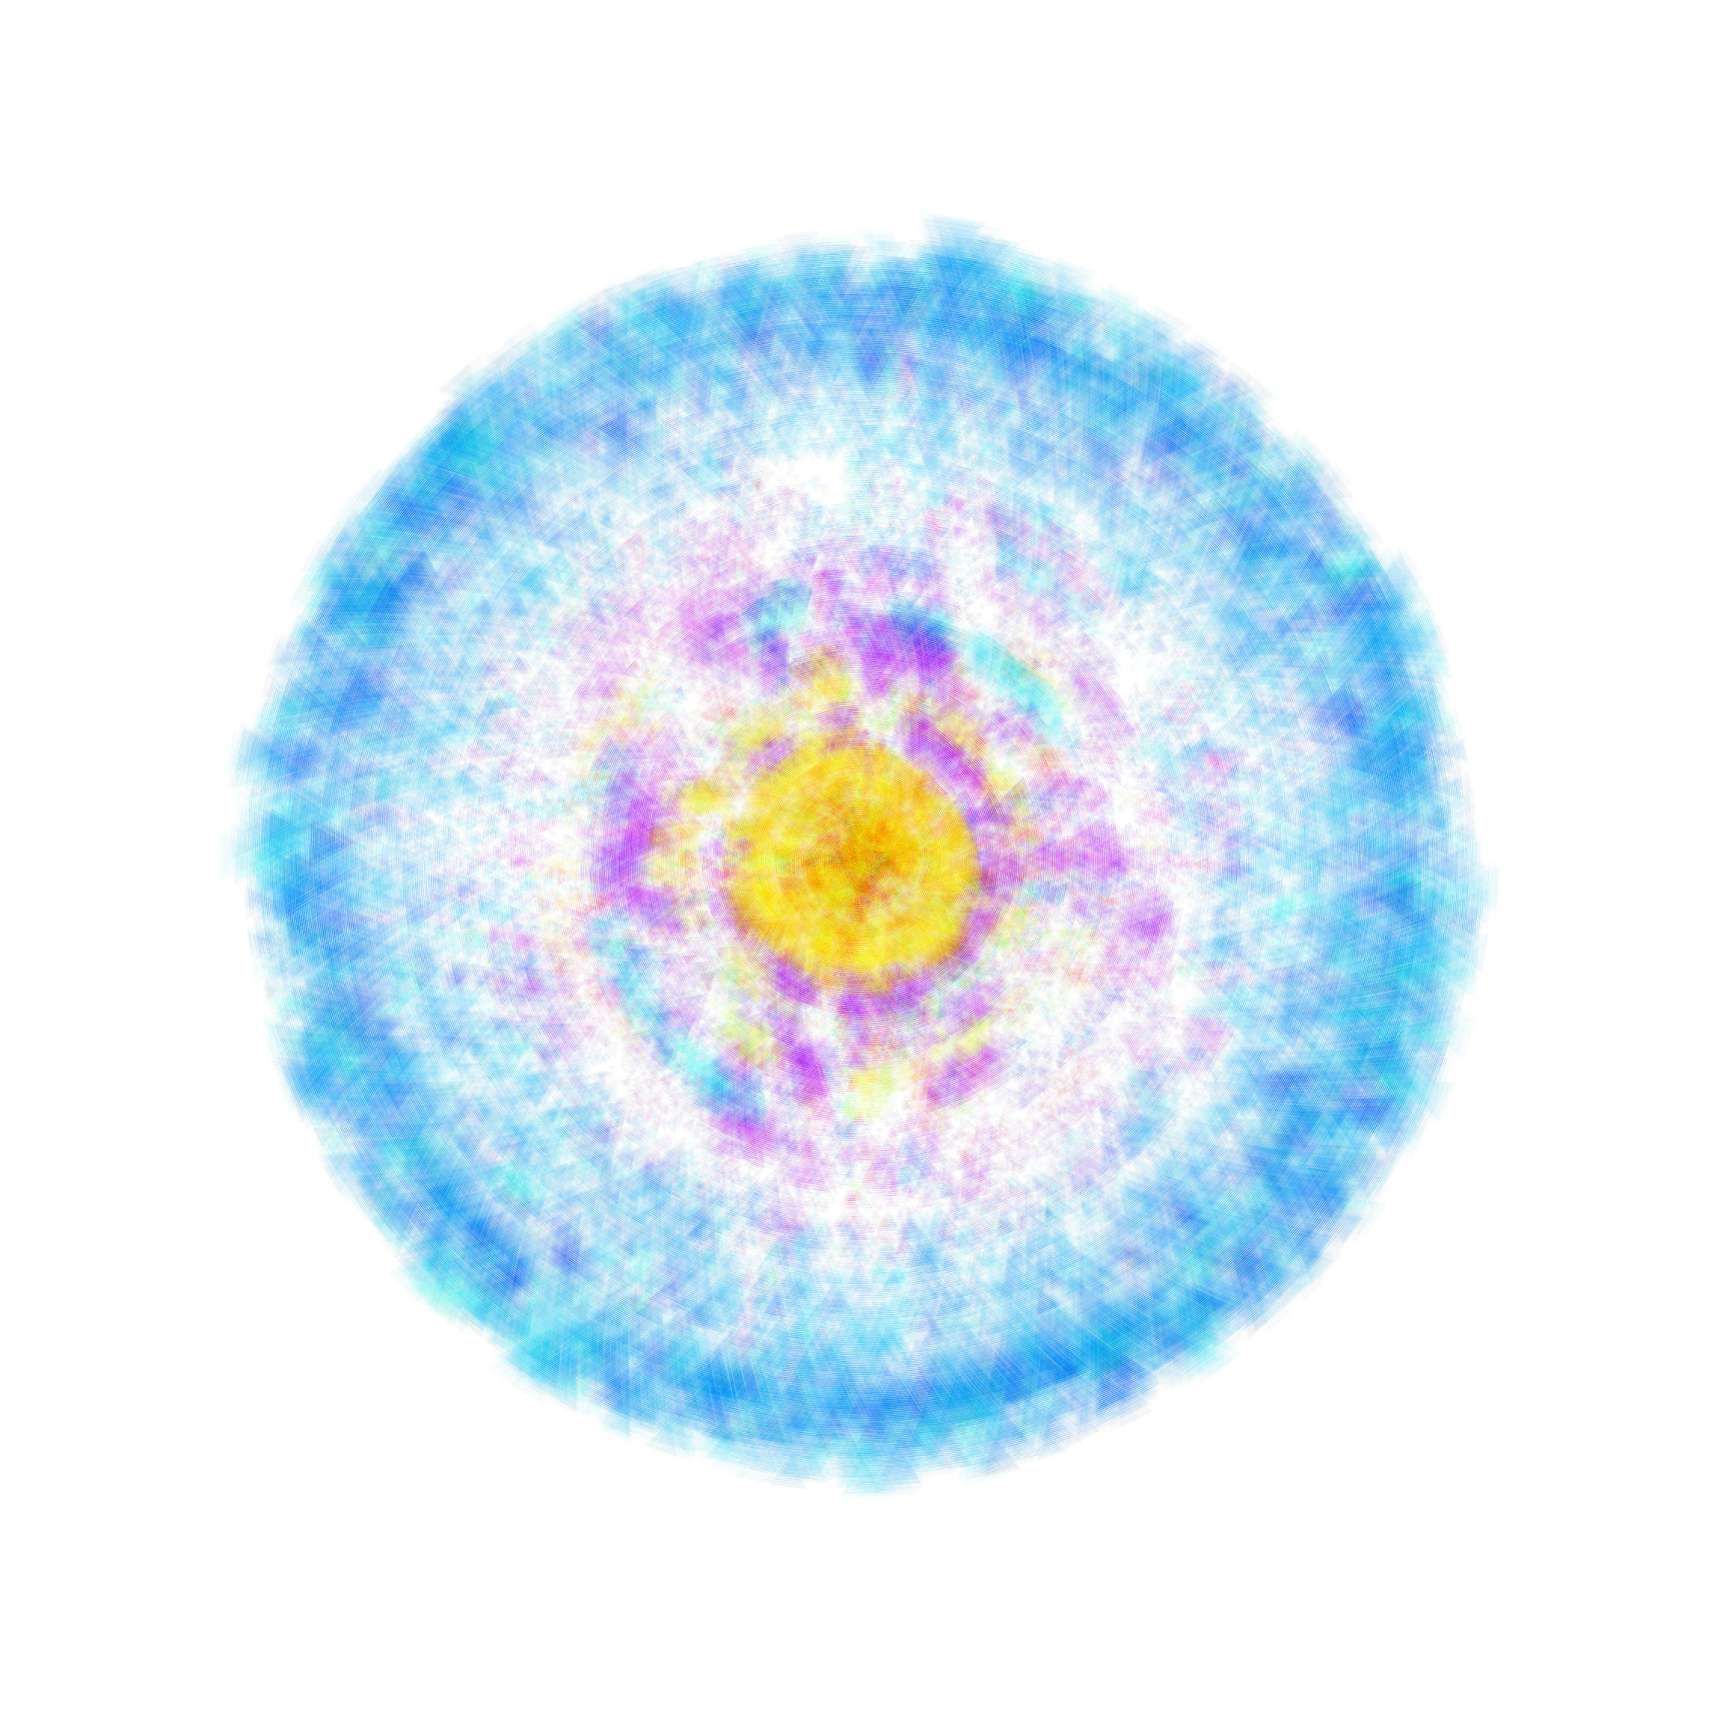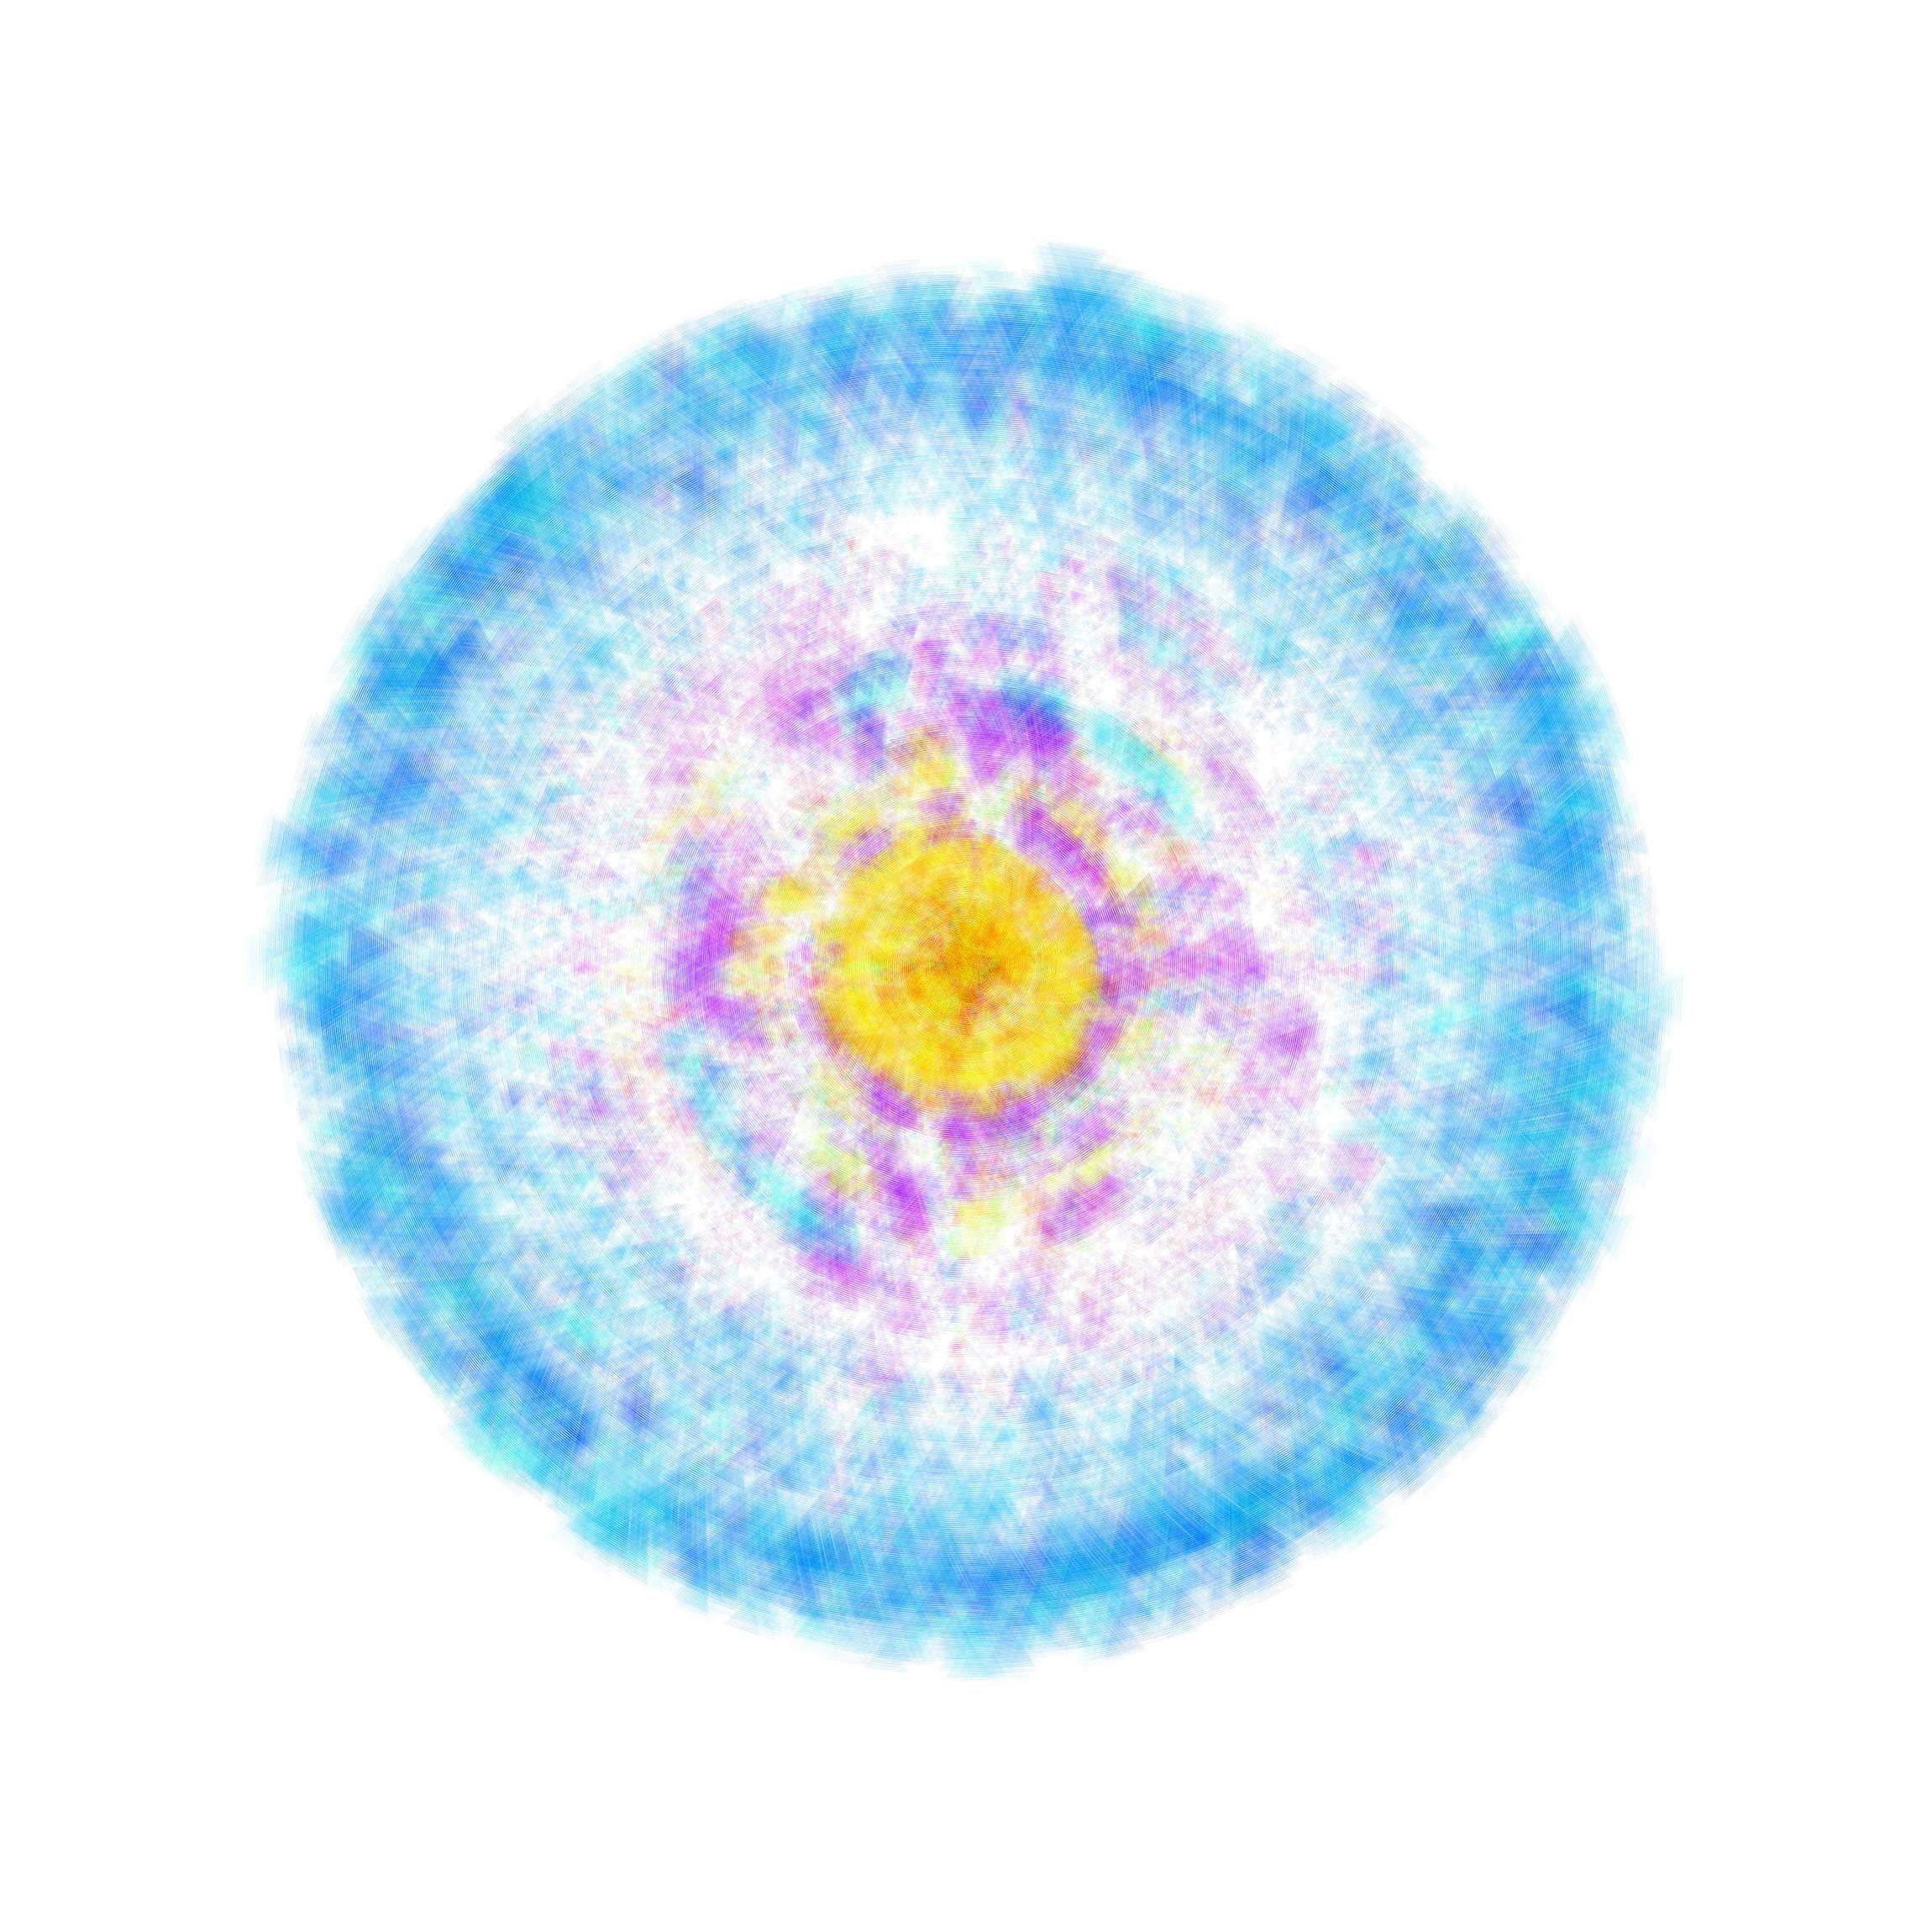
Winds.Process.2013.02
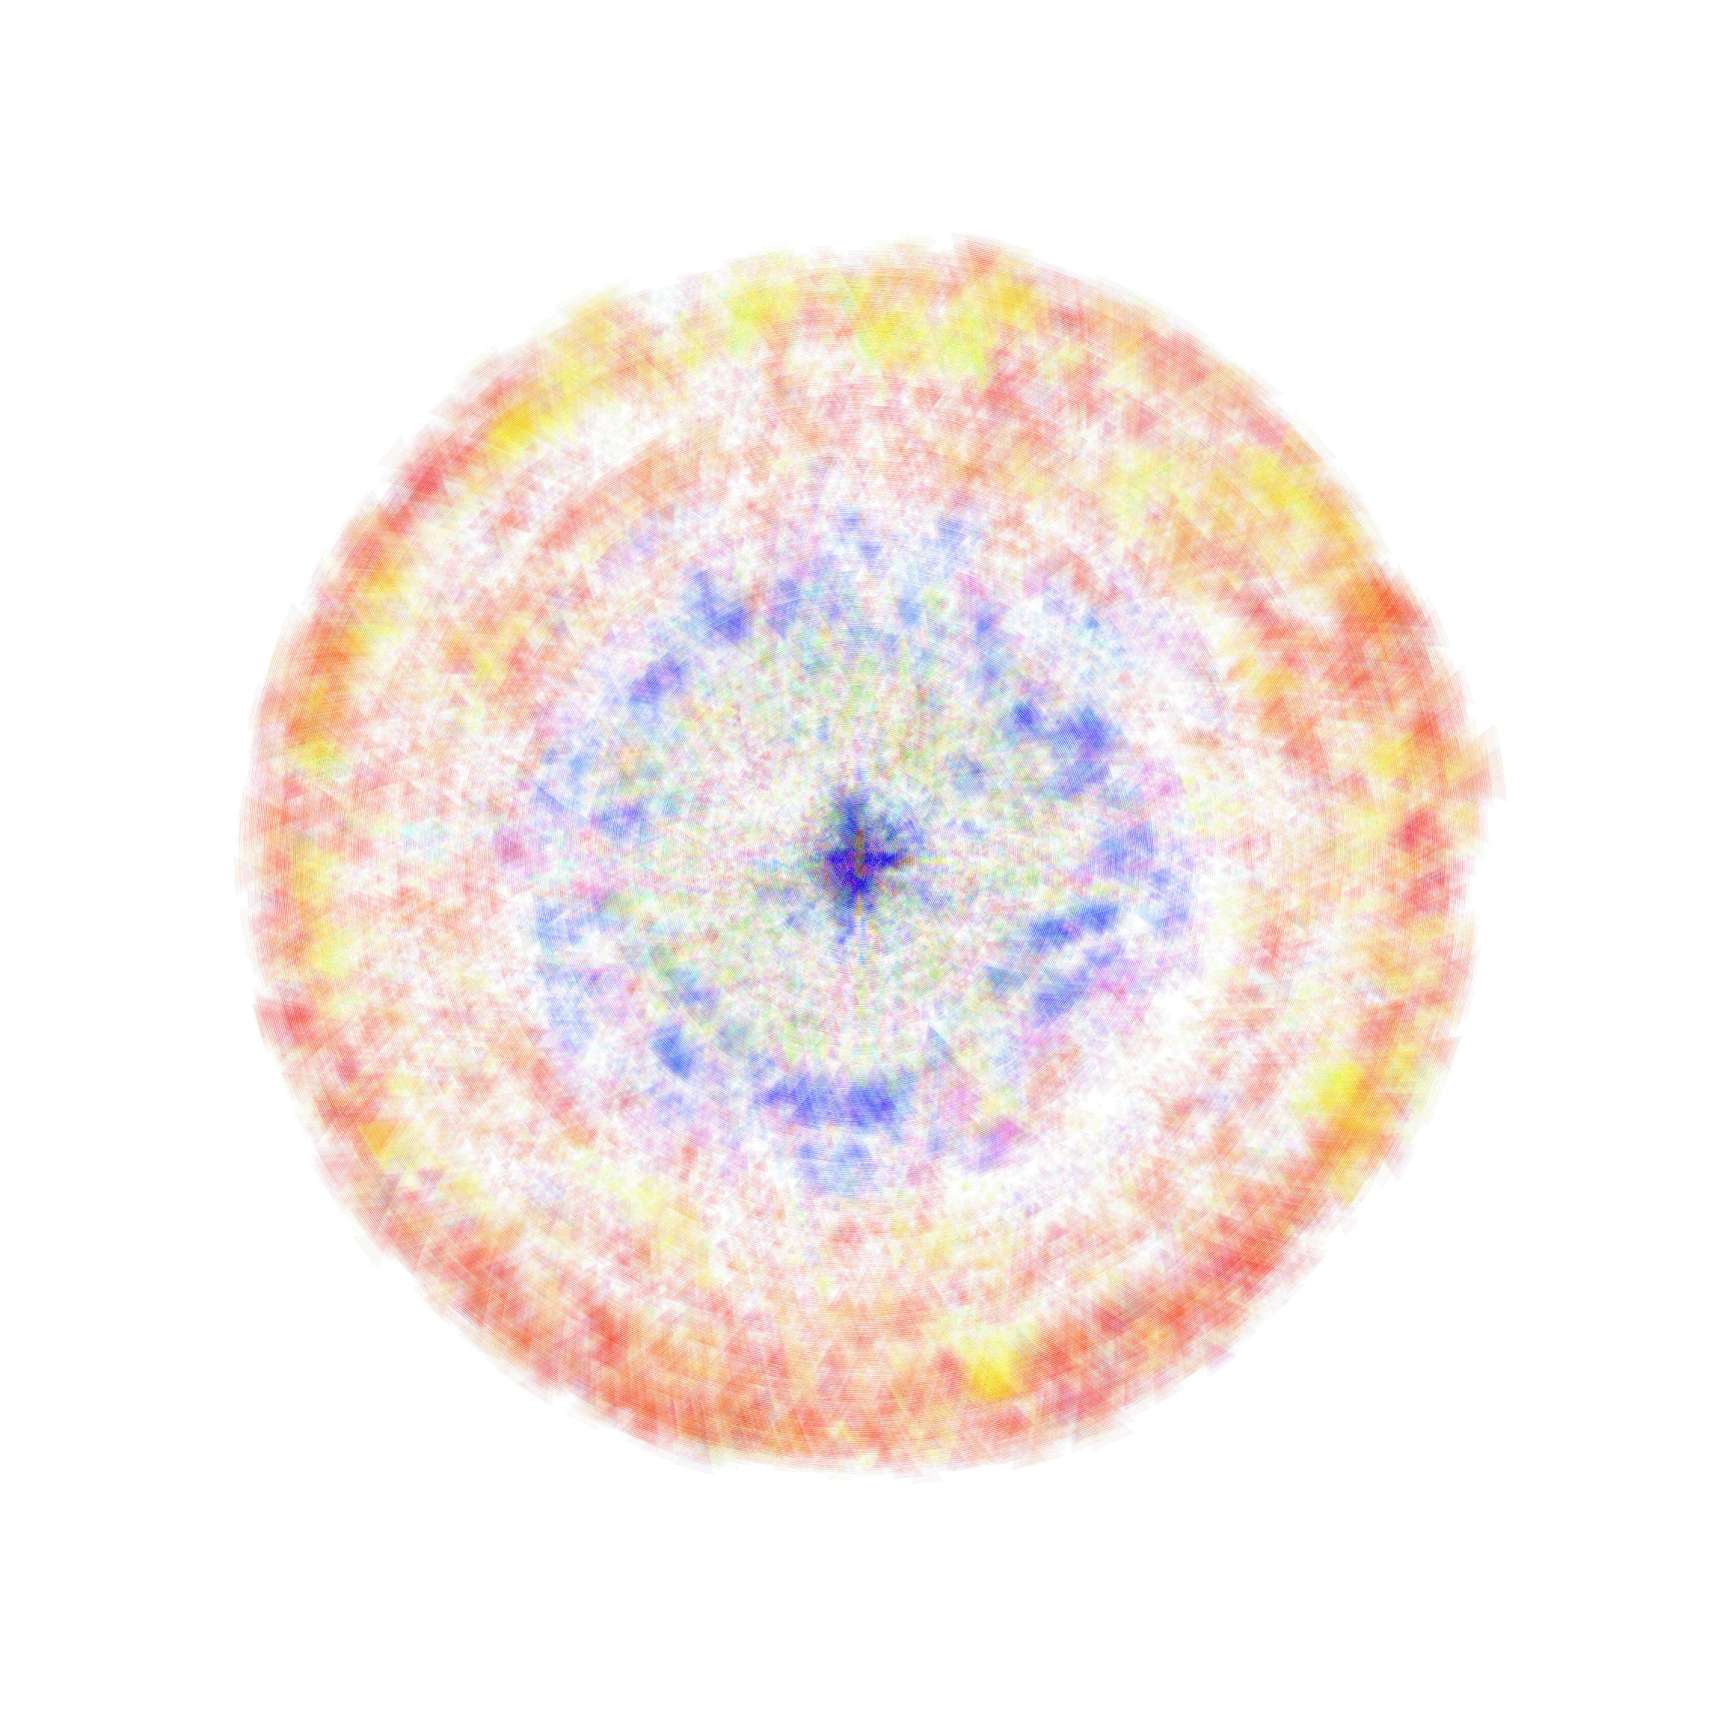
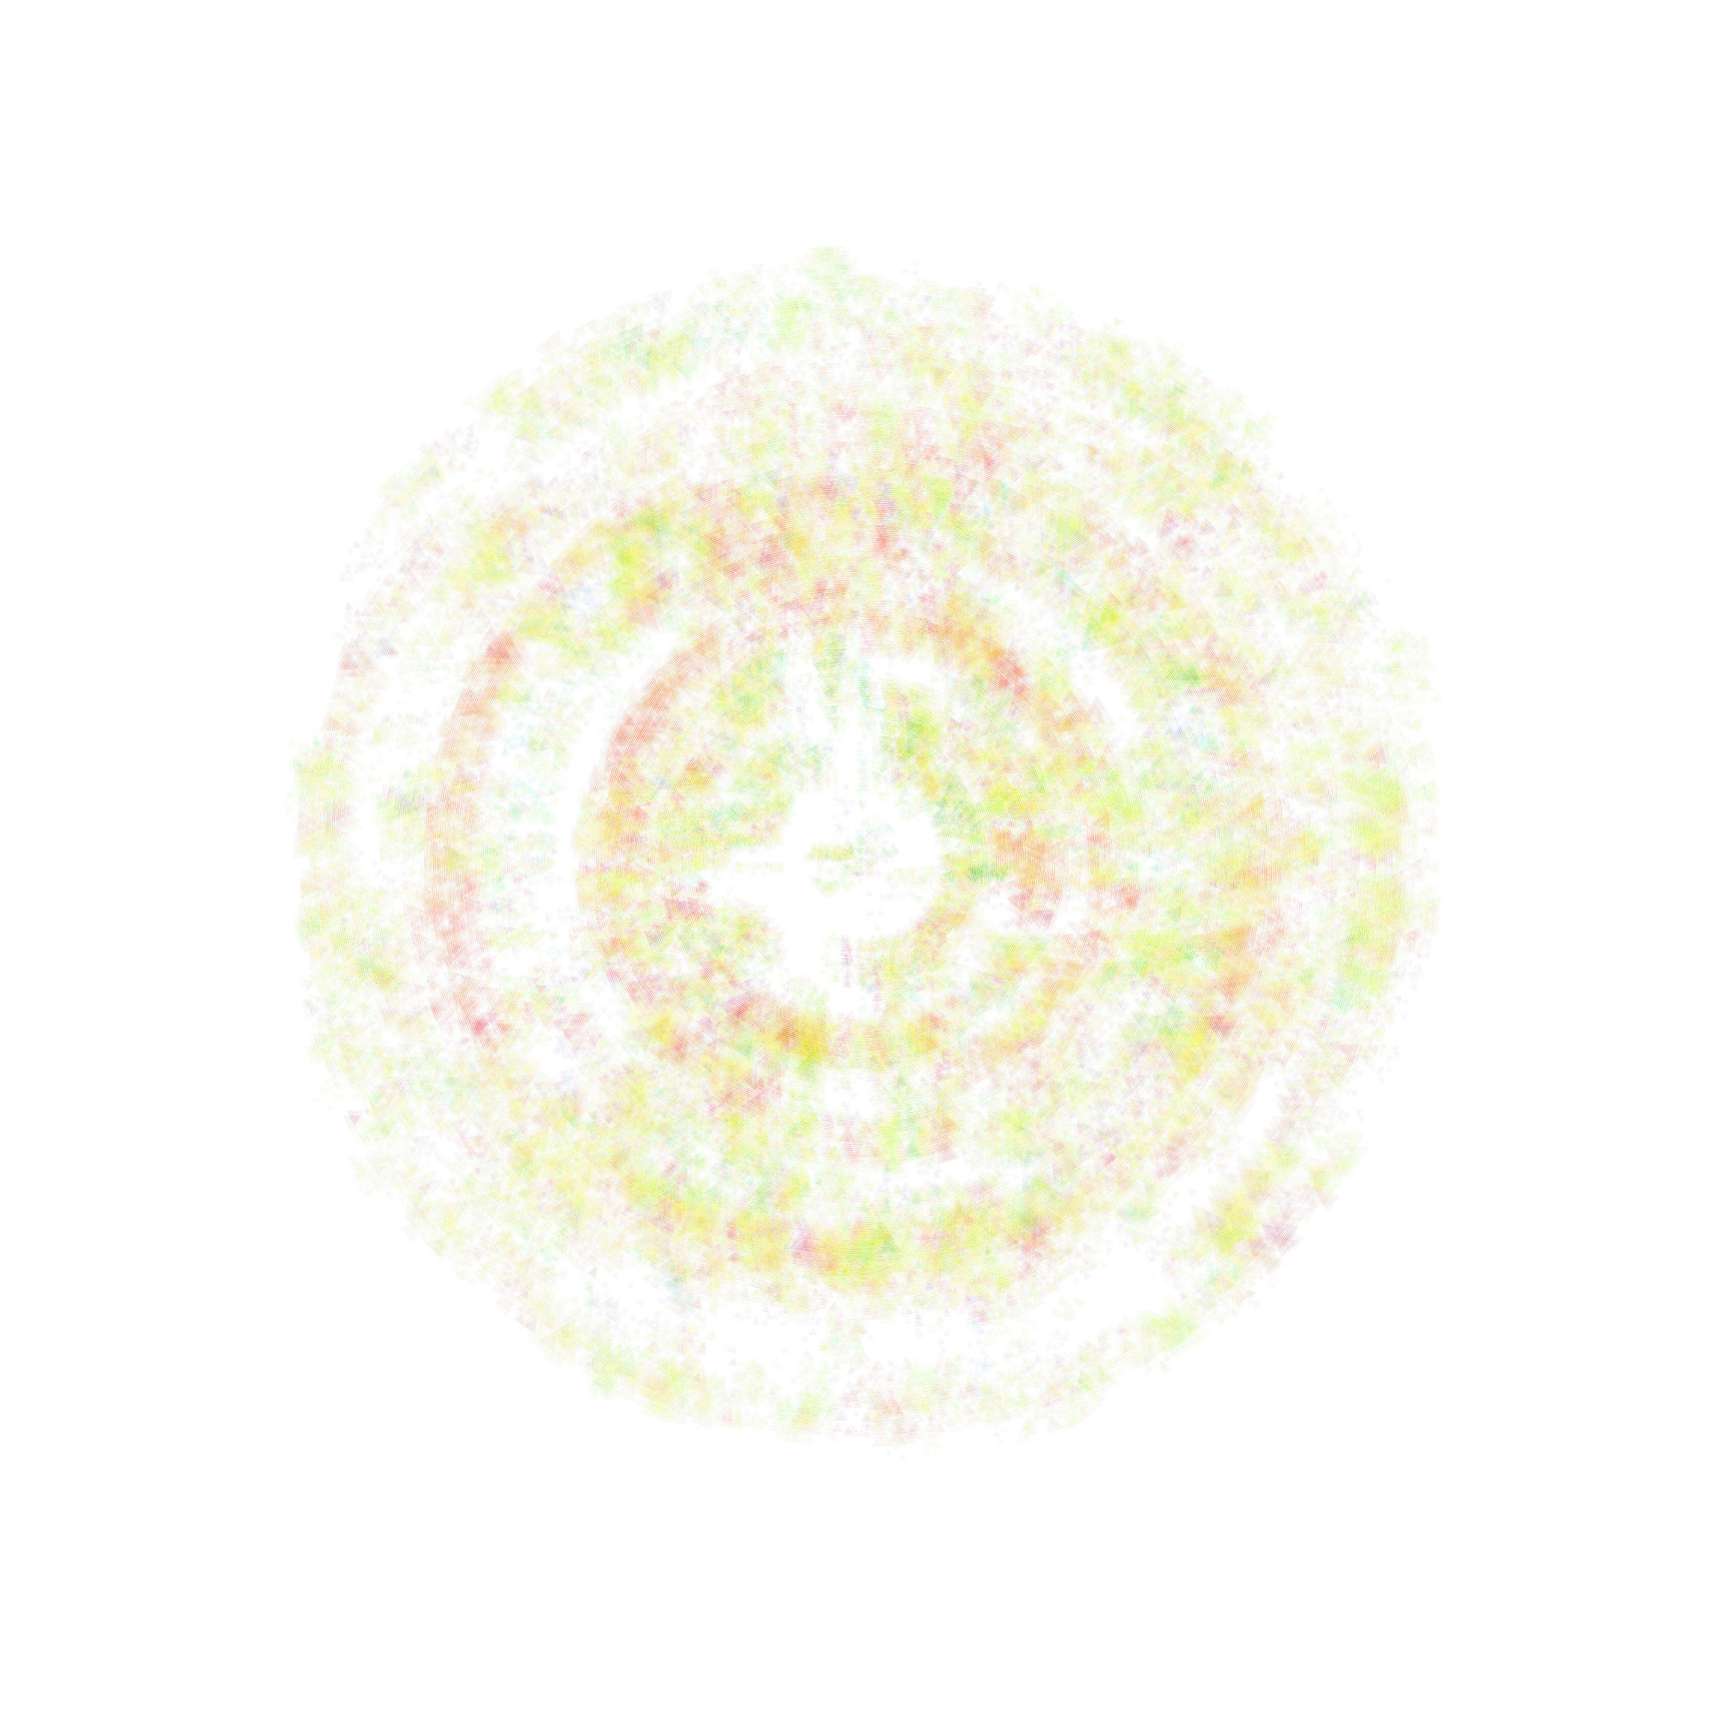
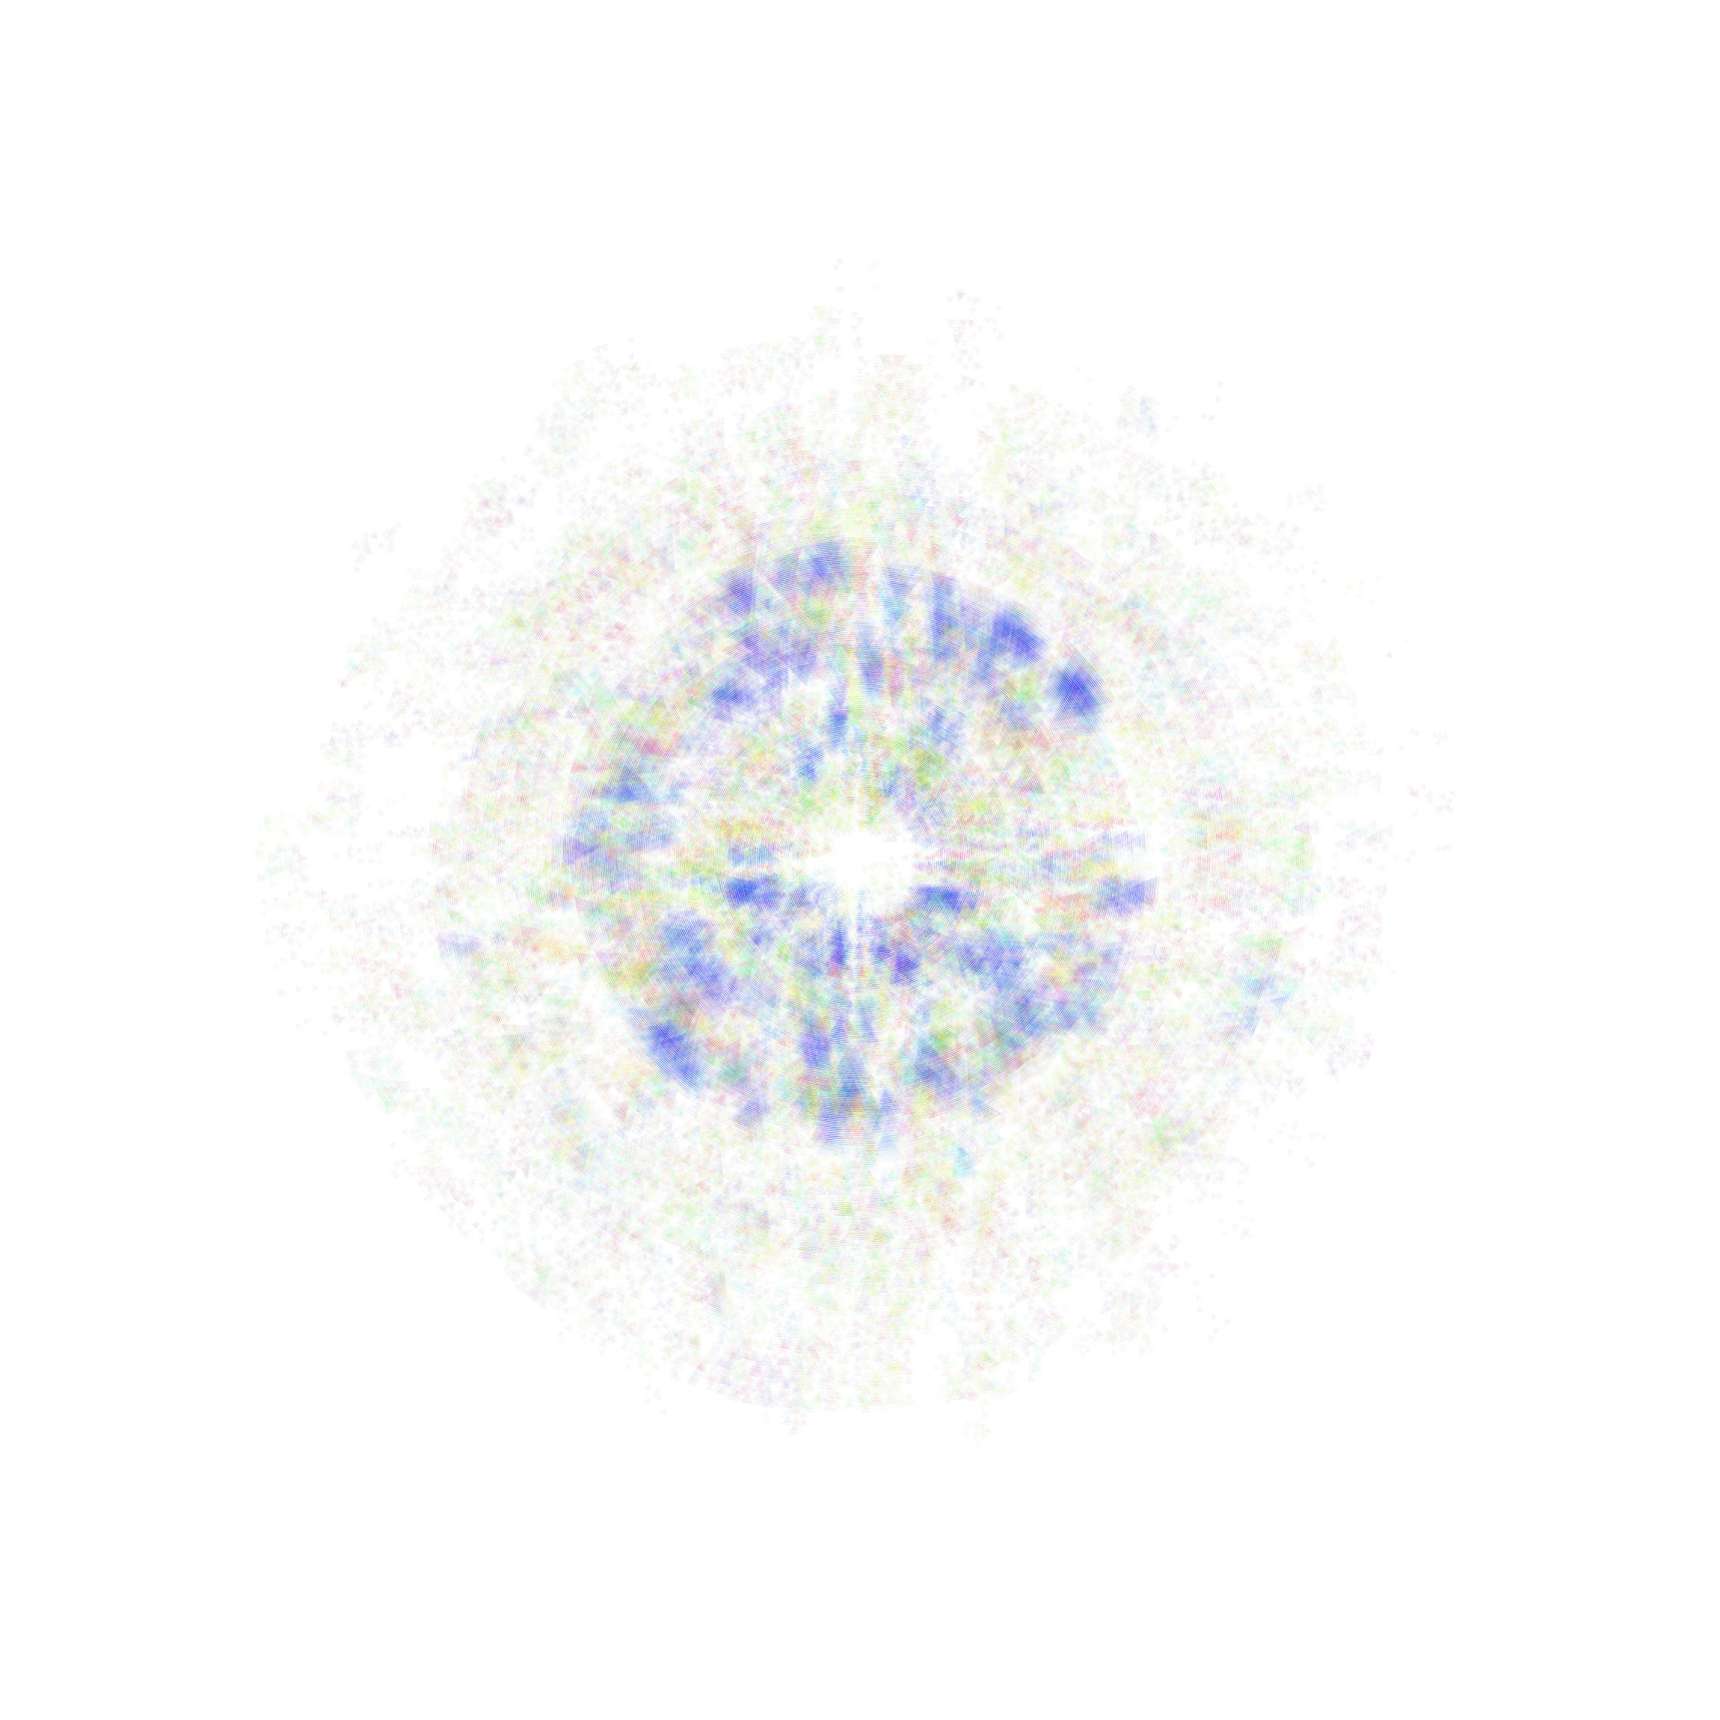
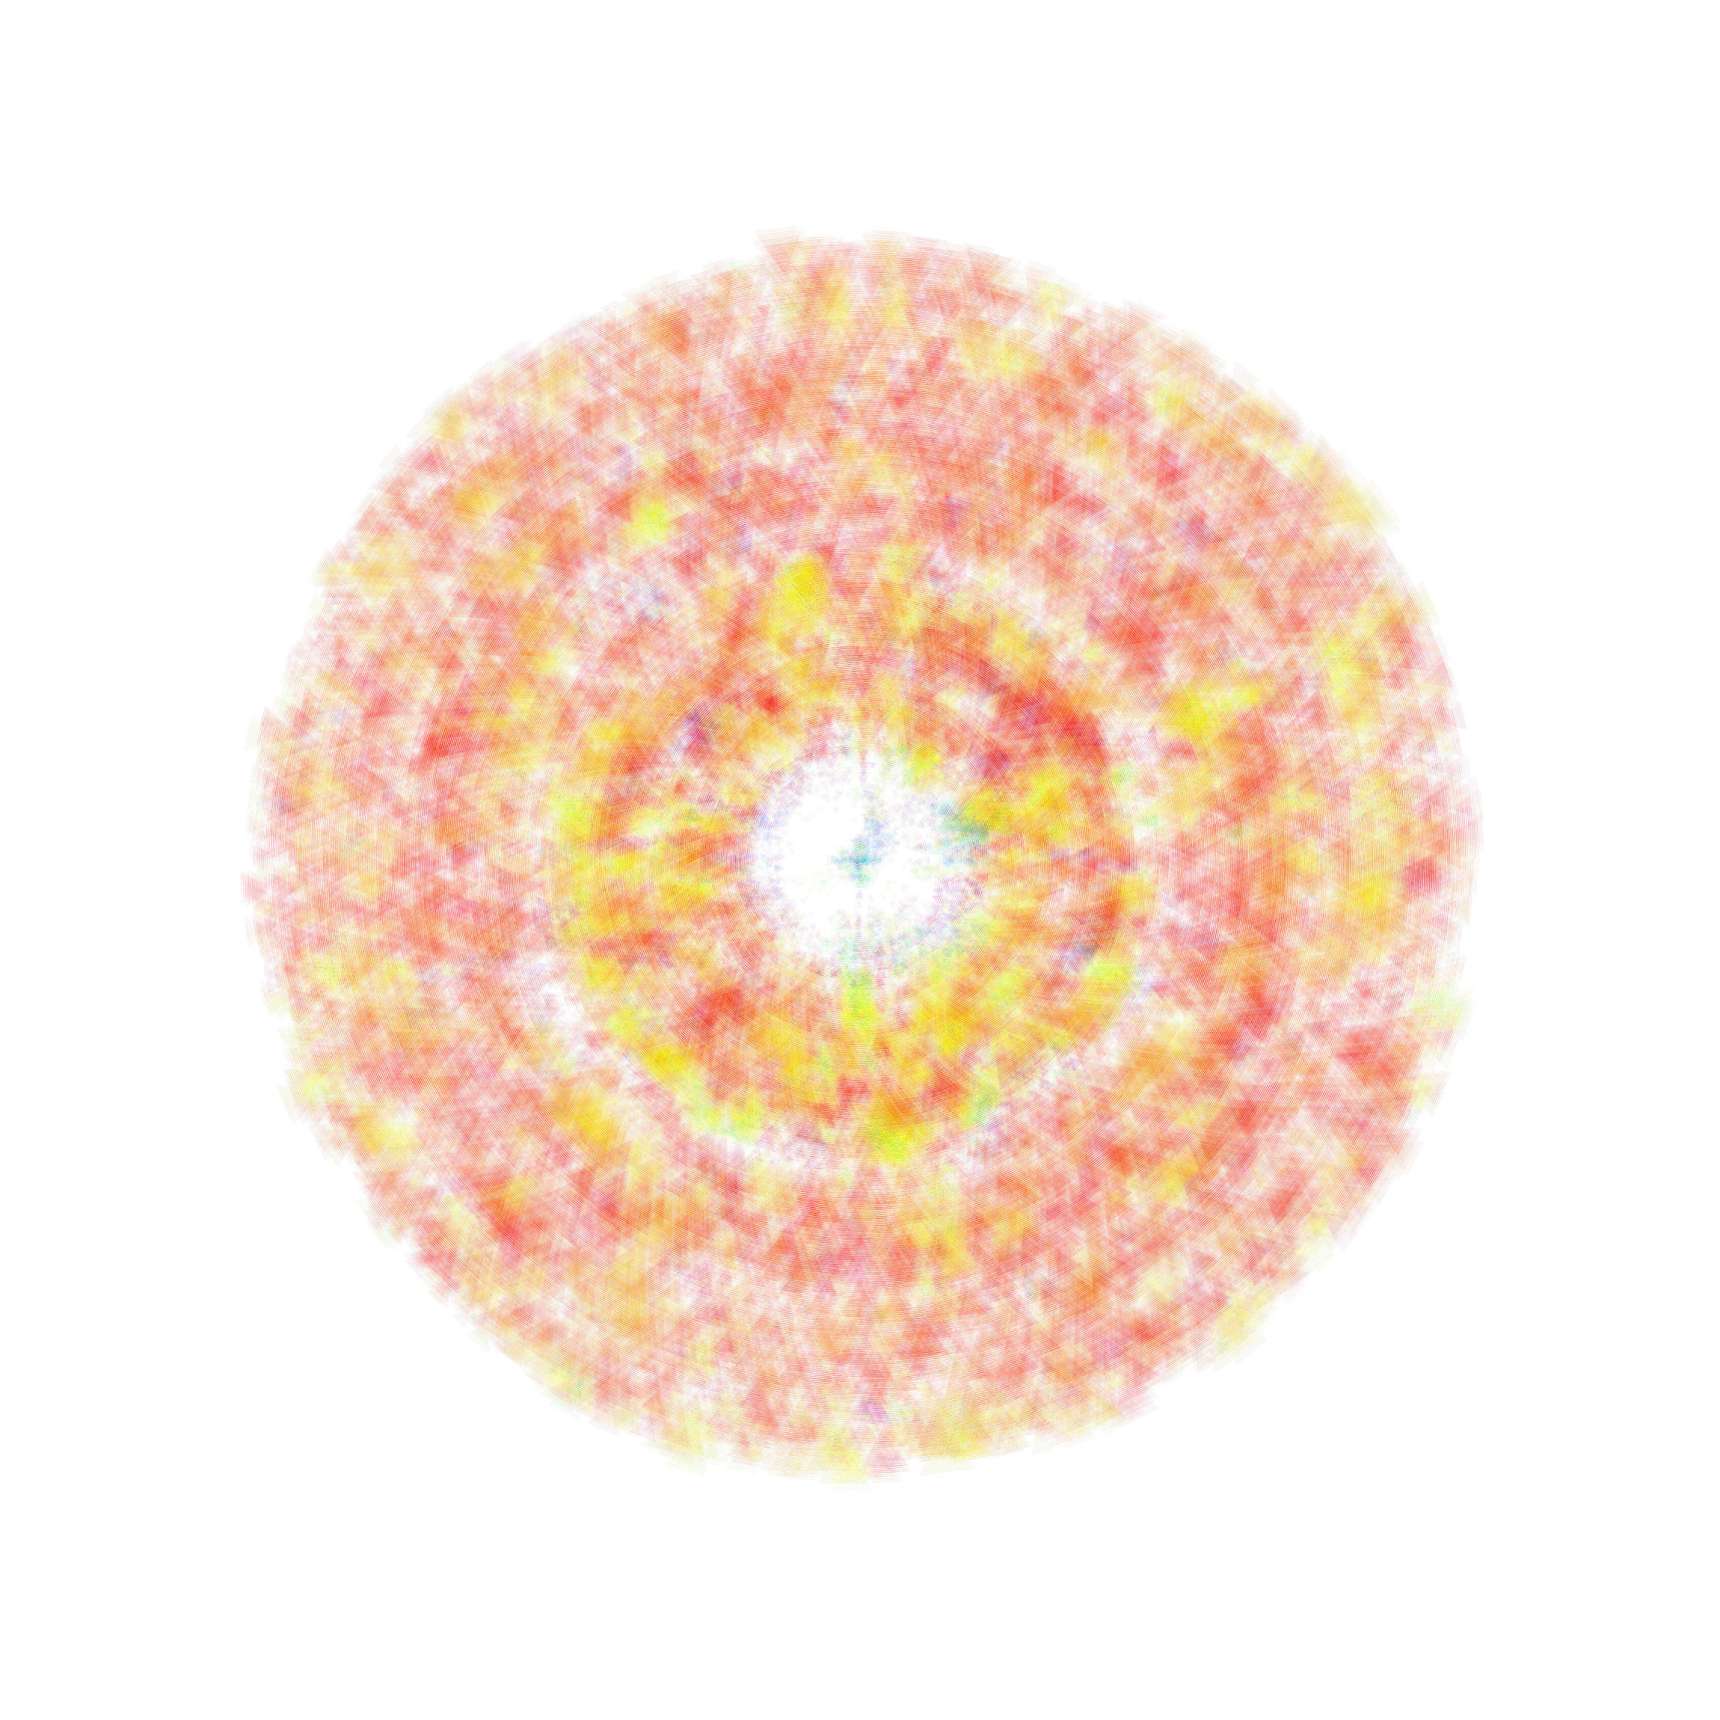
This drawing’s process uses rings to represent one hour of wind data. Within the rings, triangles drawn with thin transparent lines represent individual seconds. Each triangle’s size is proportional to that second’s wind speed. Color relates to wind direction and line thickness relates to wind speed. Wind direction is mapped to the RGB color wheel with red meaning winds were from the north, green from the east, blue from the south and purple from the west.