Winds.Process.2013.01
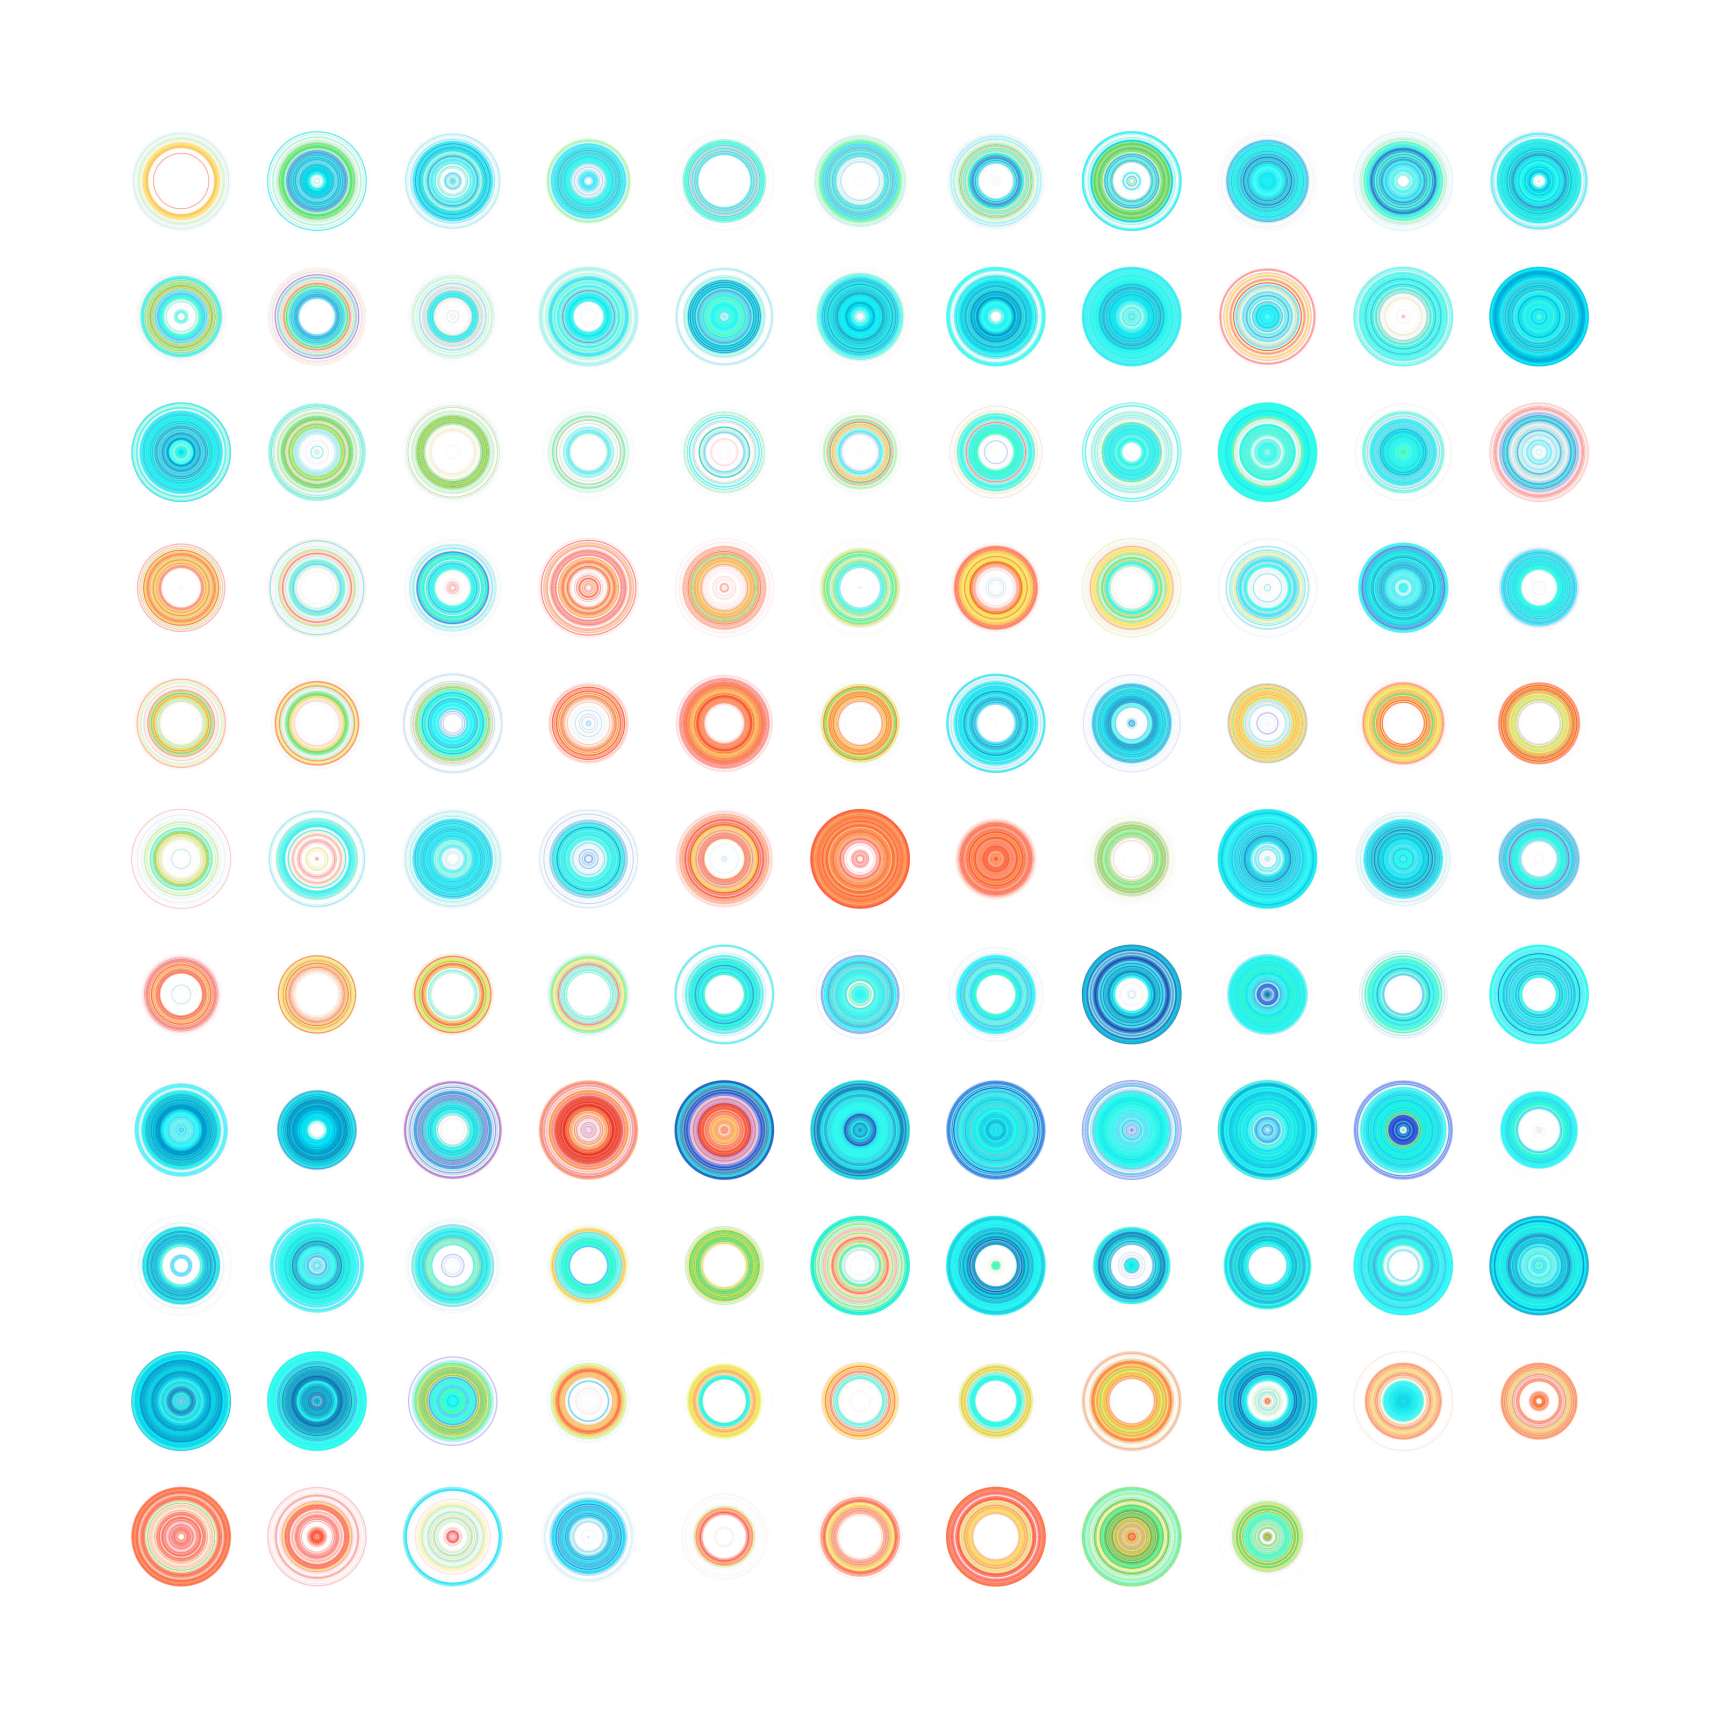
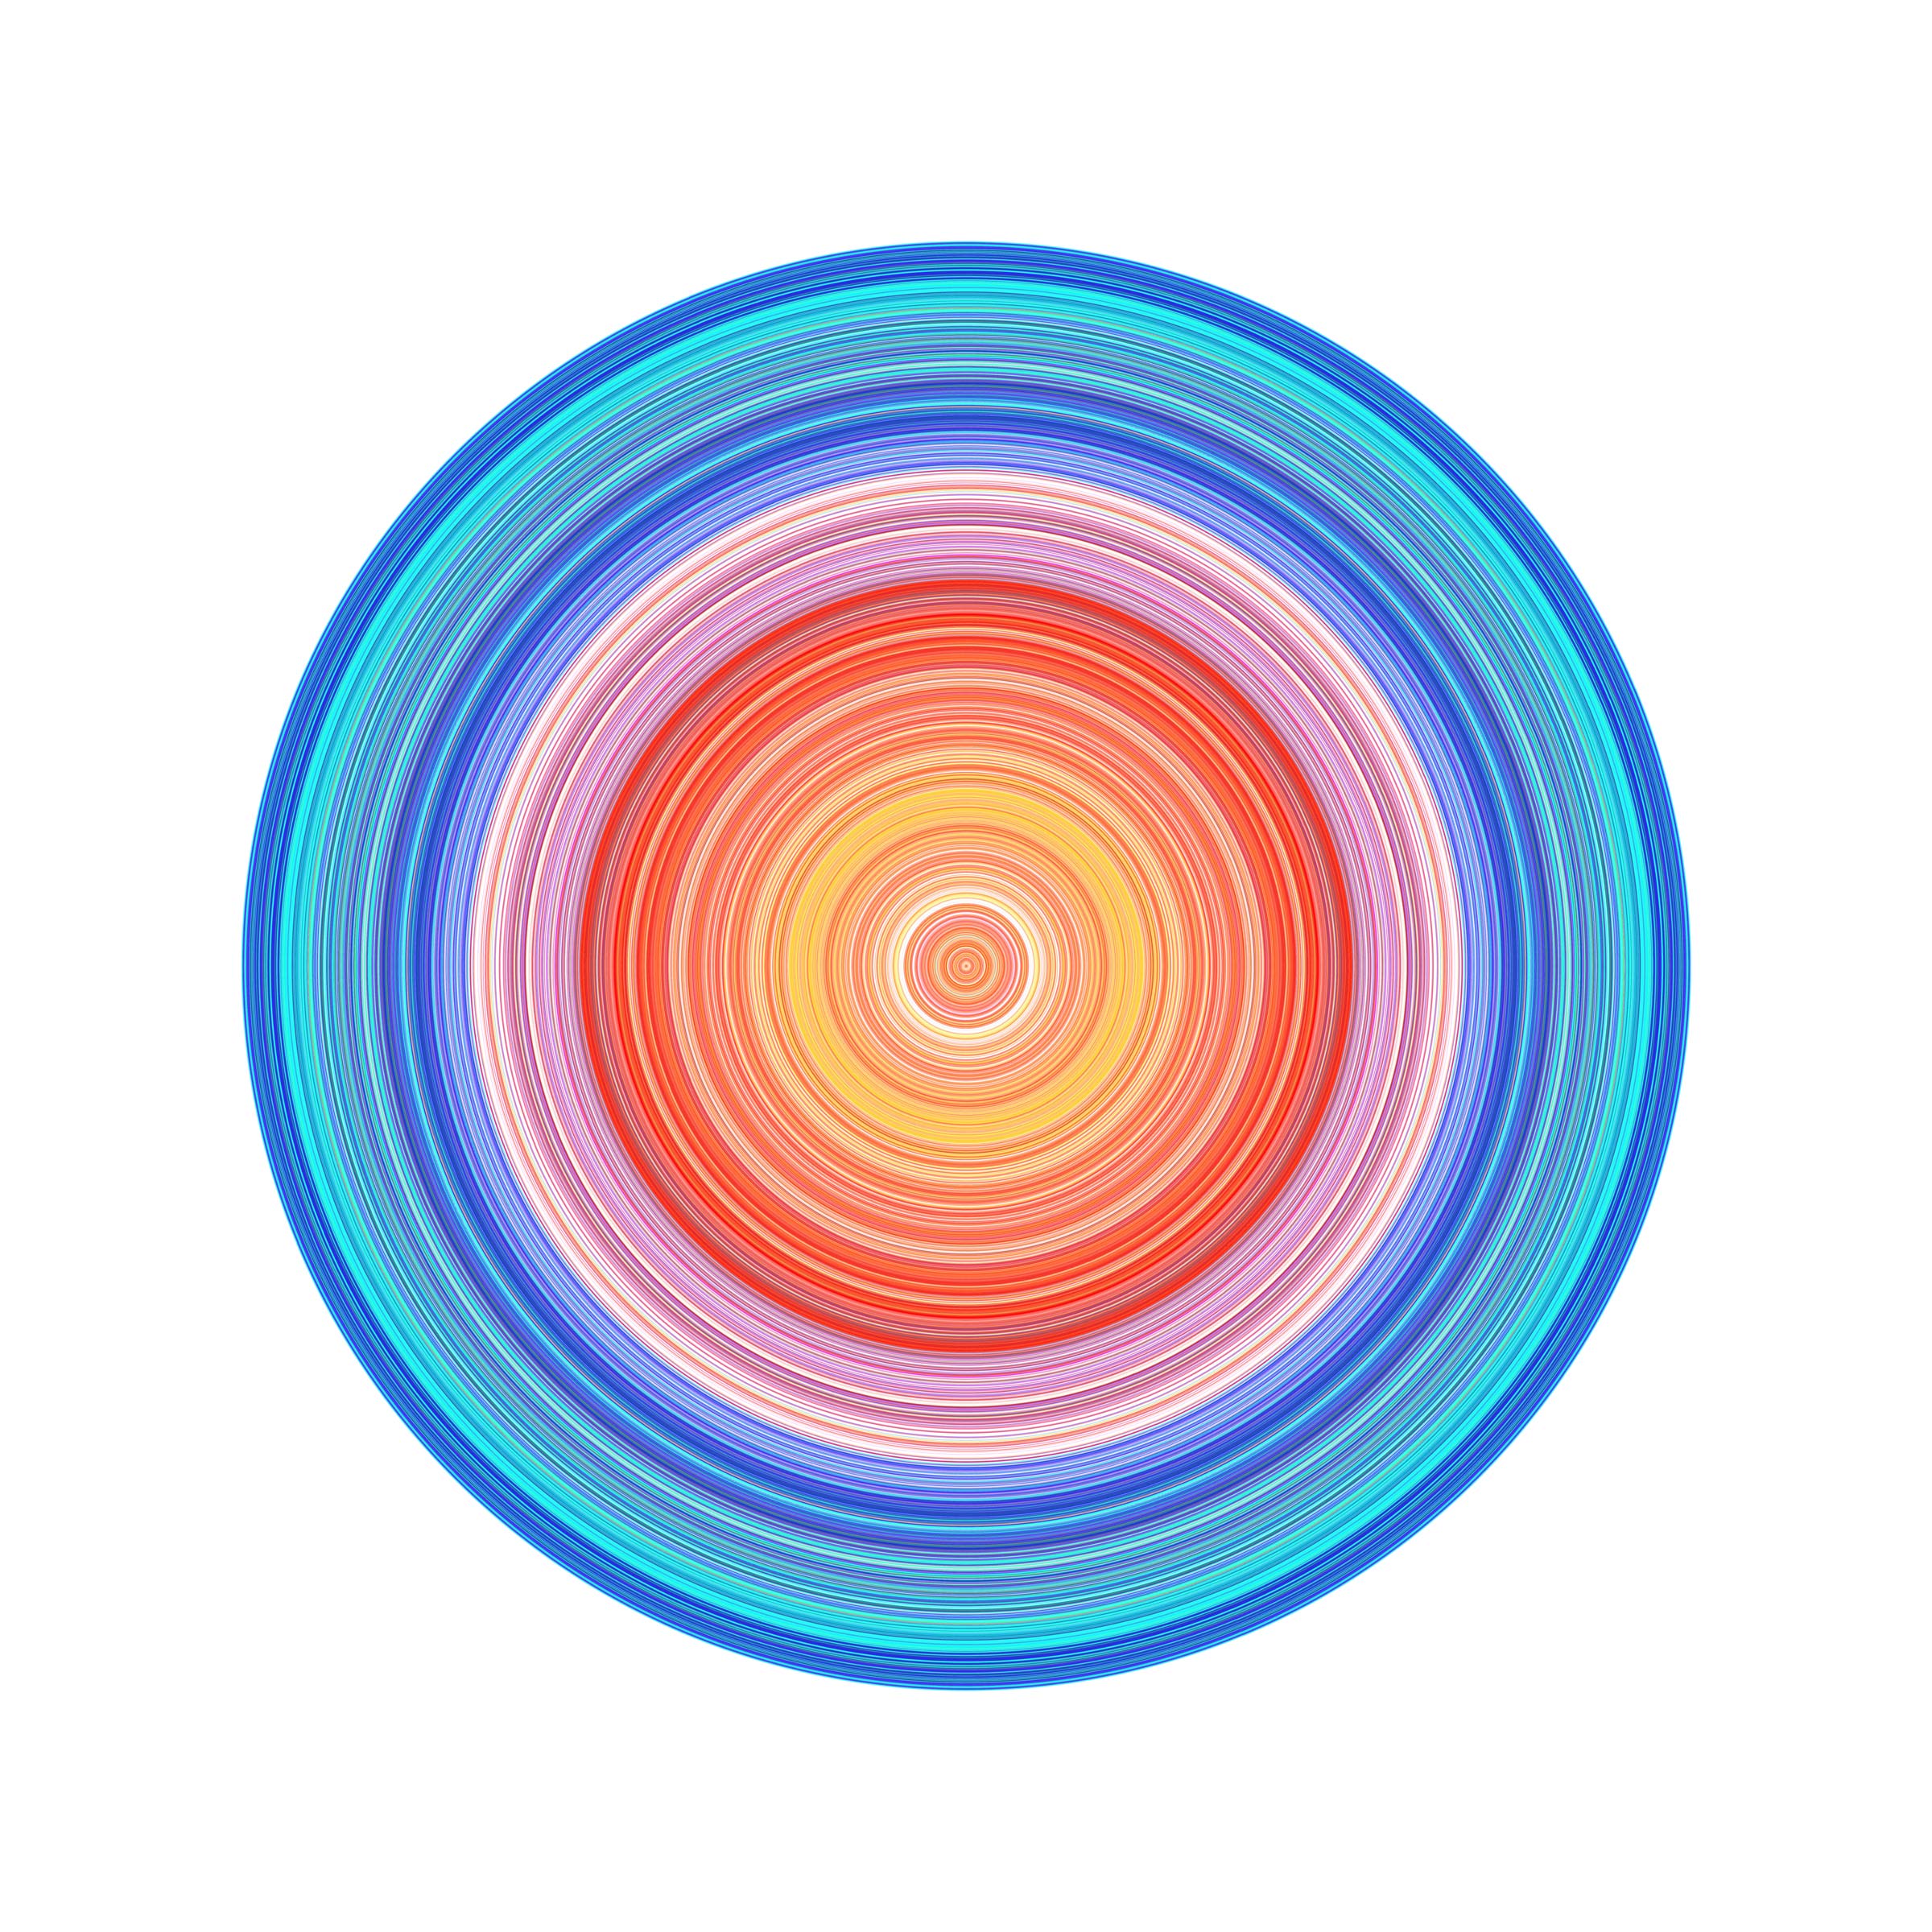
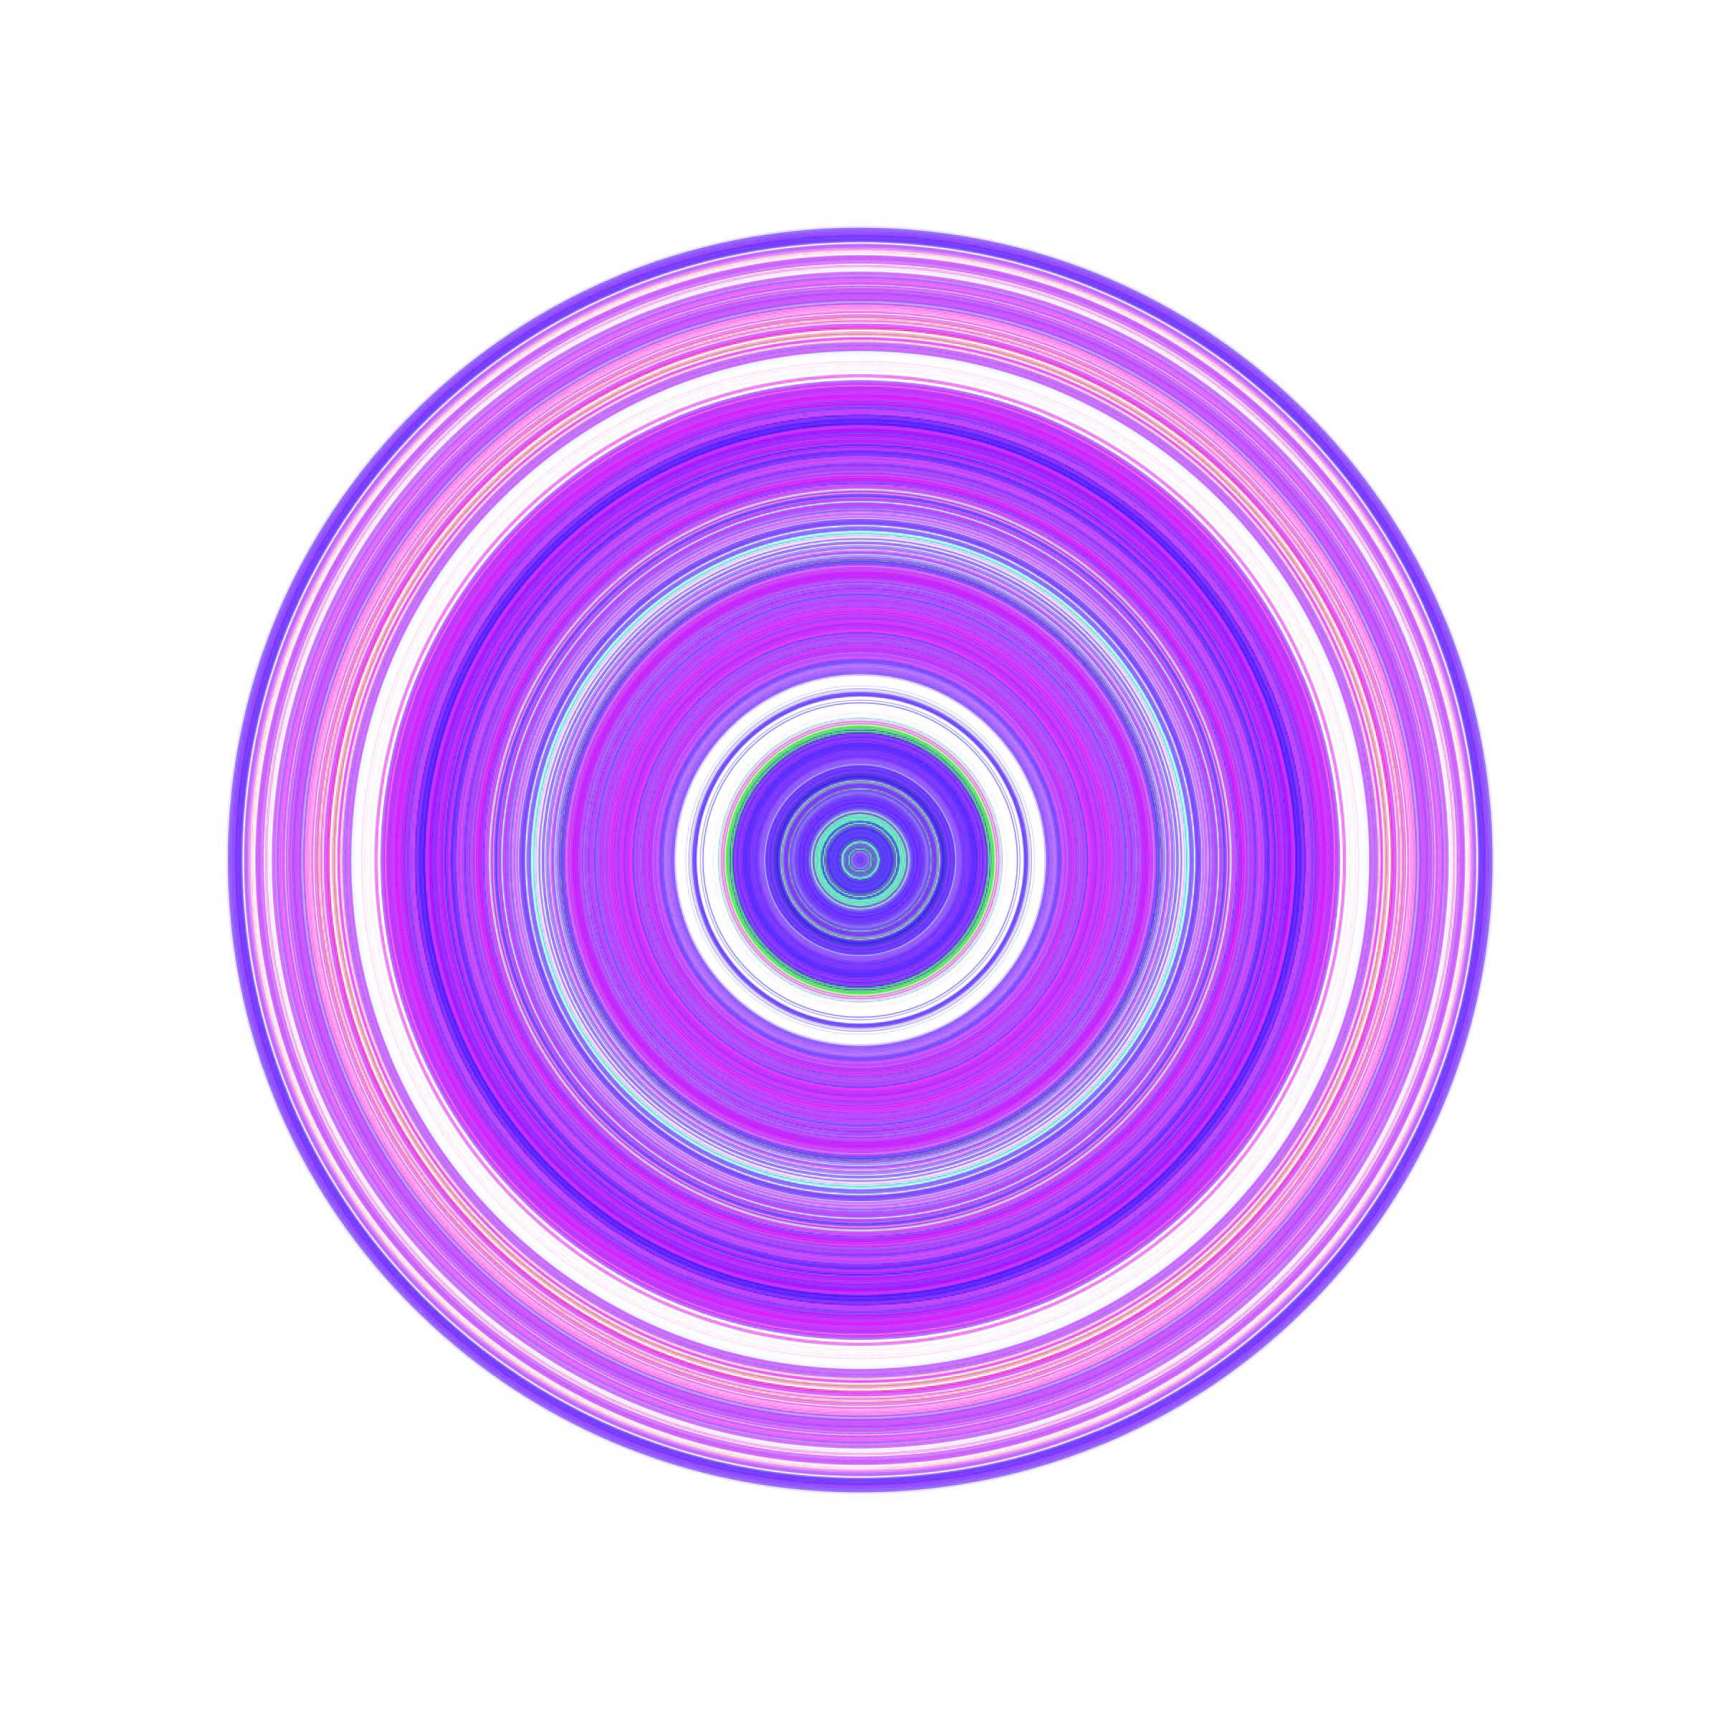
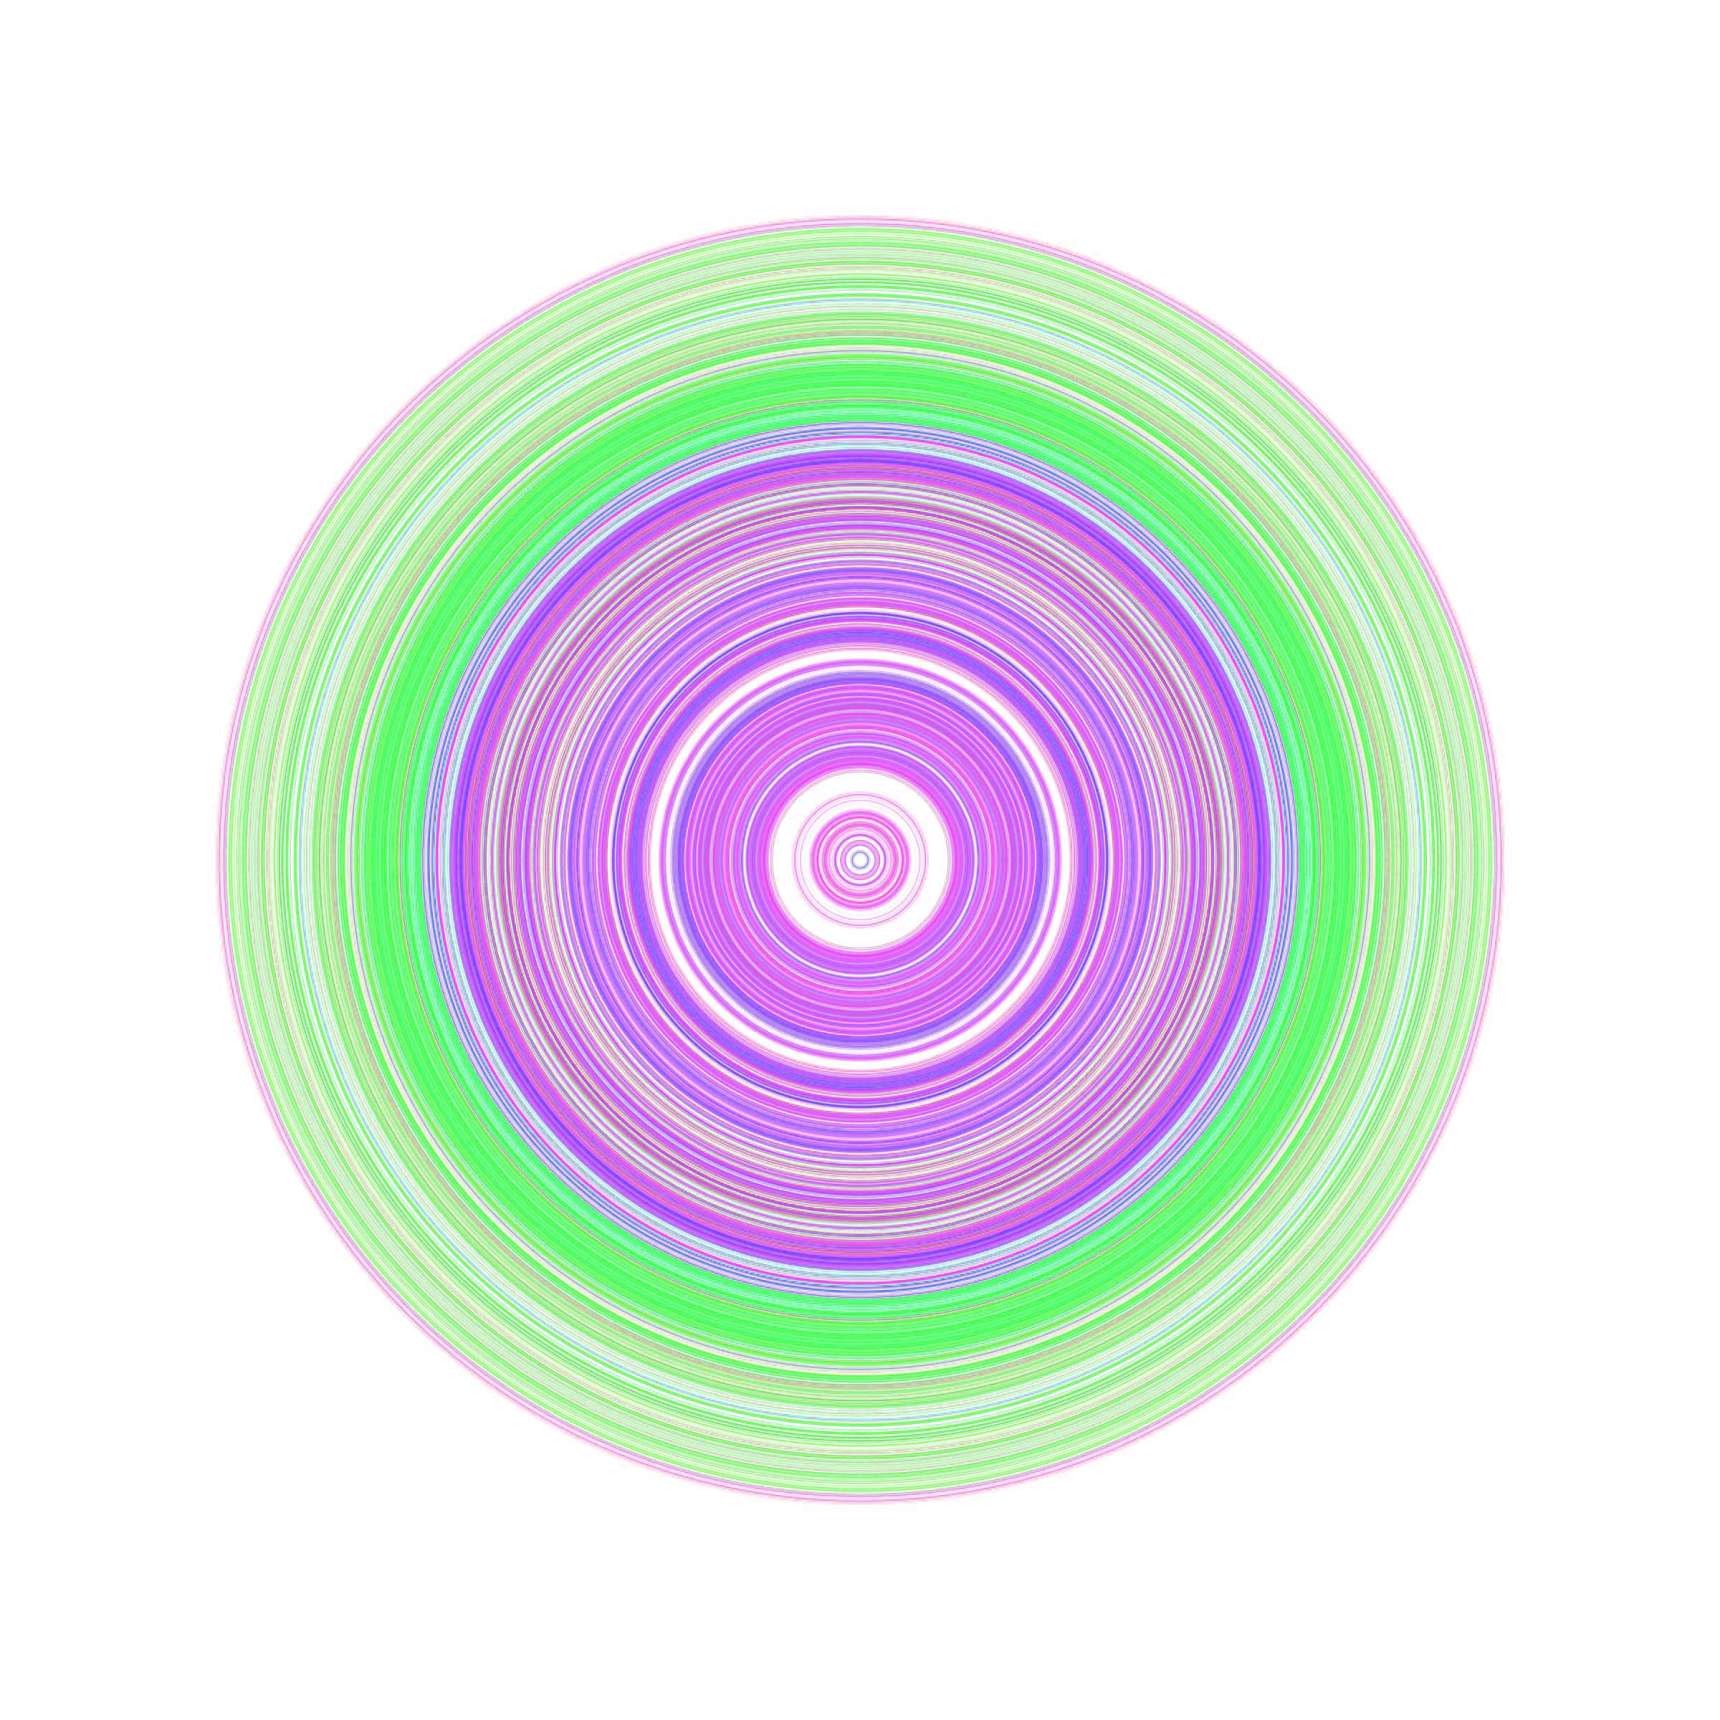
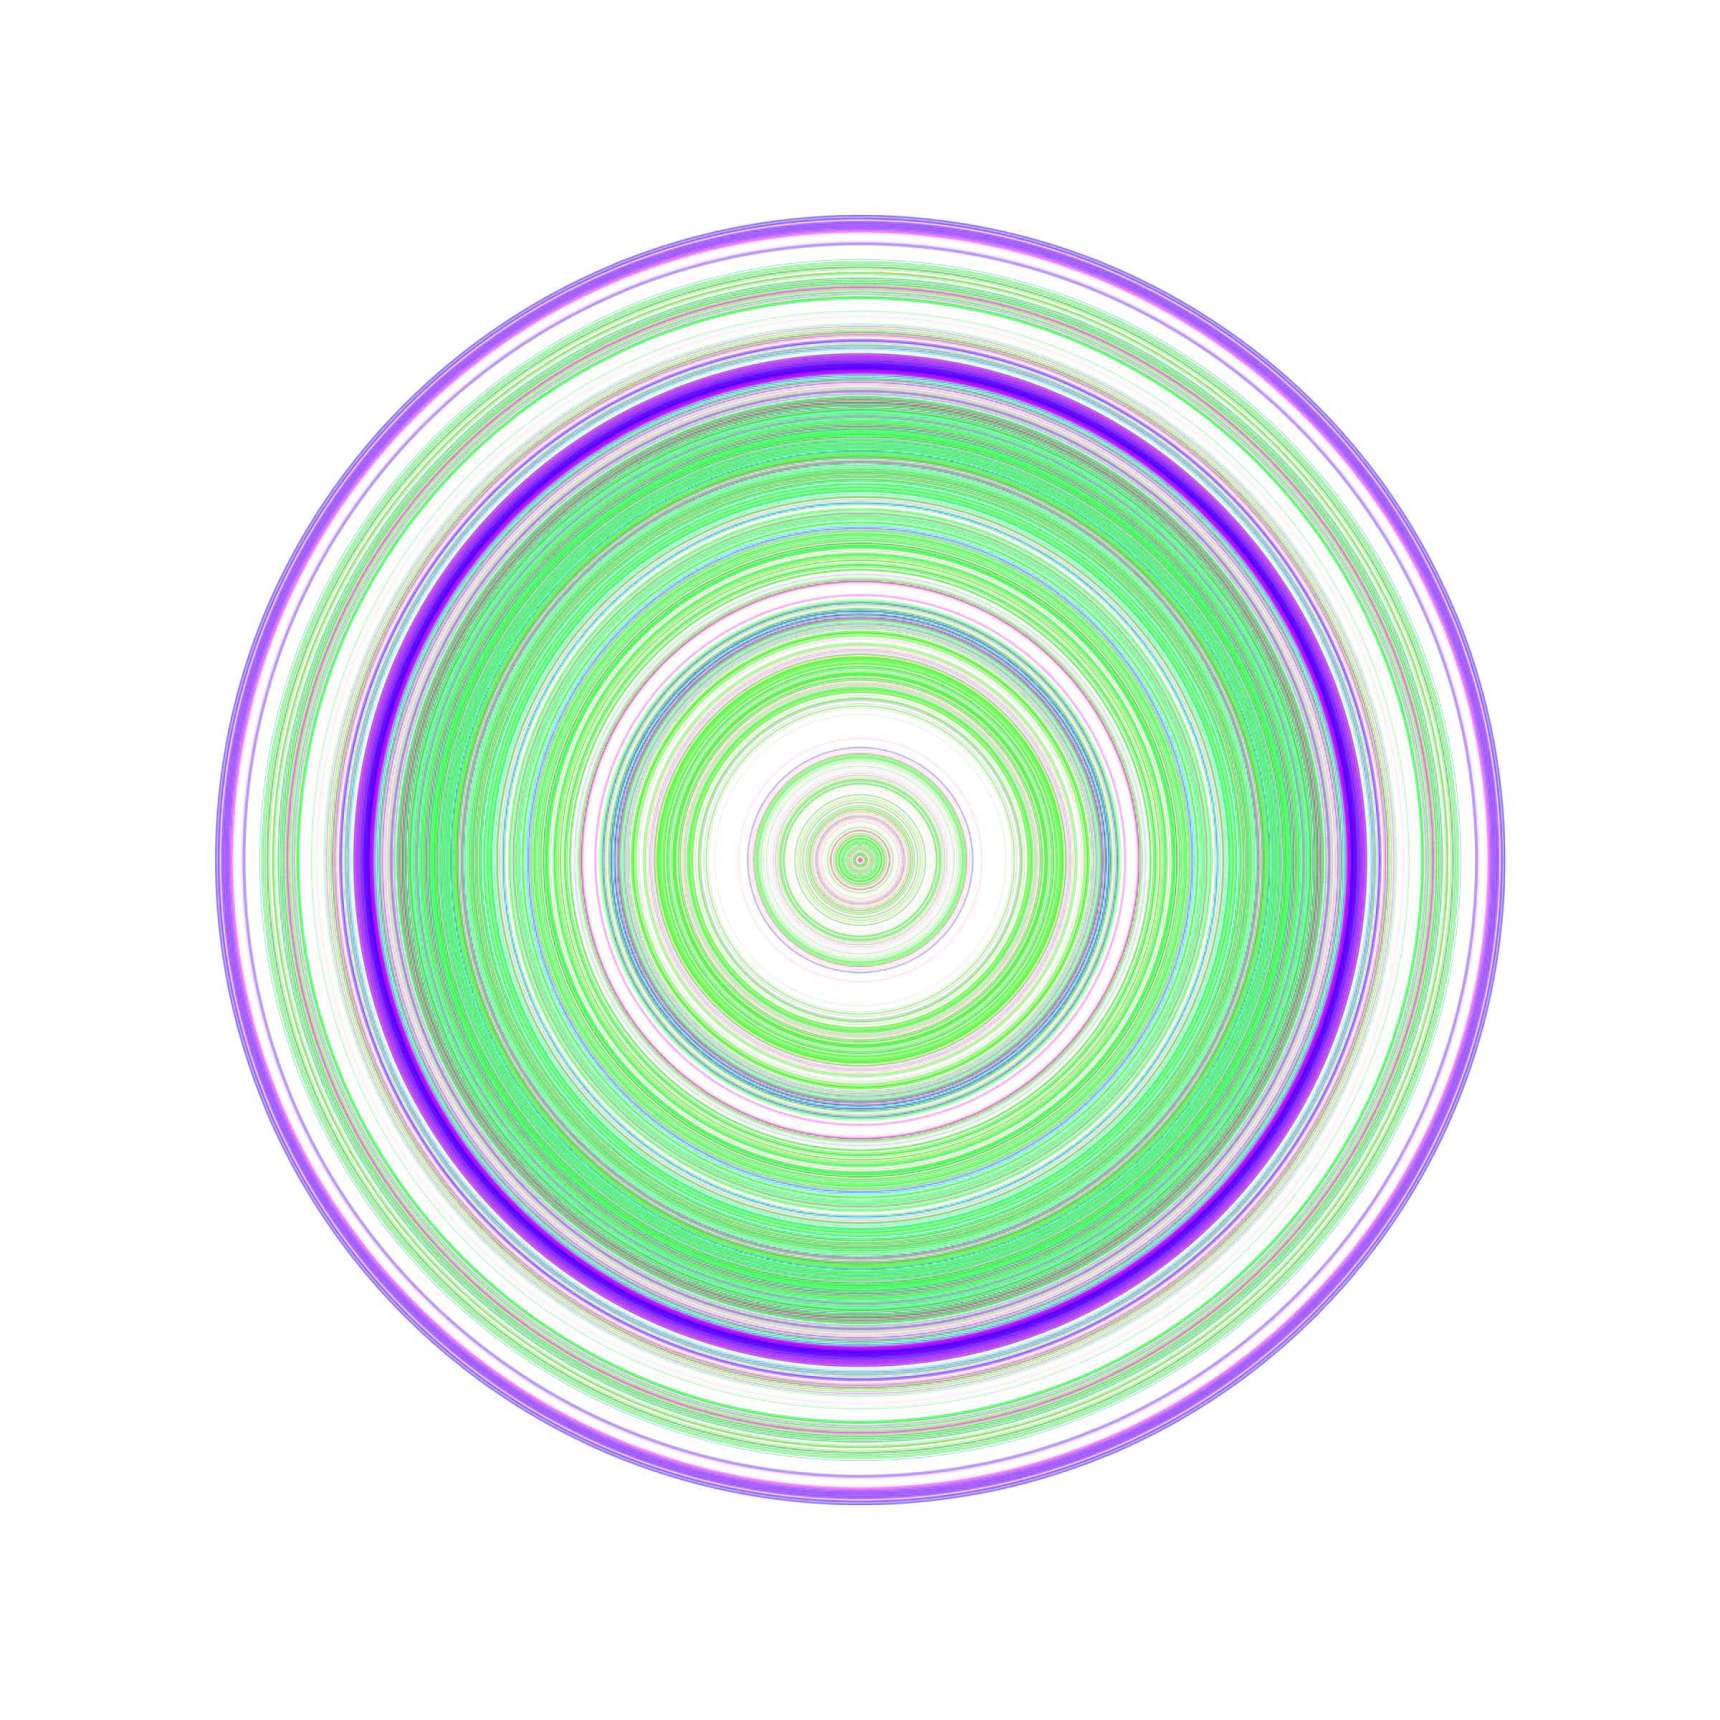
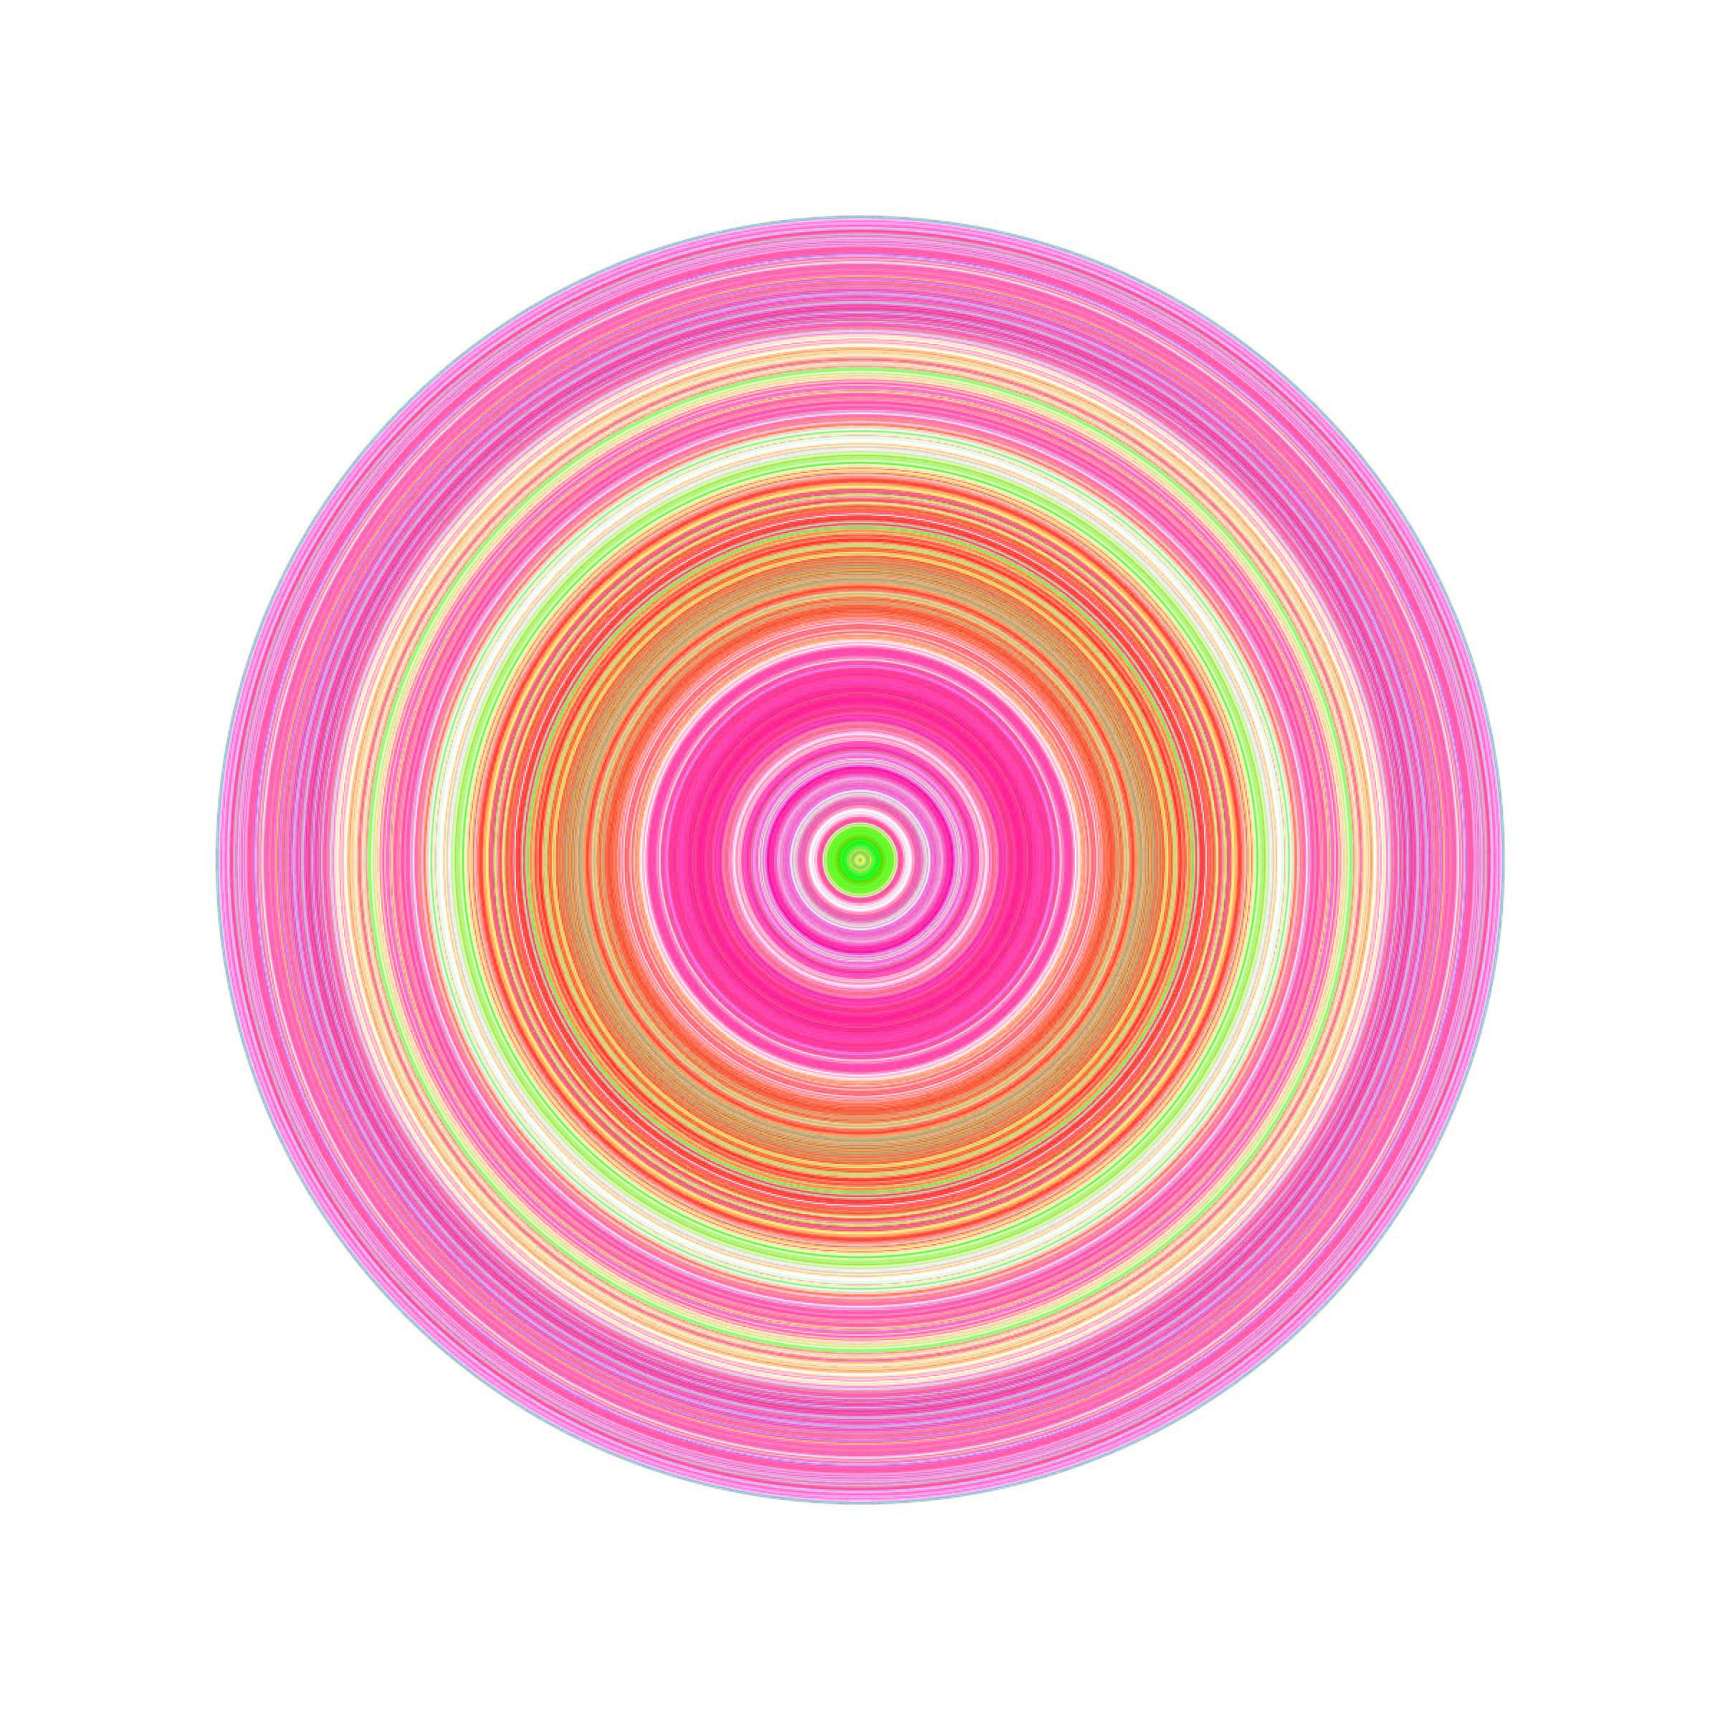
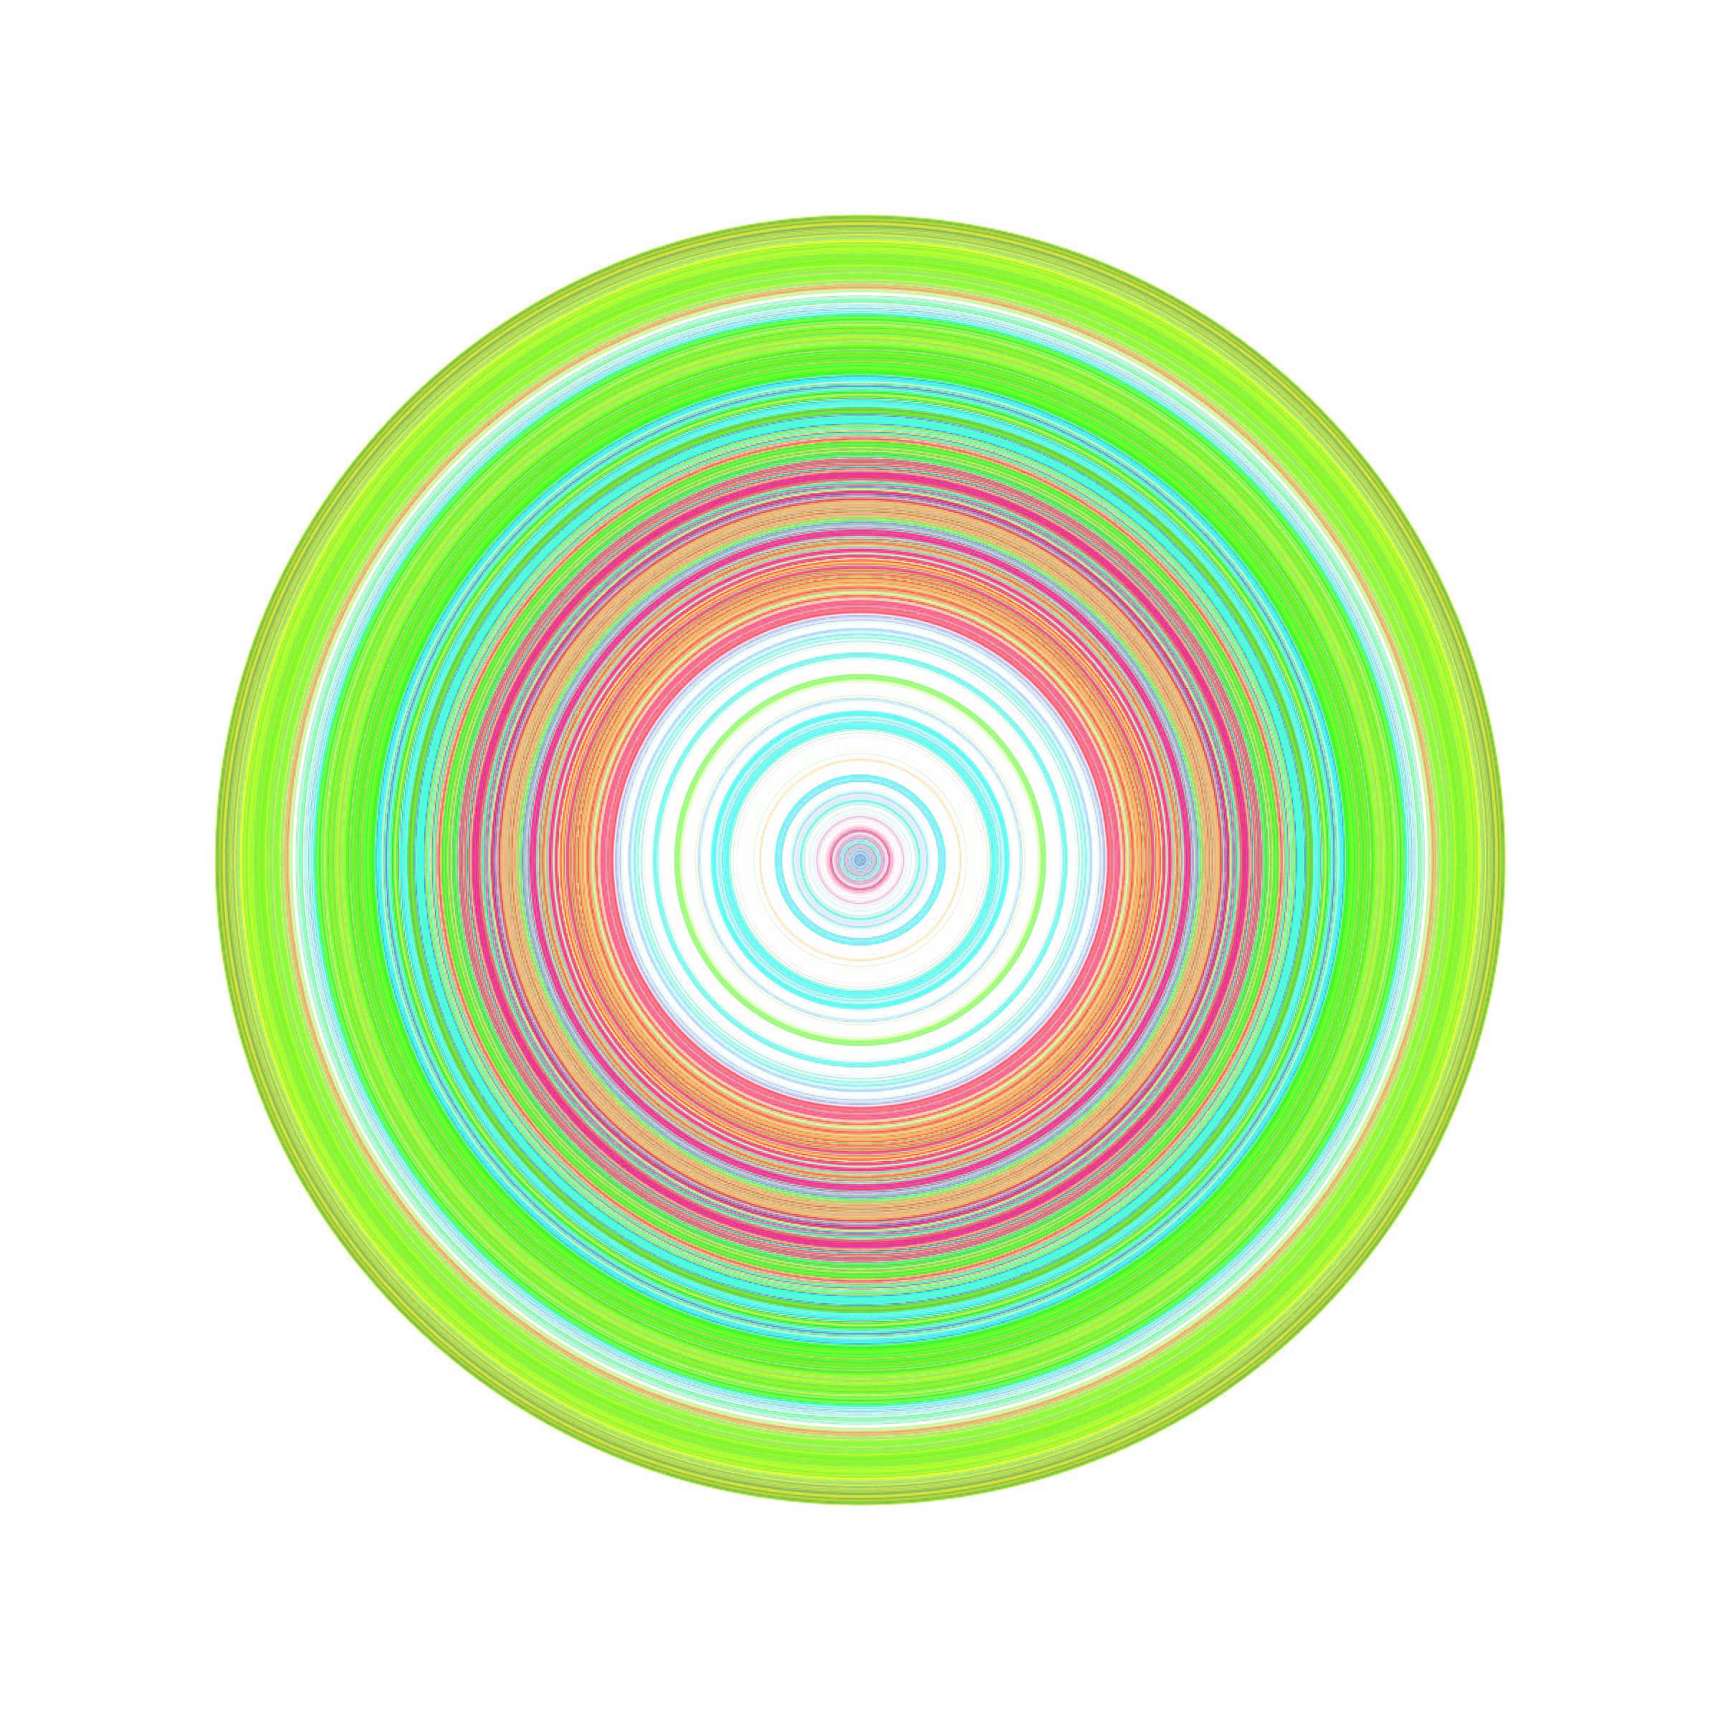
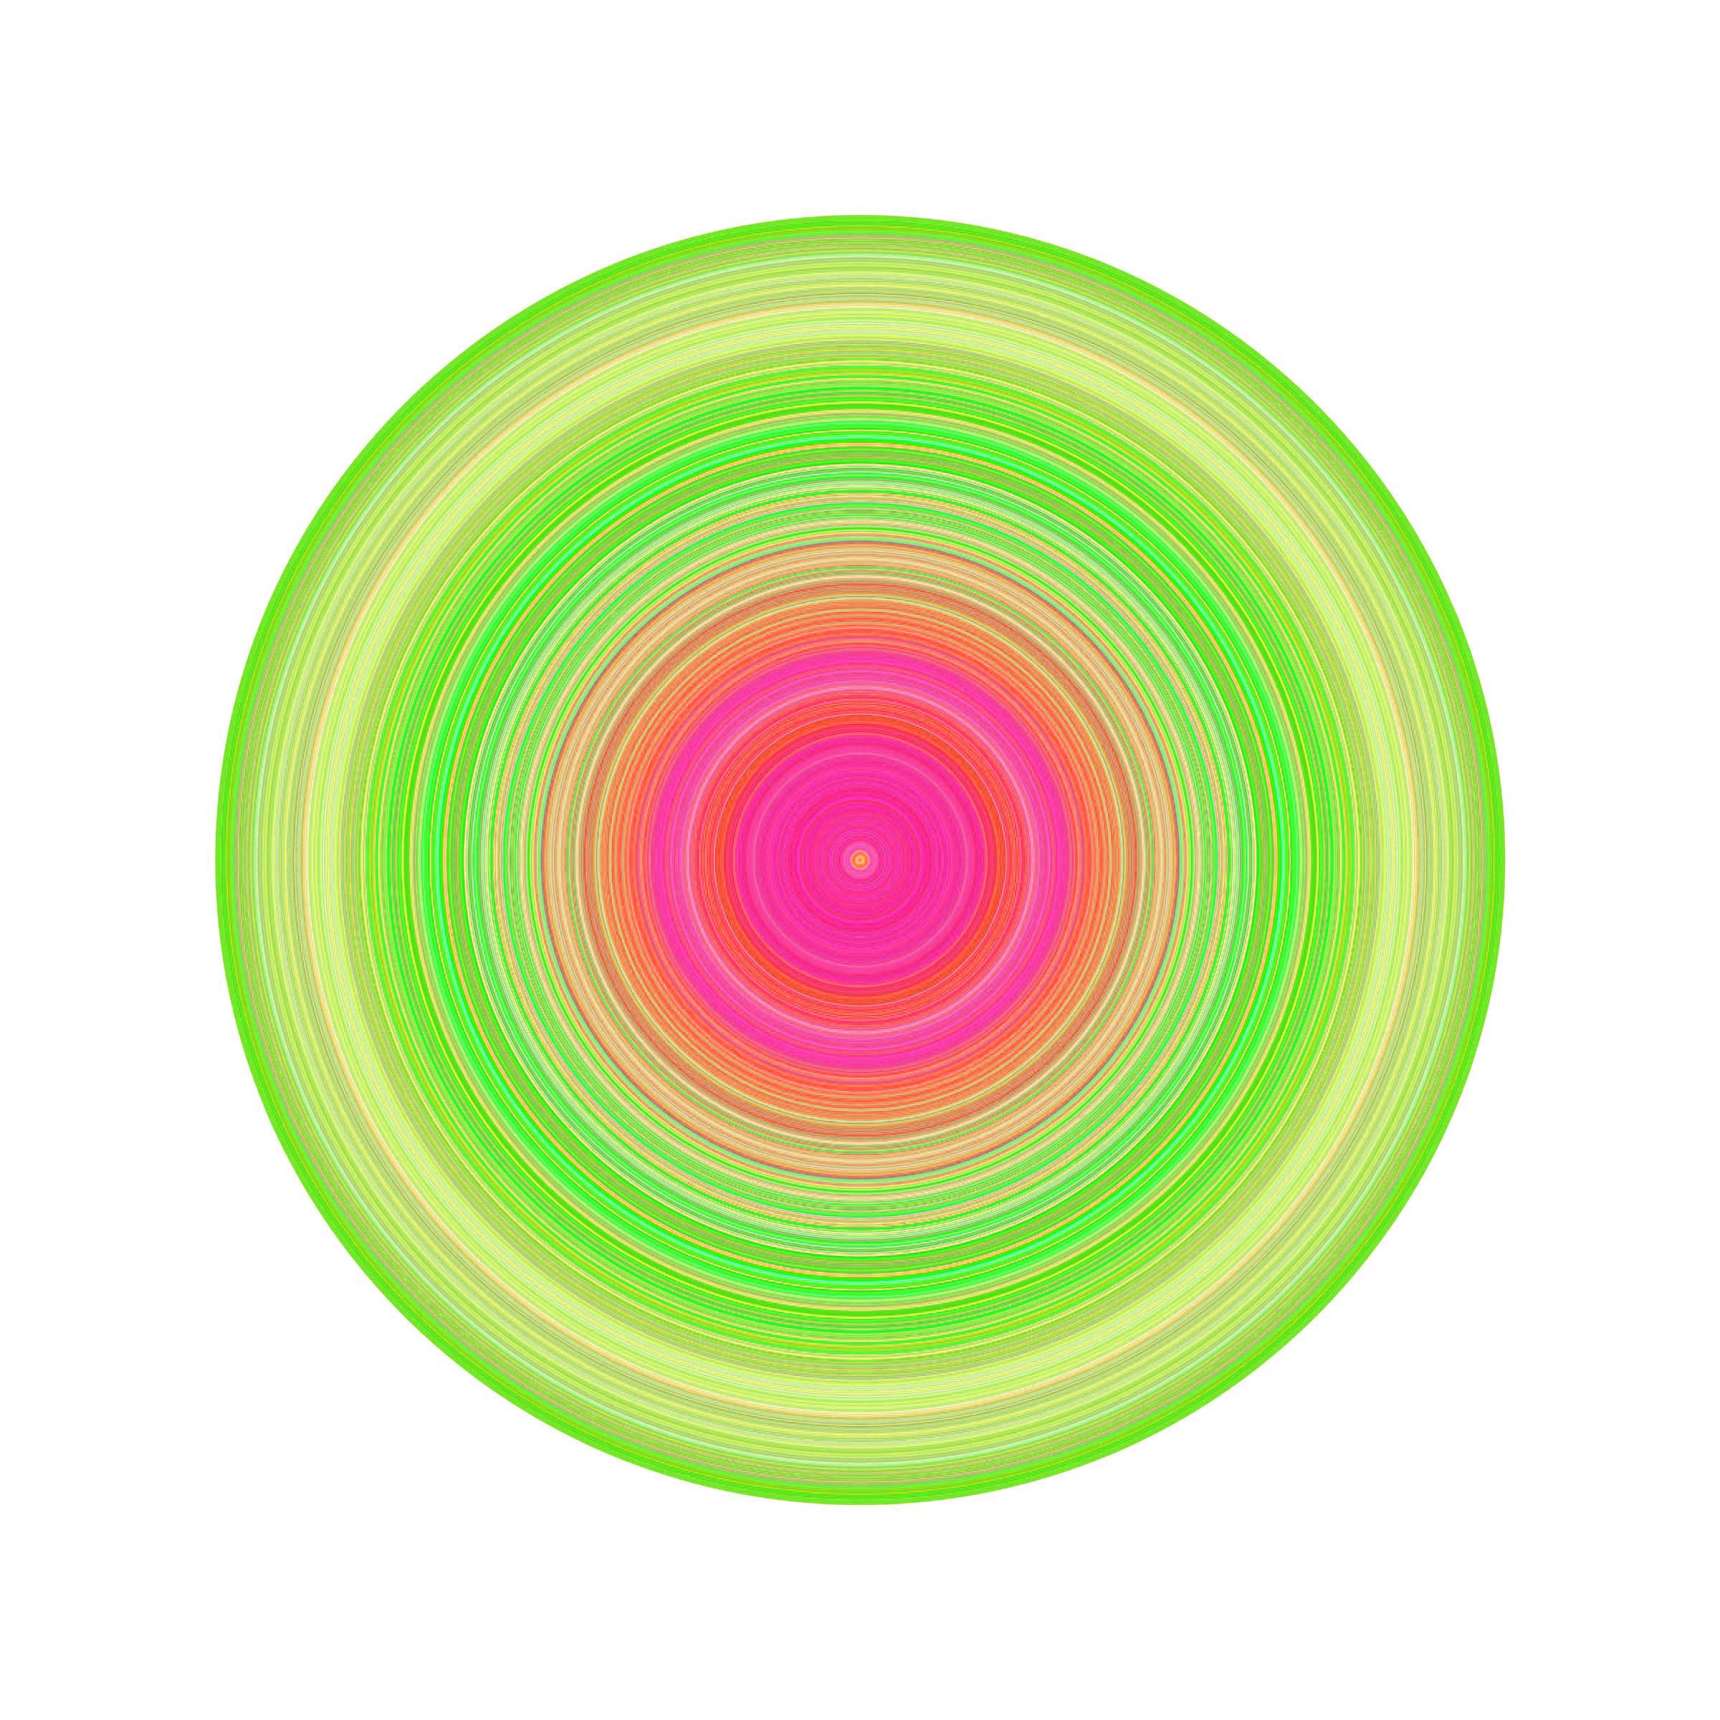
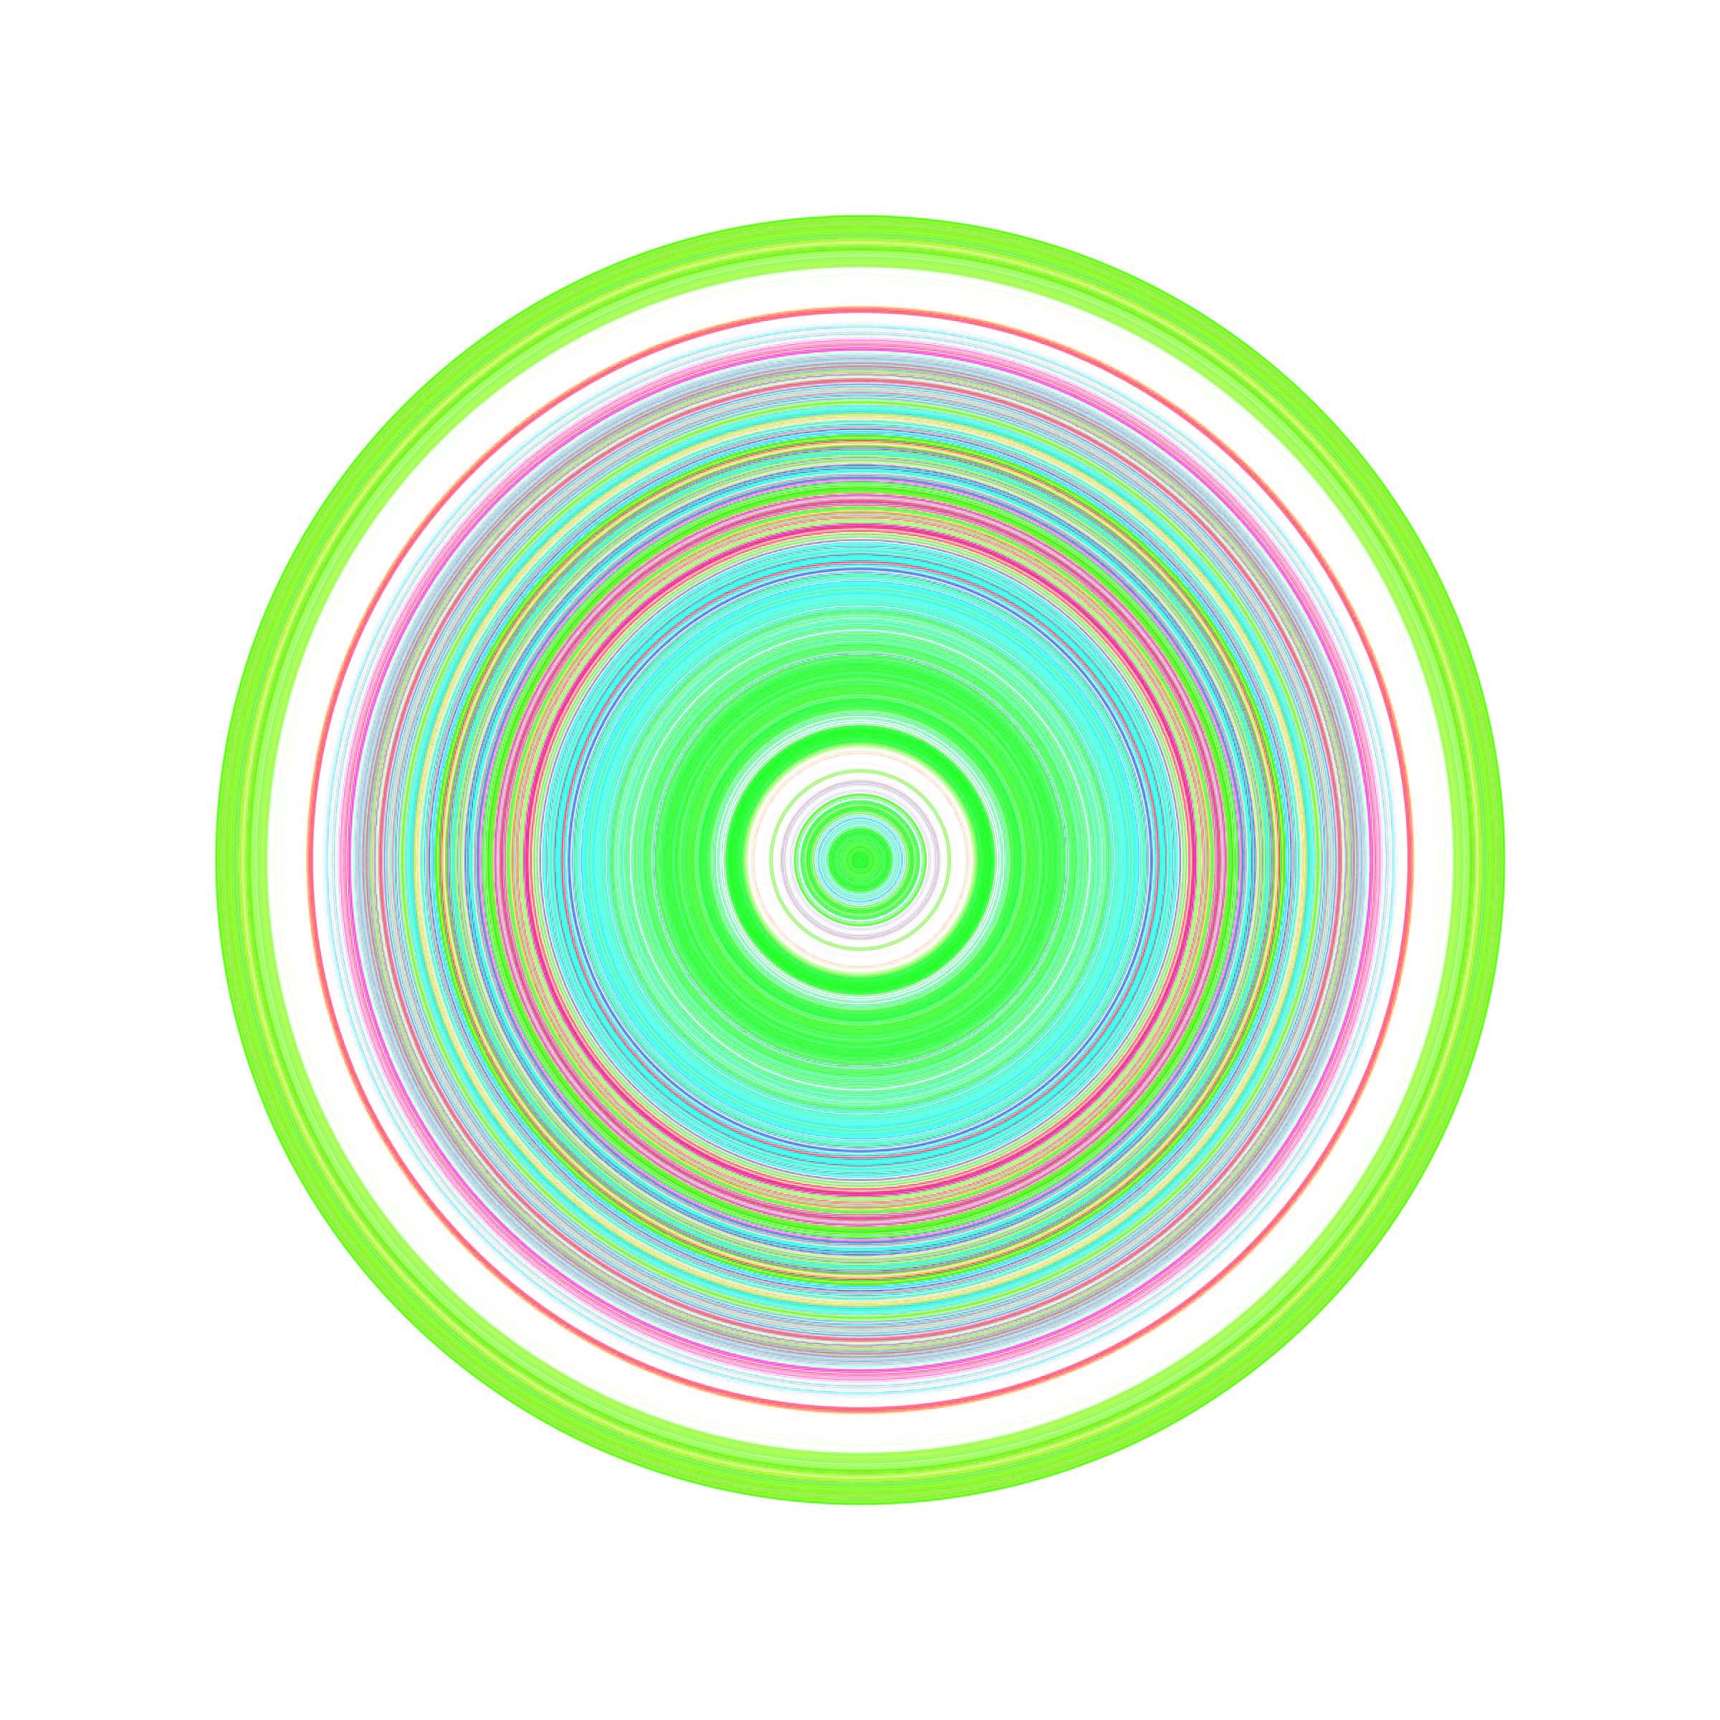
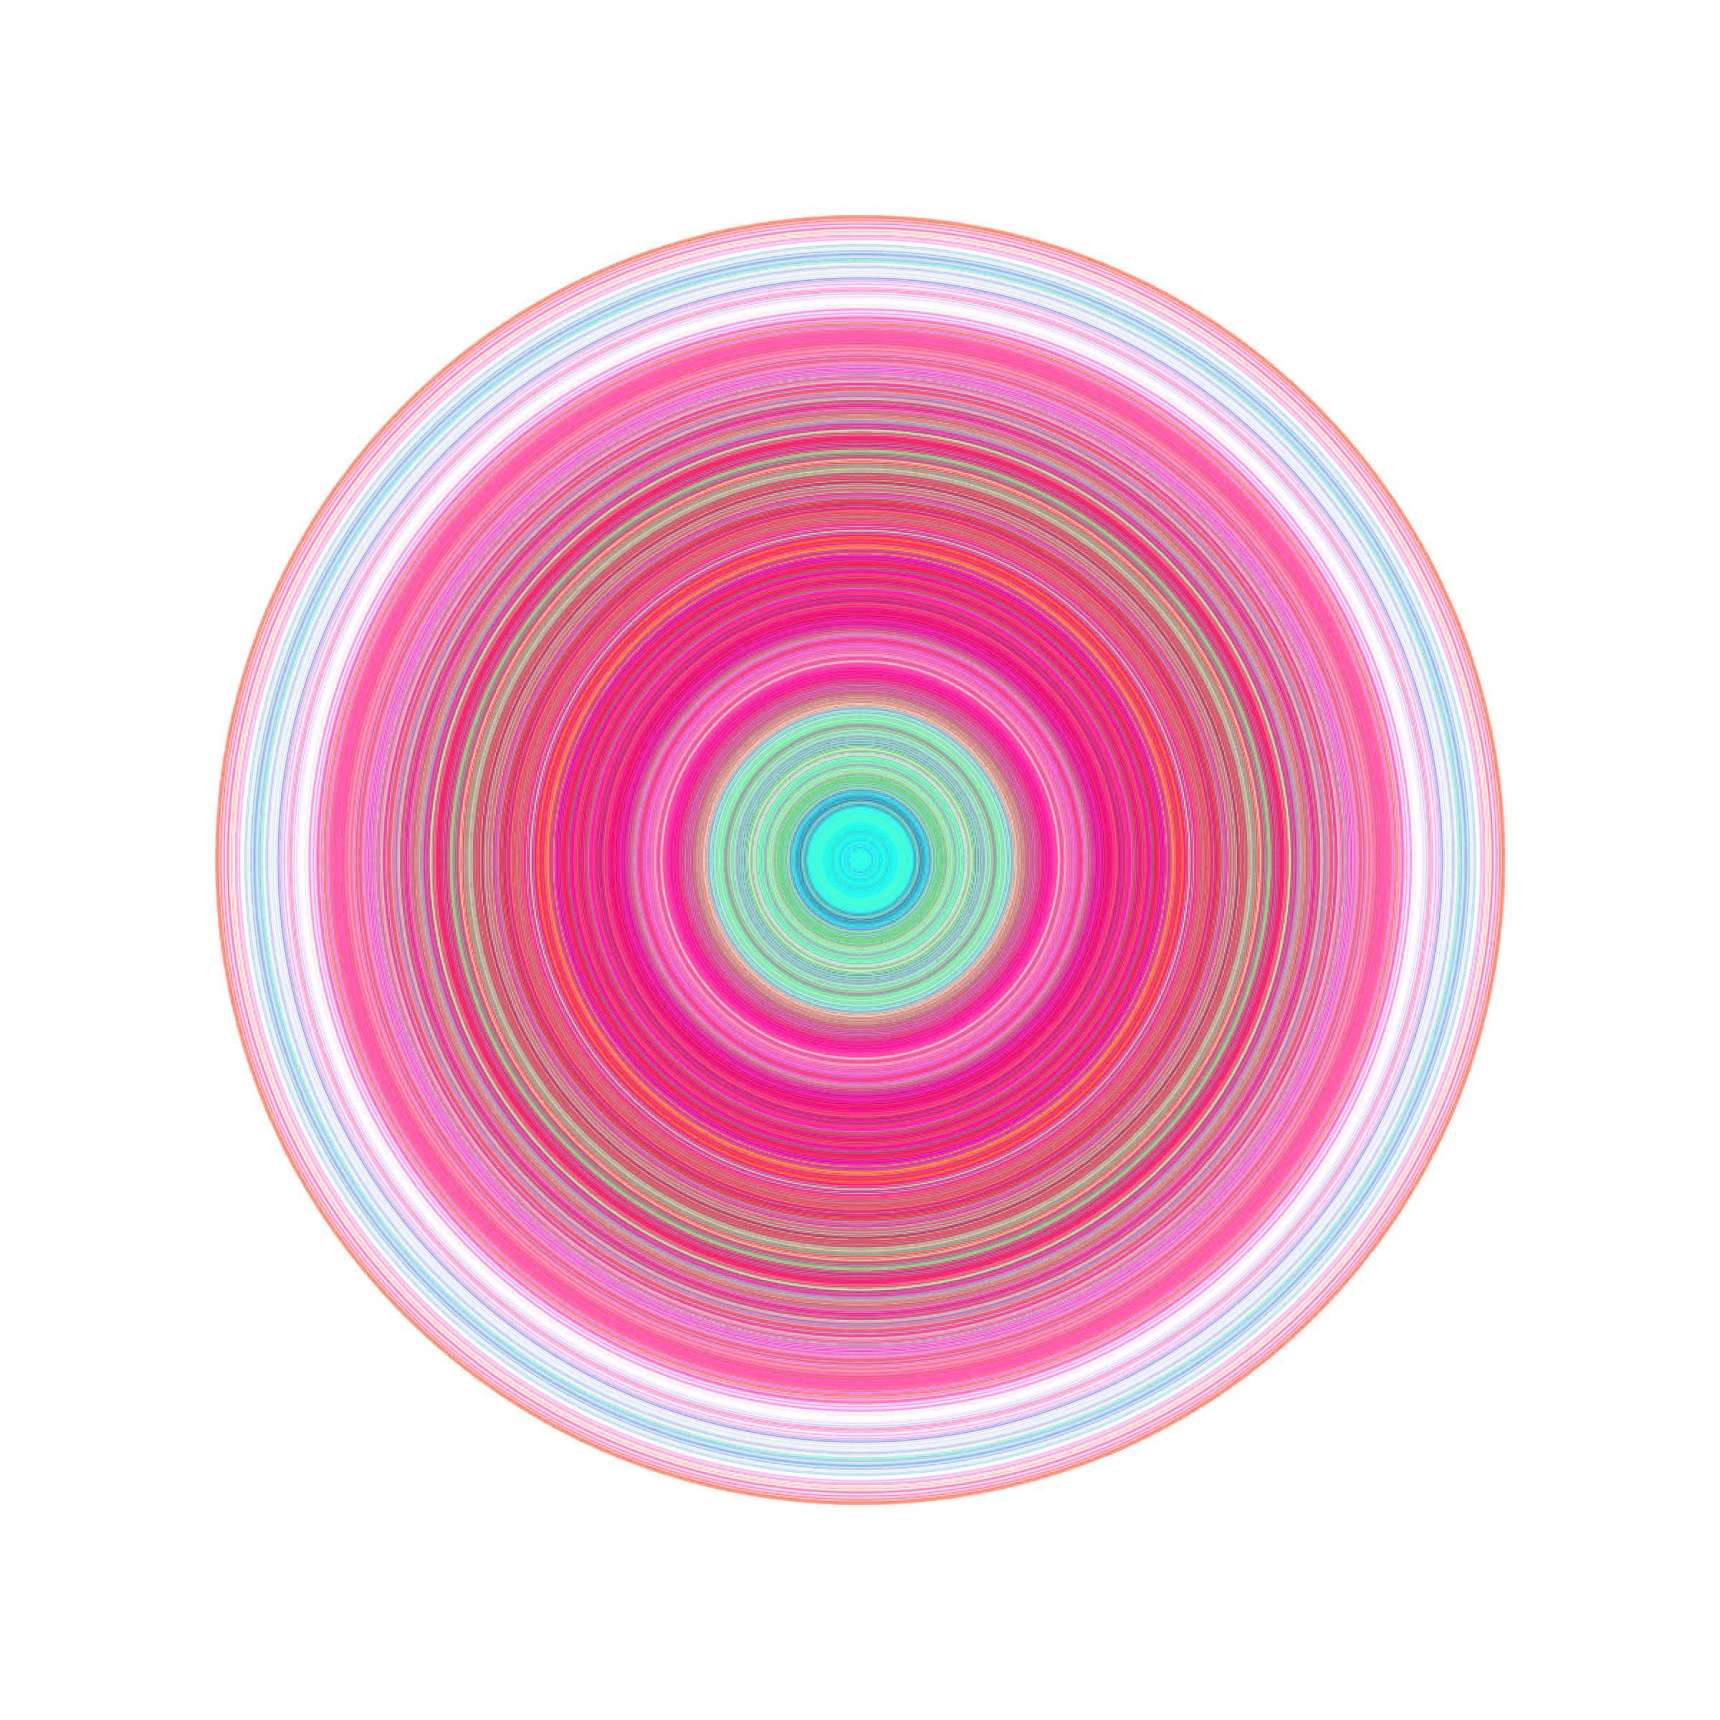
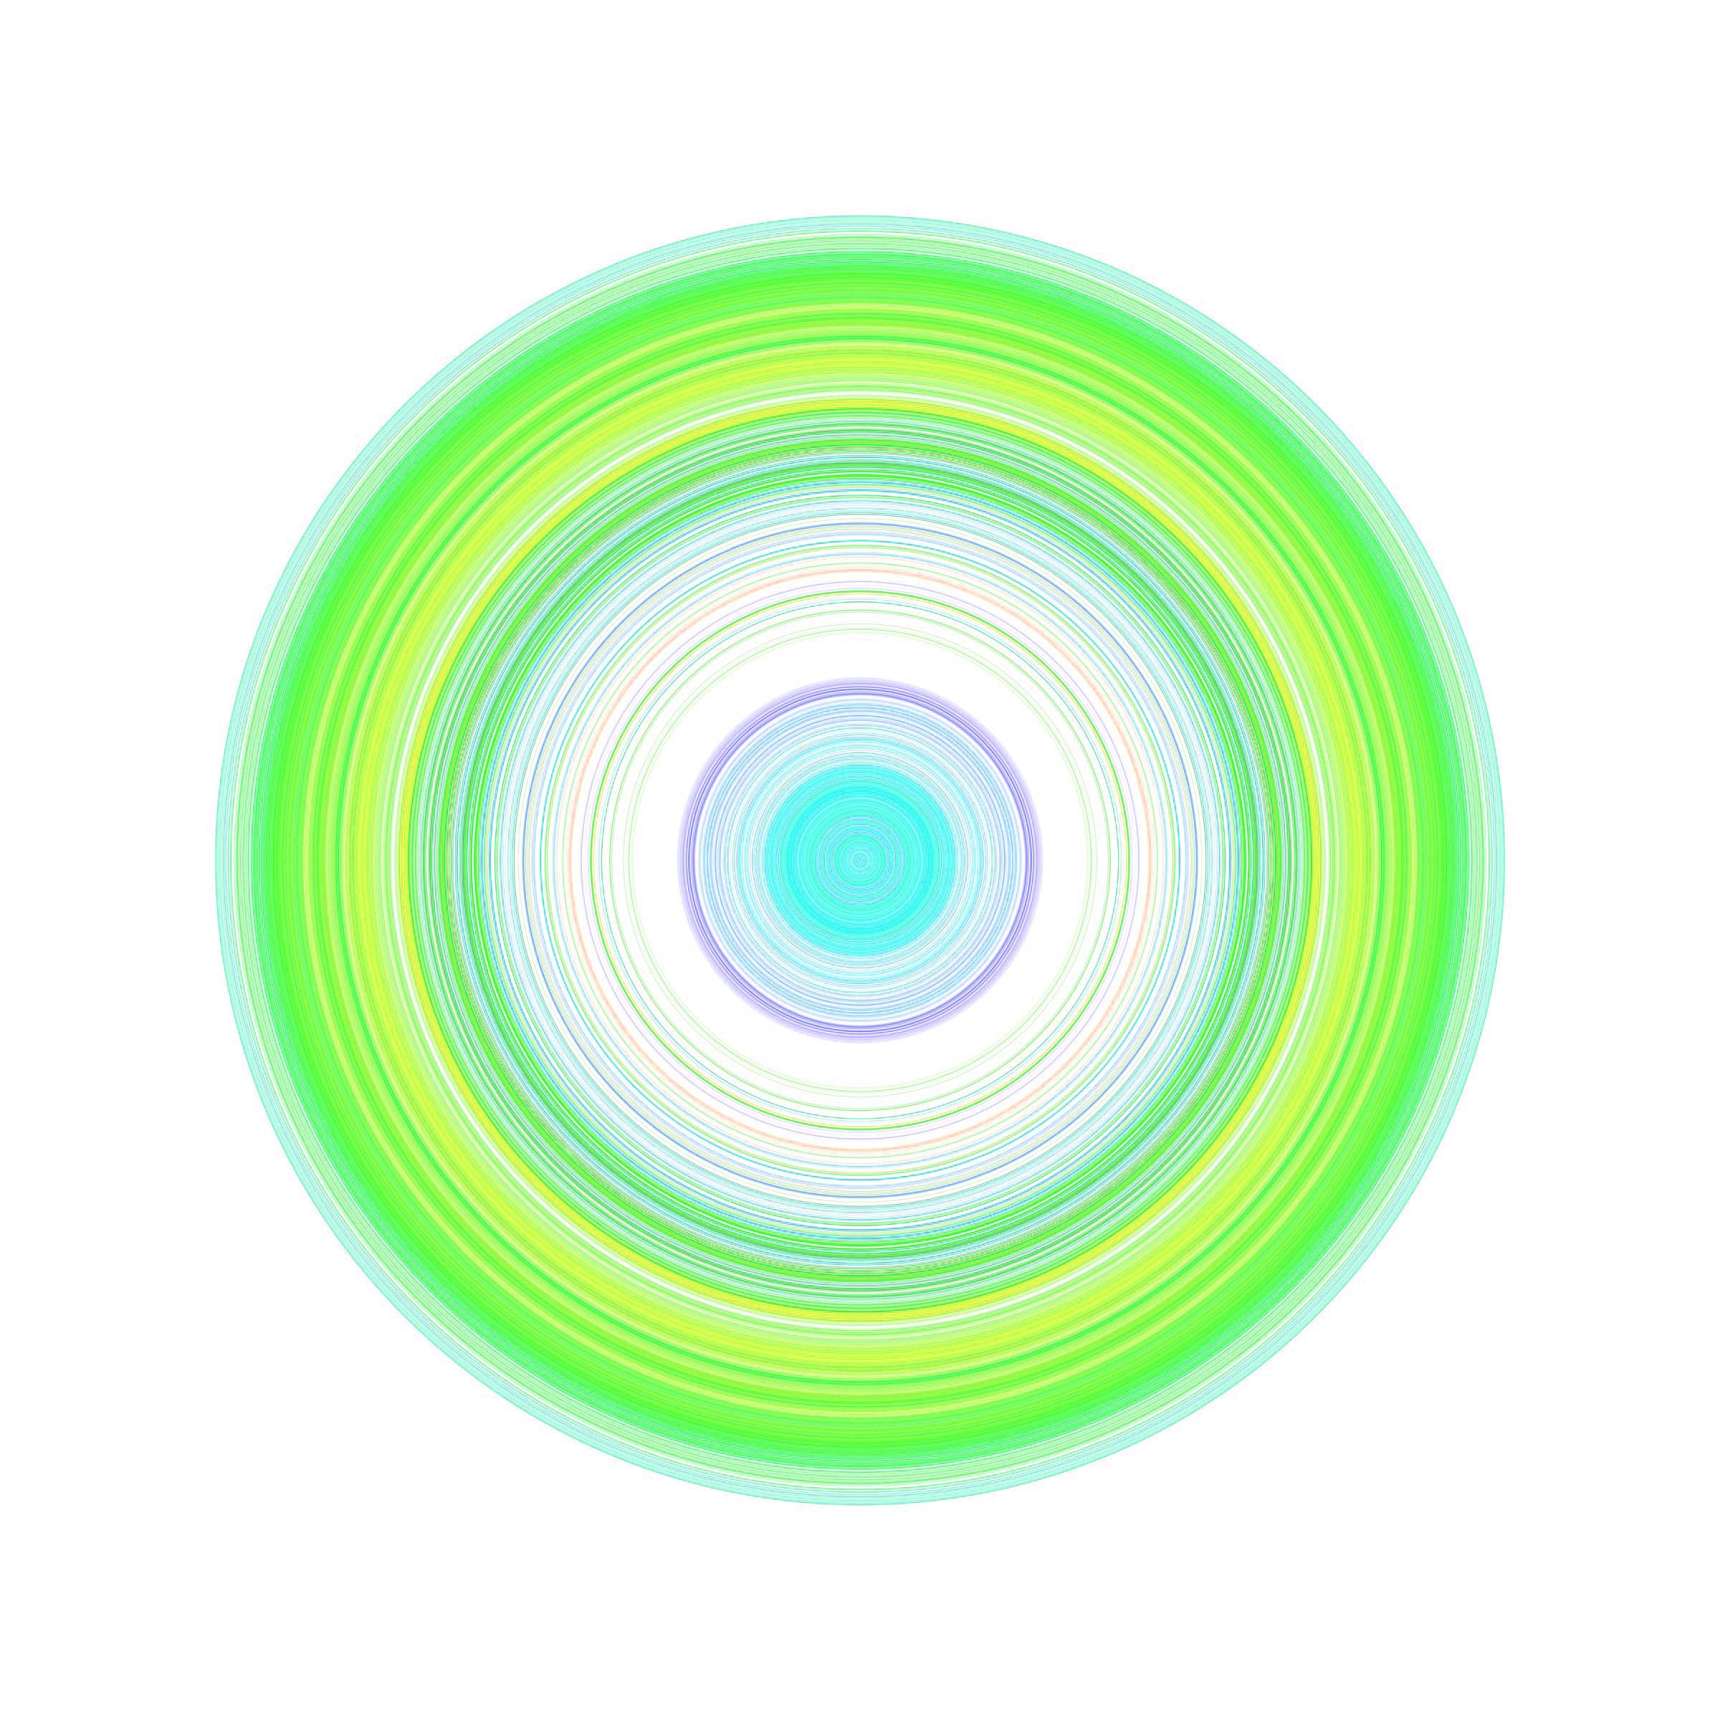
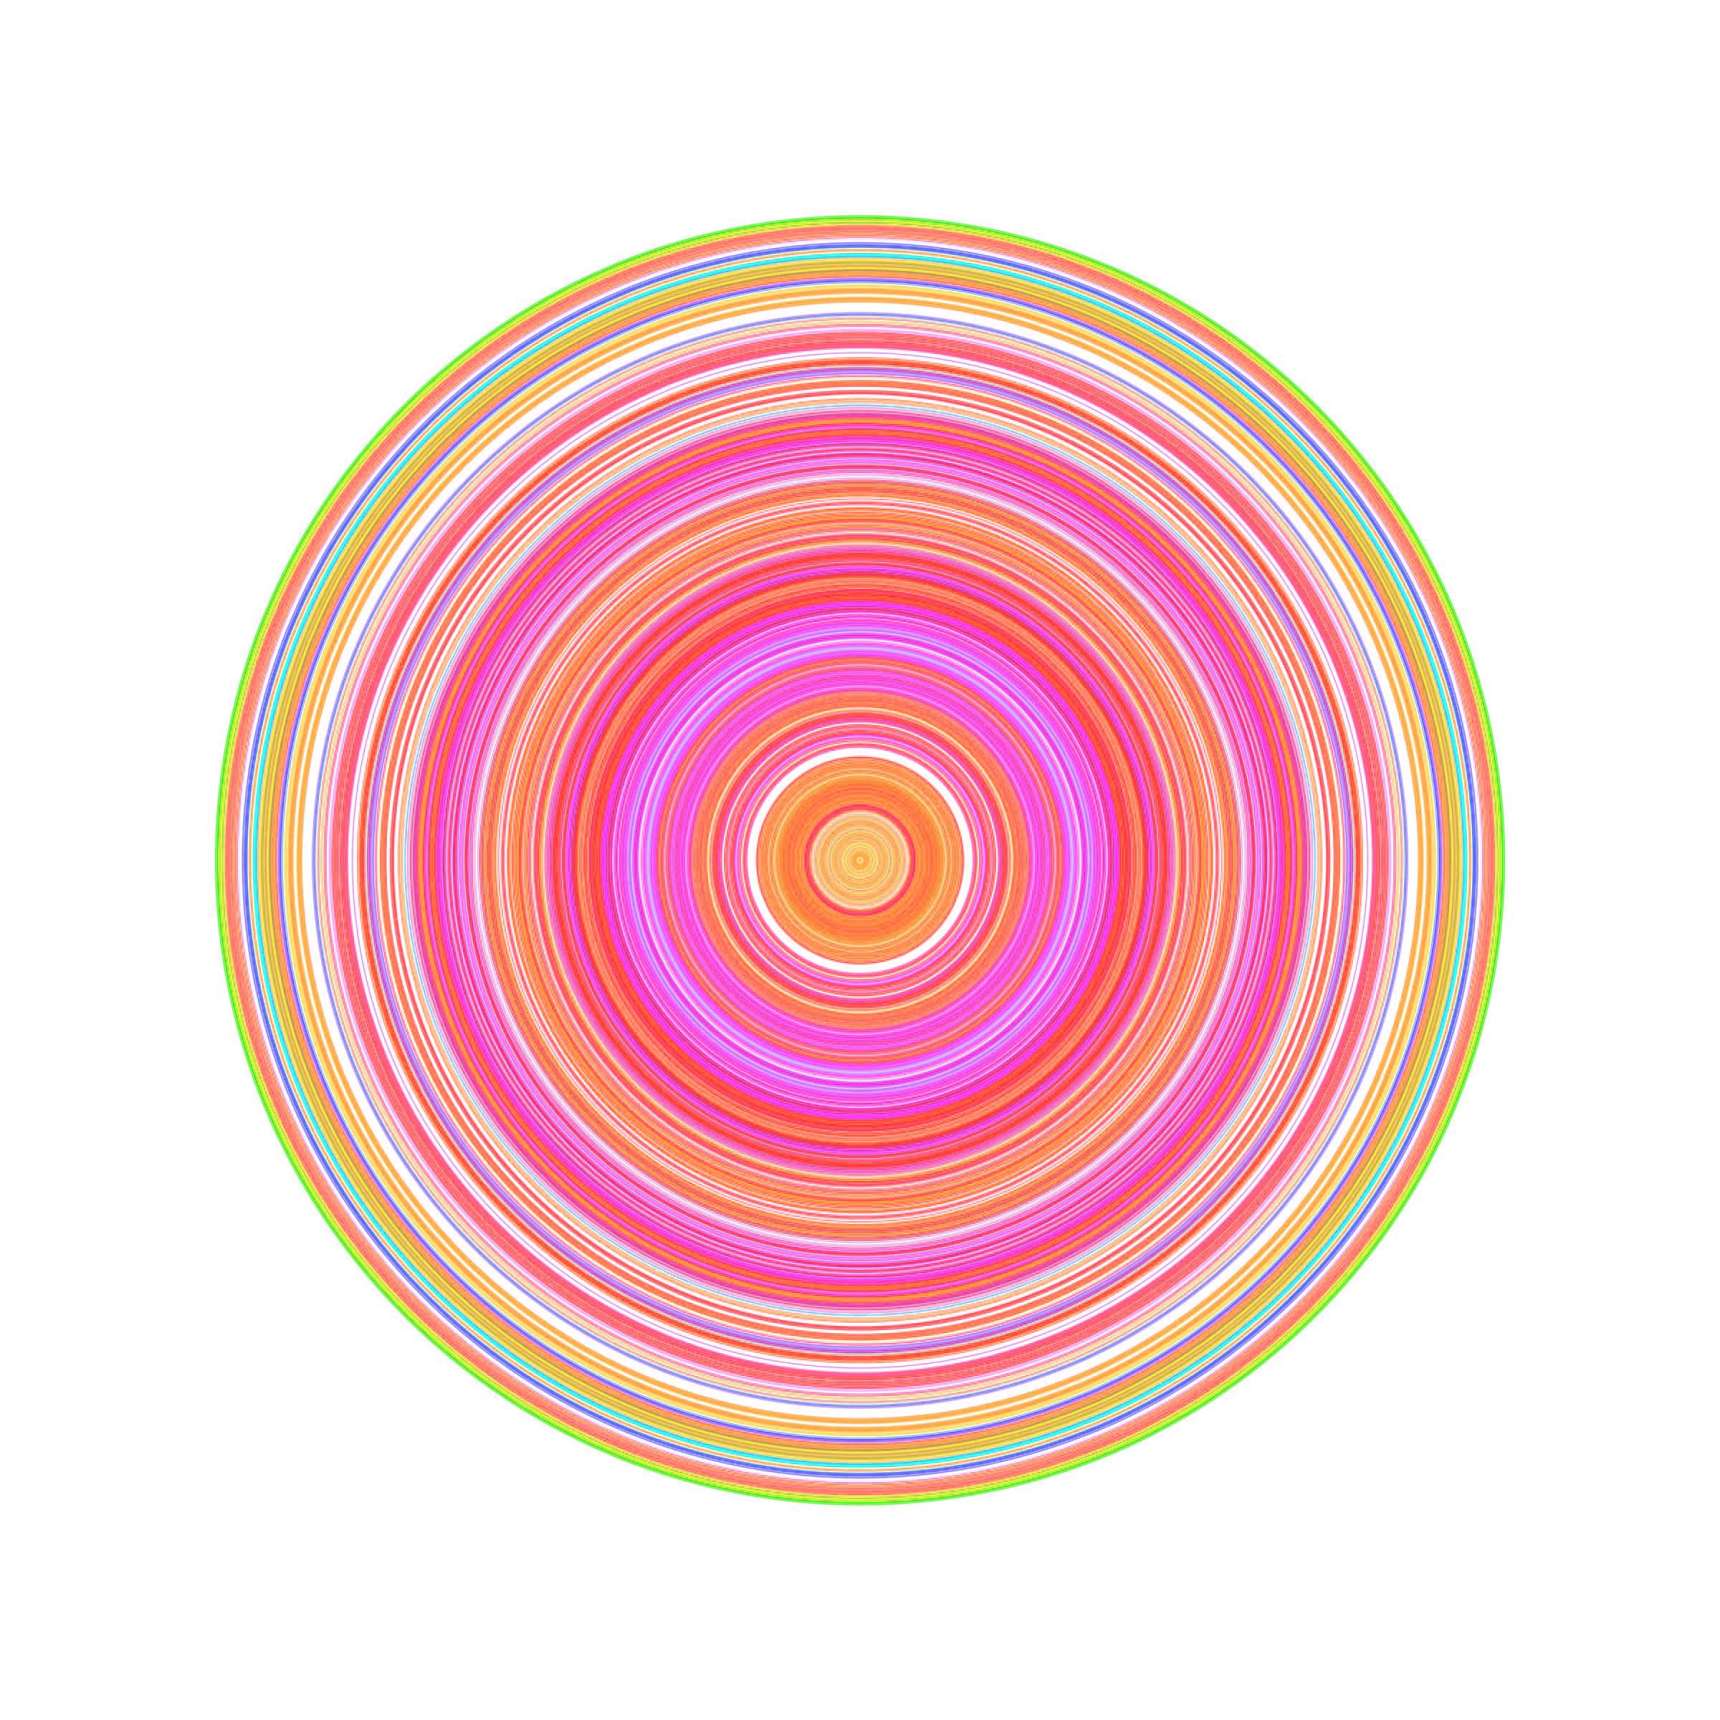
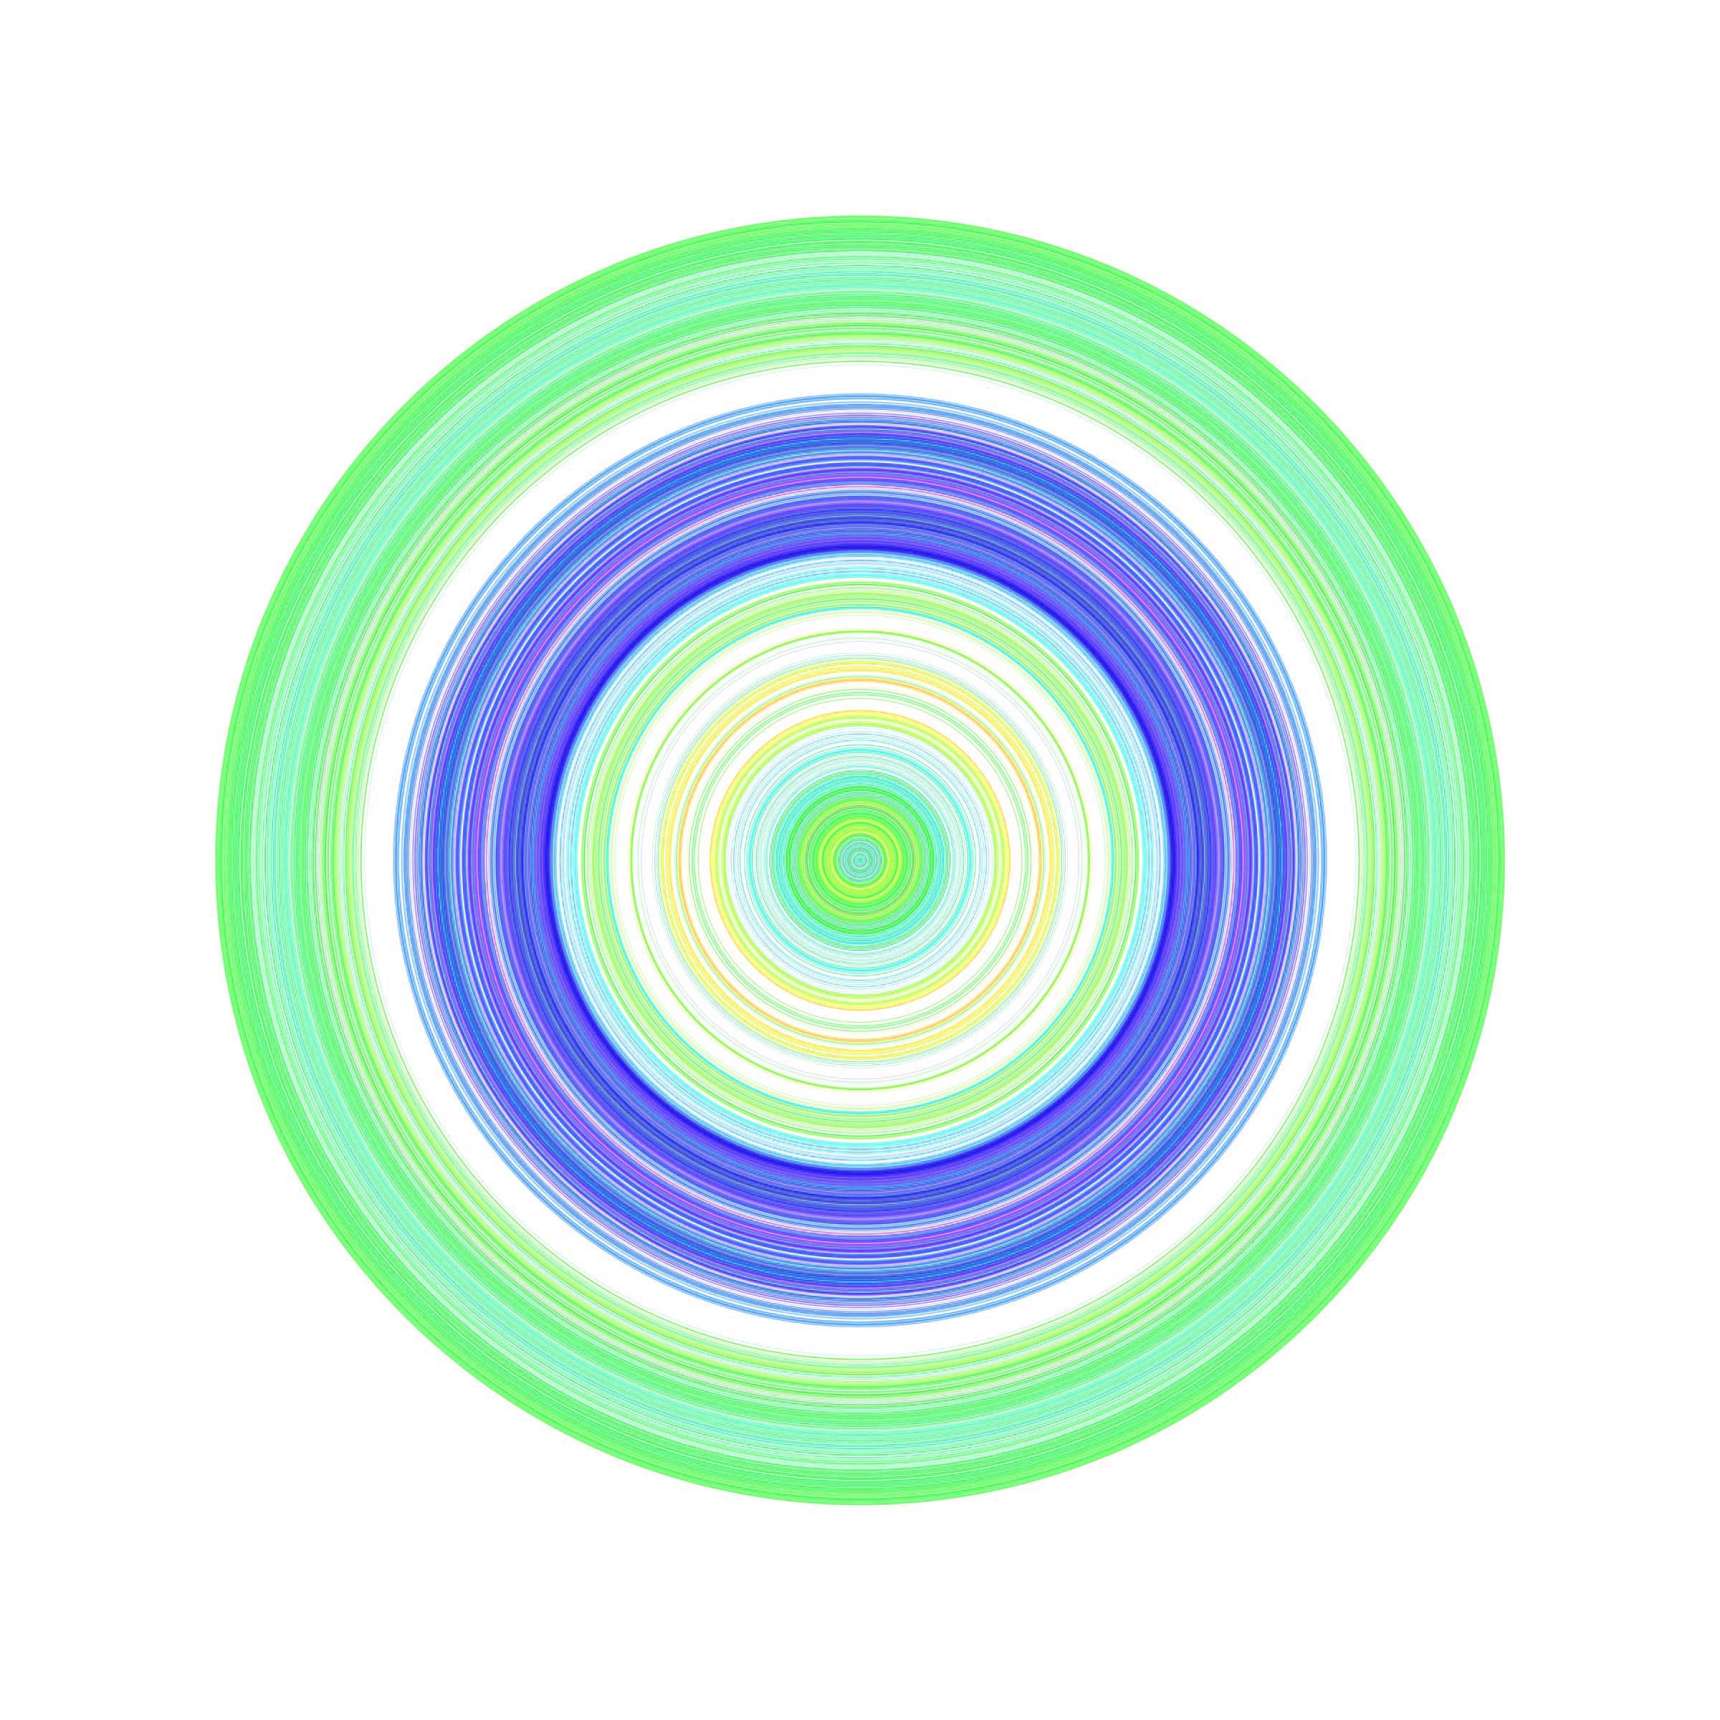
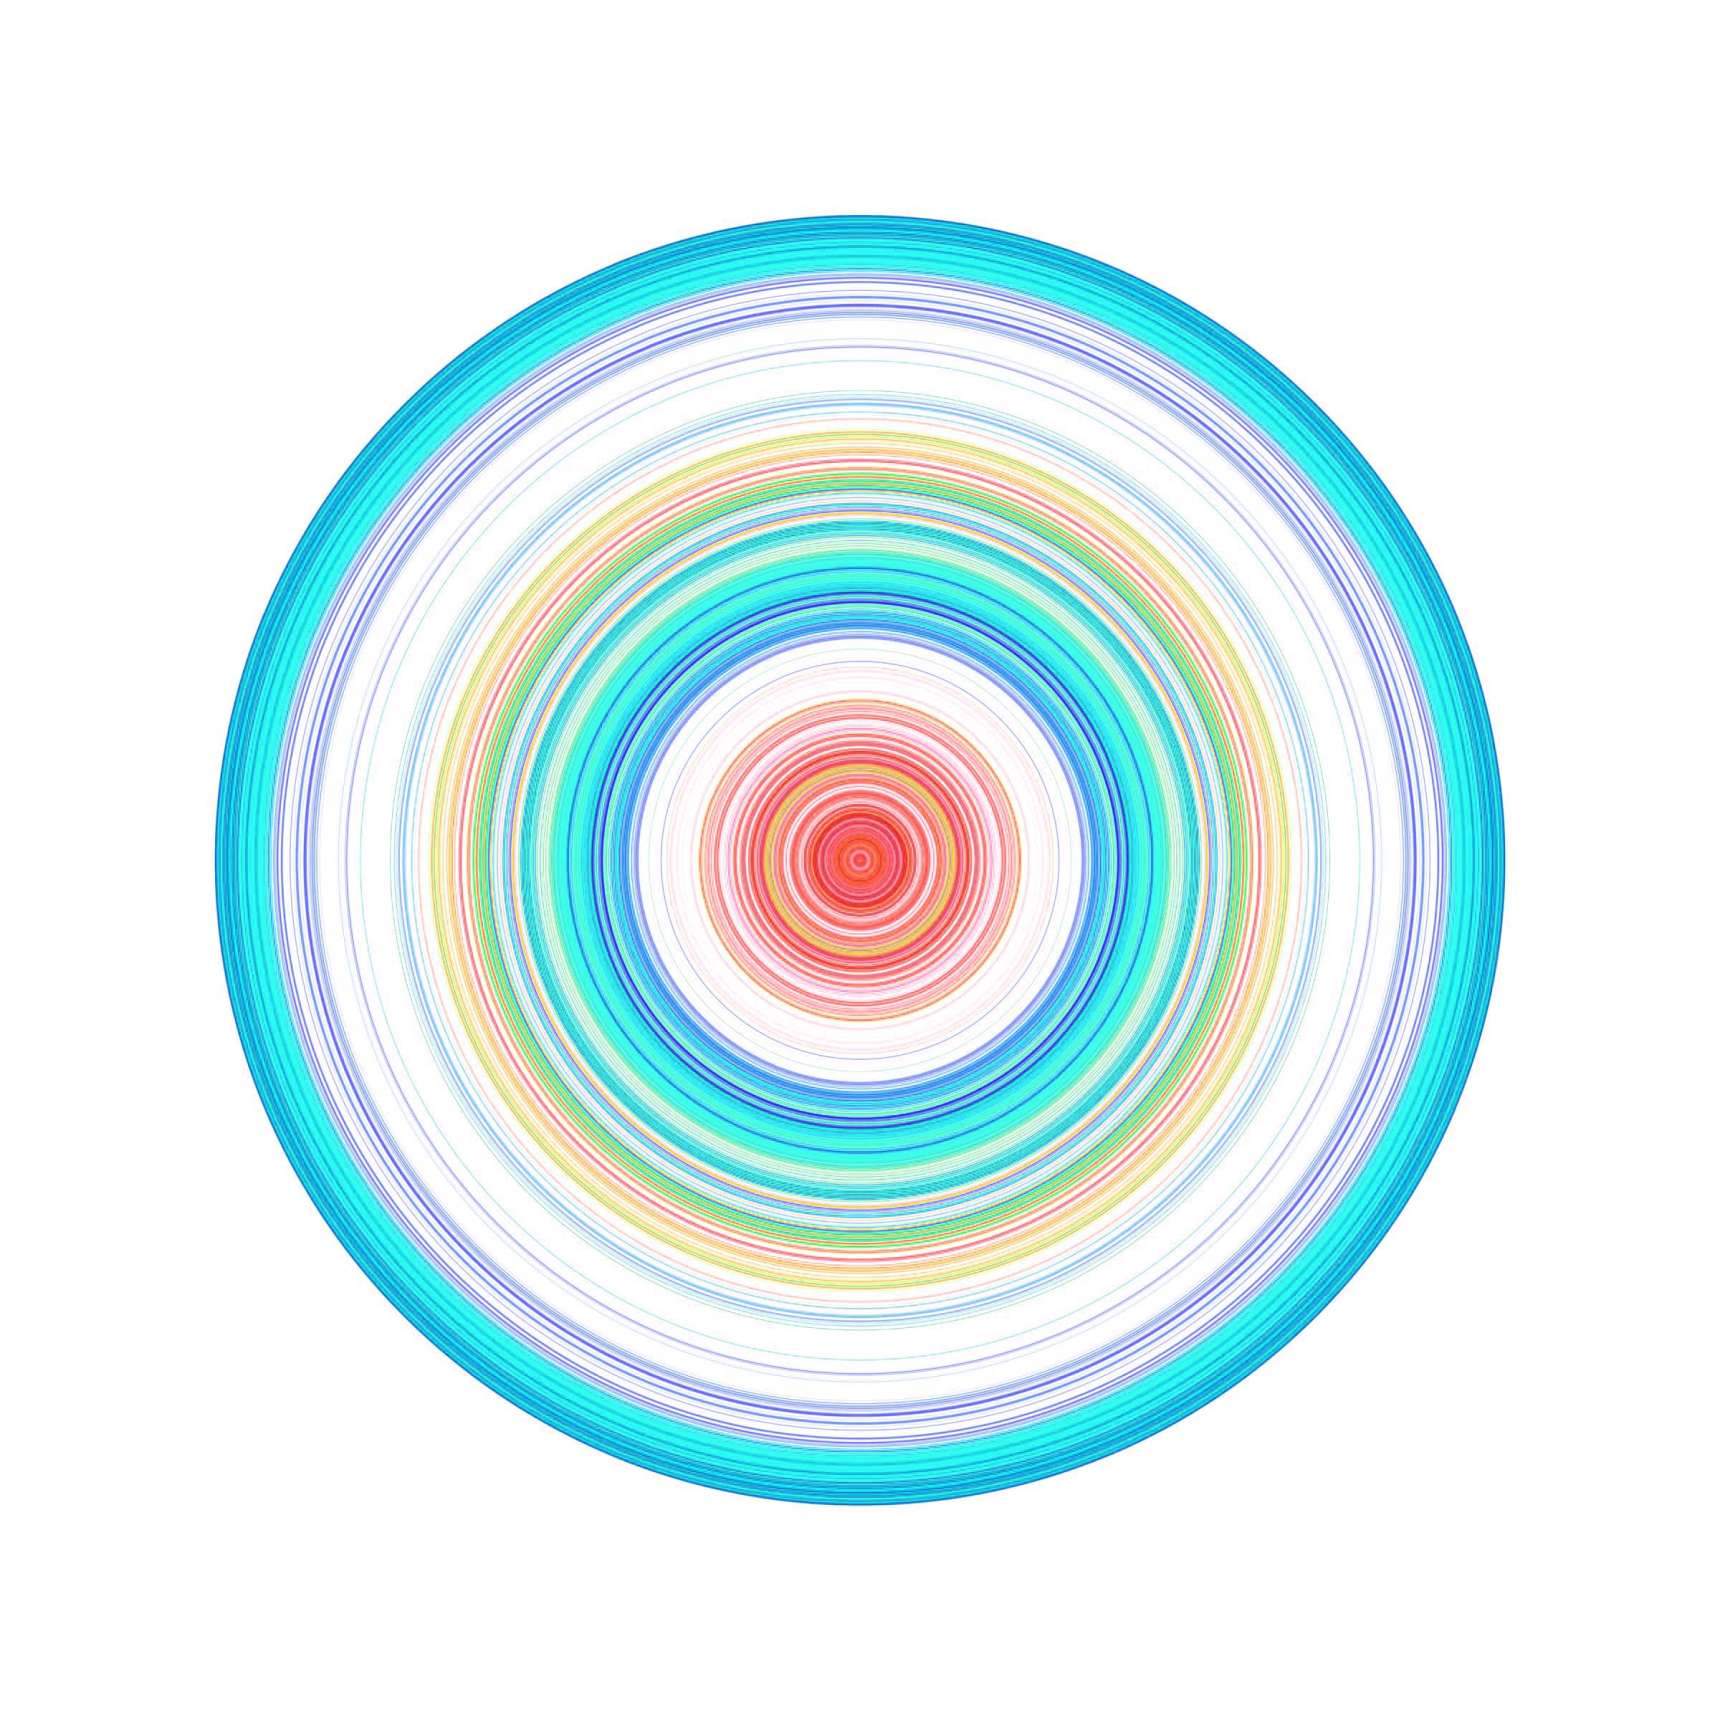
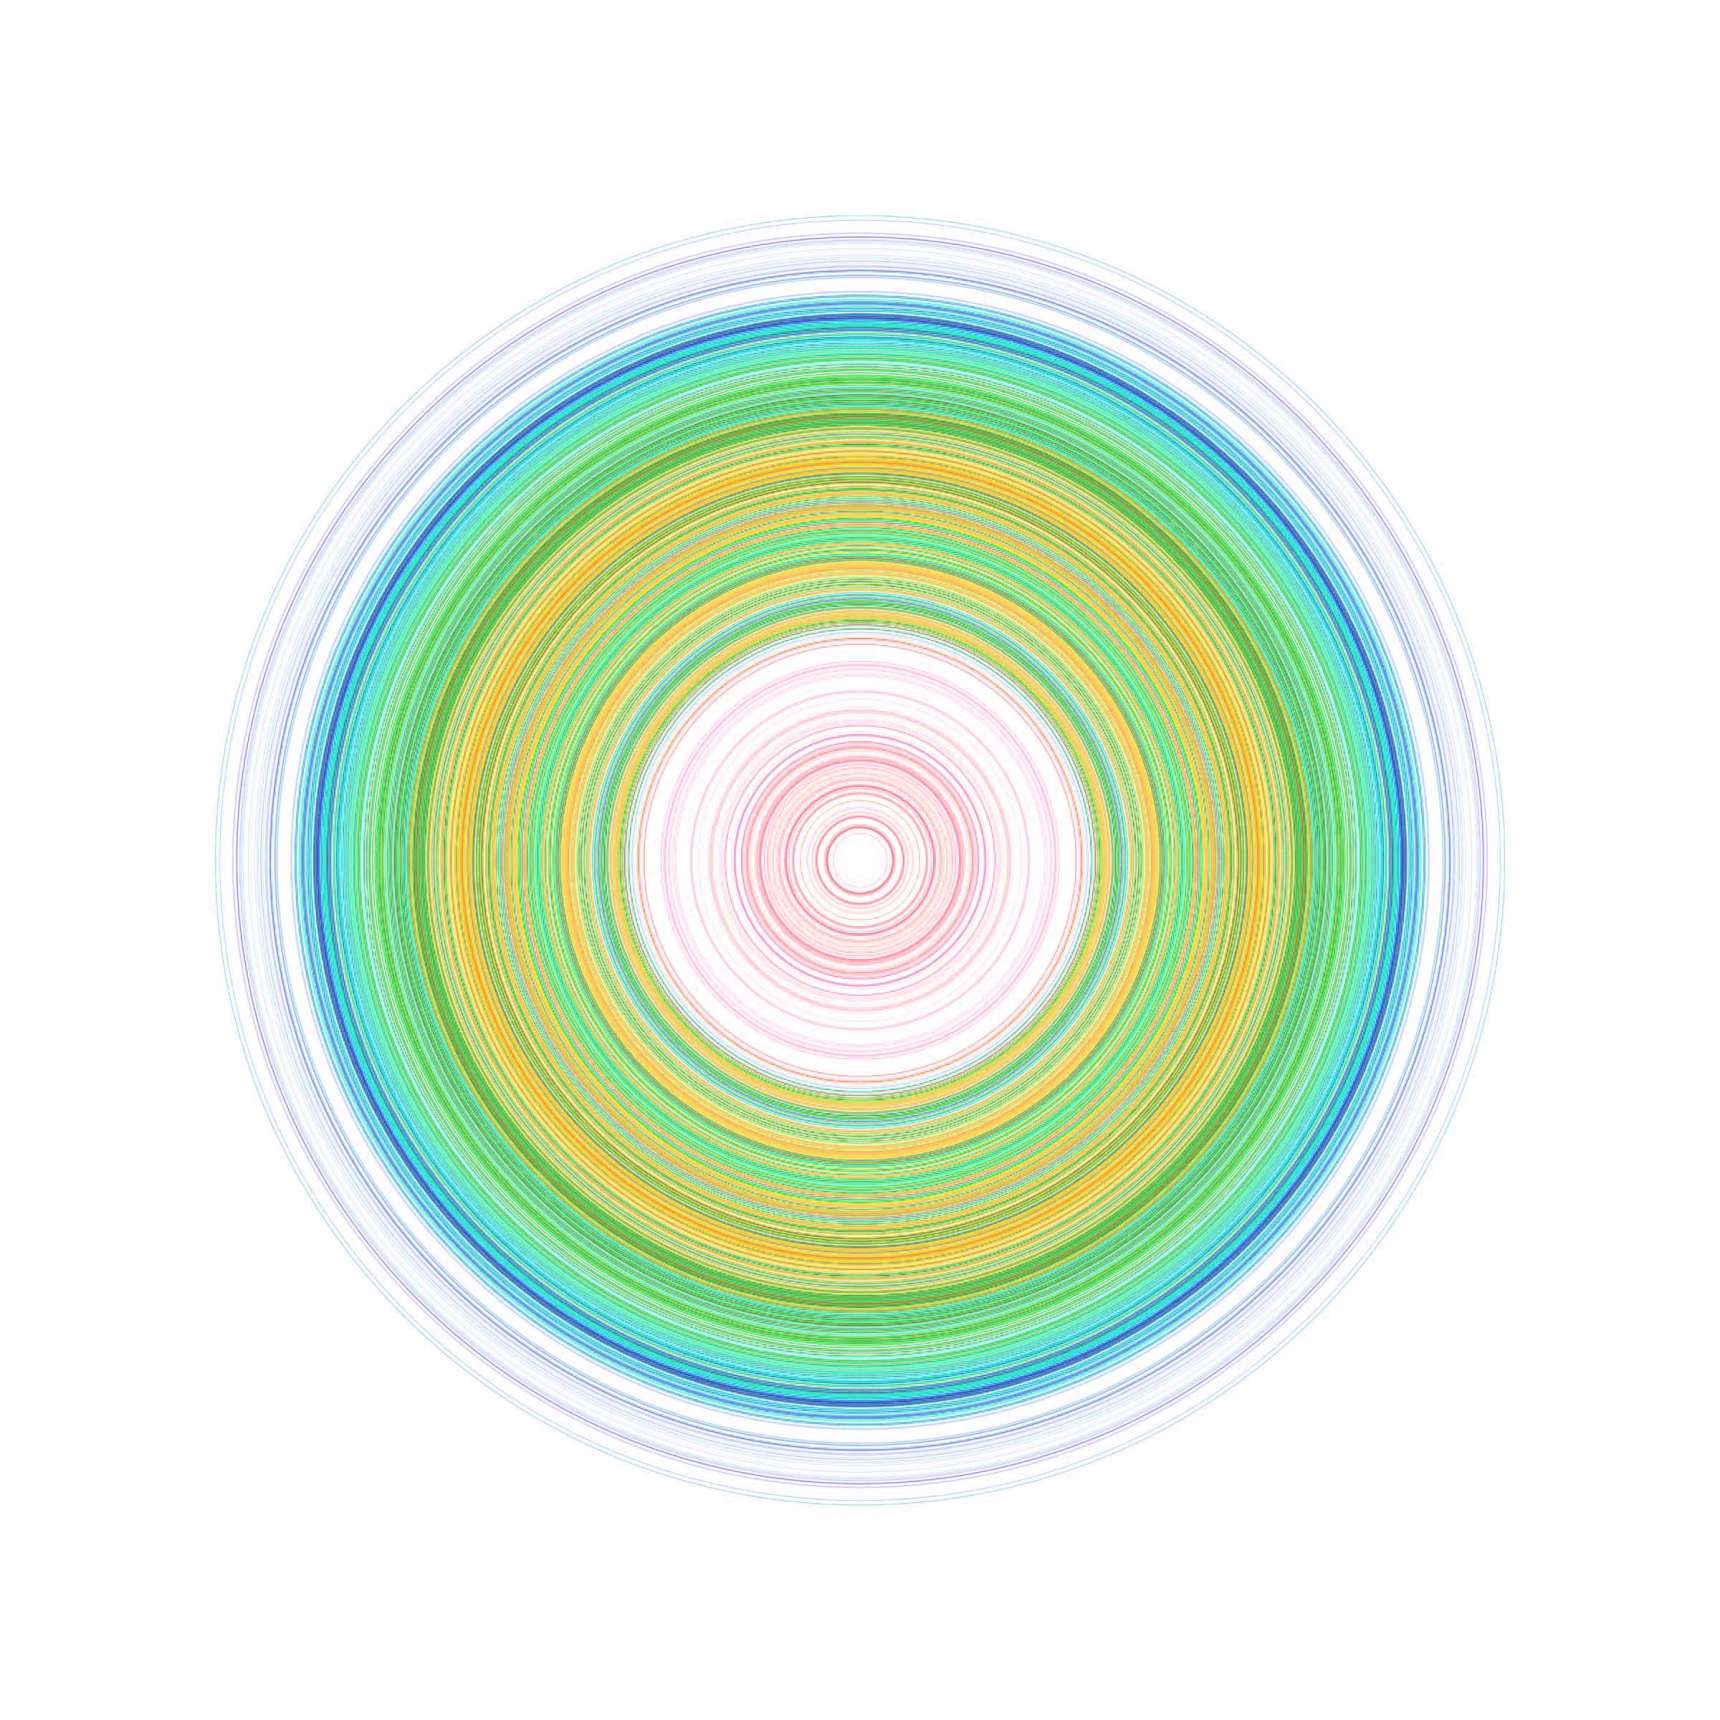
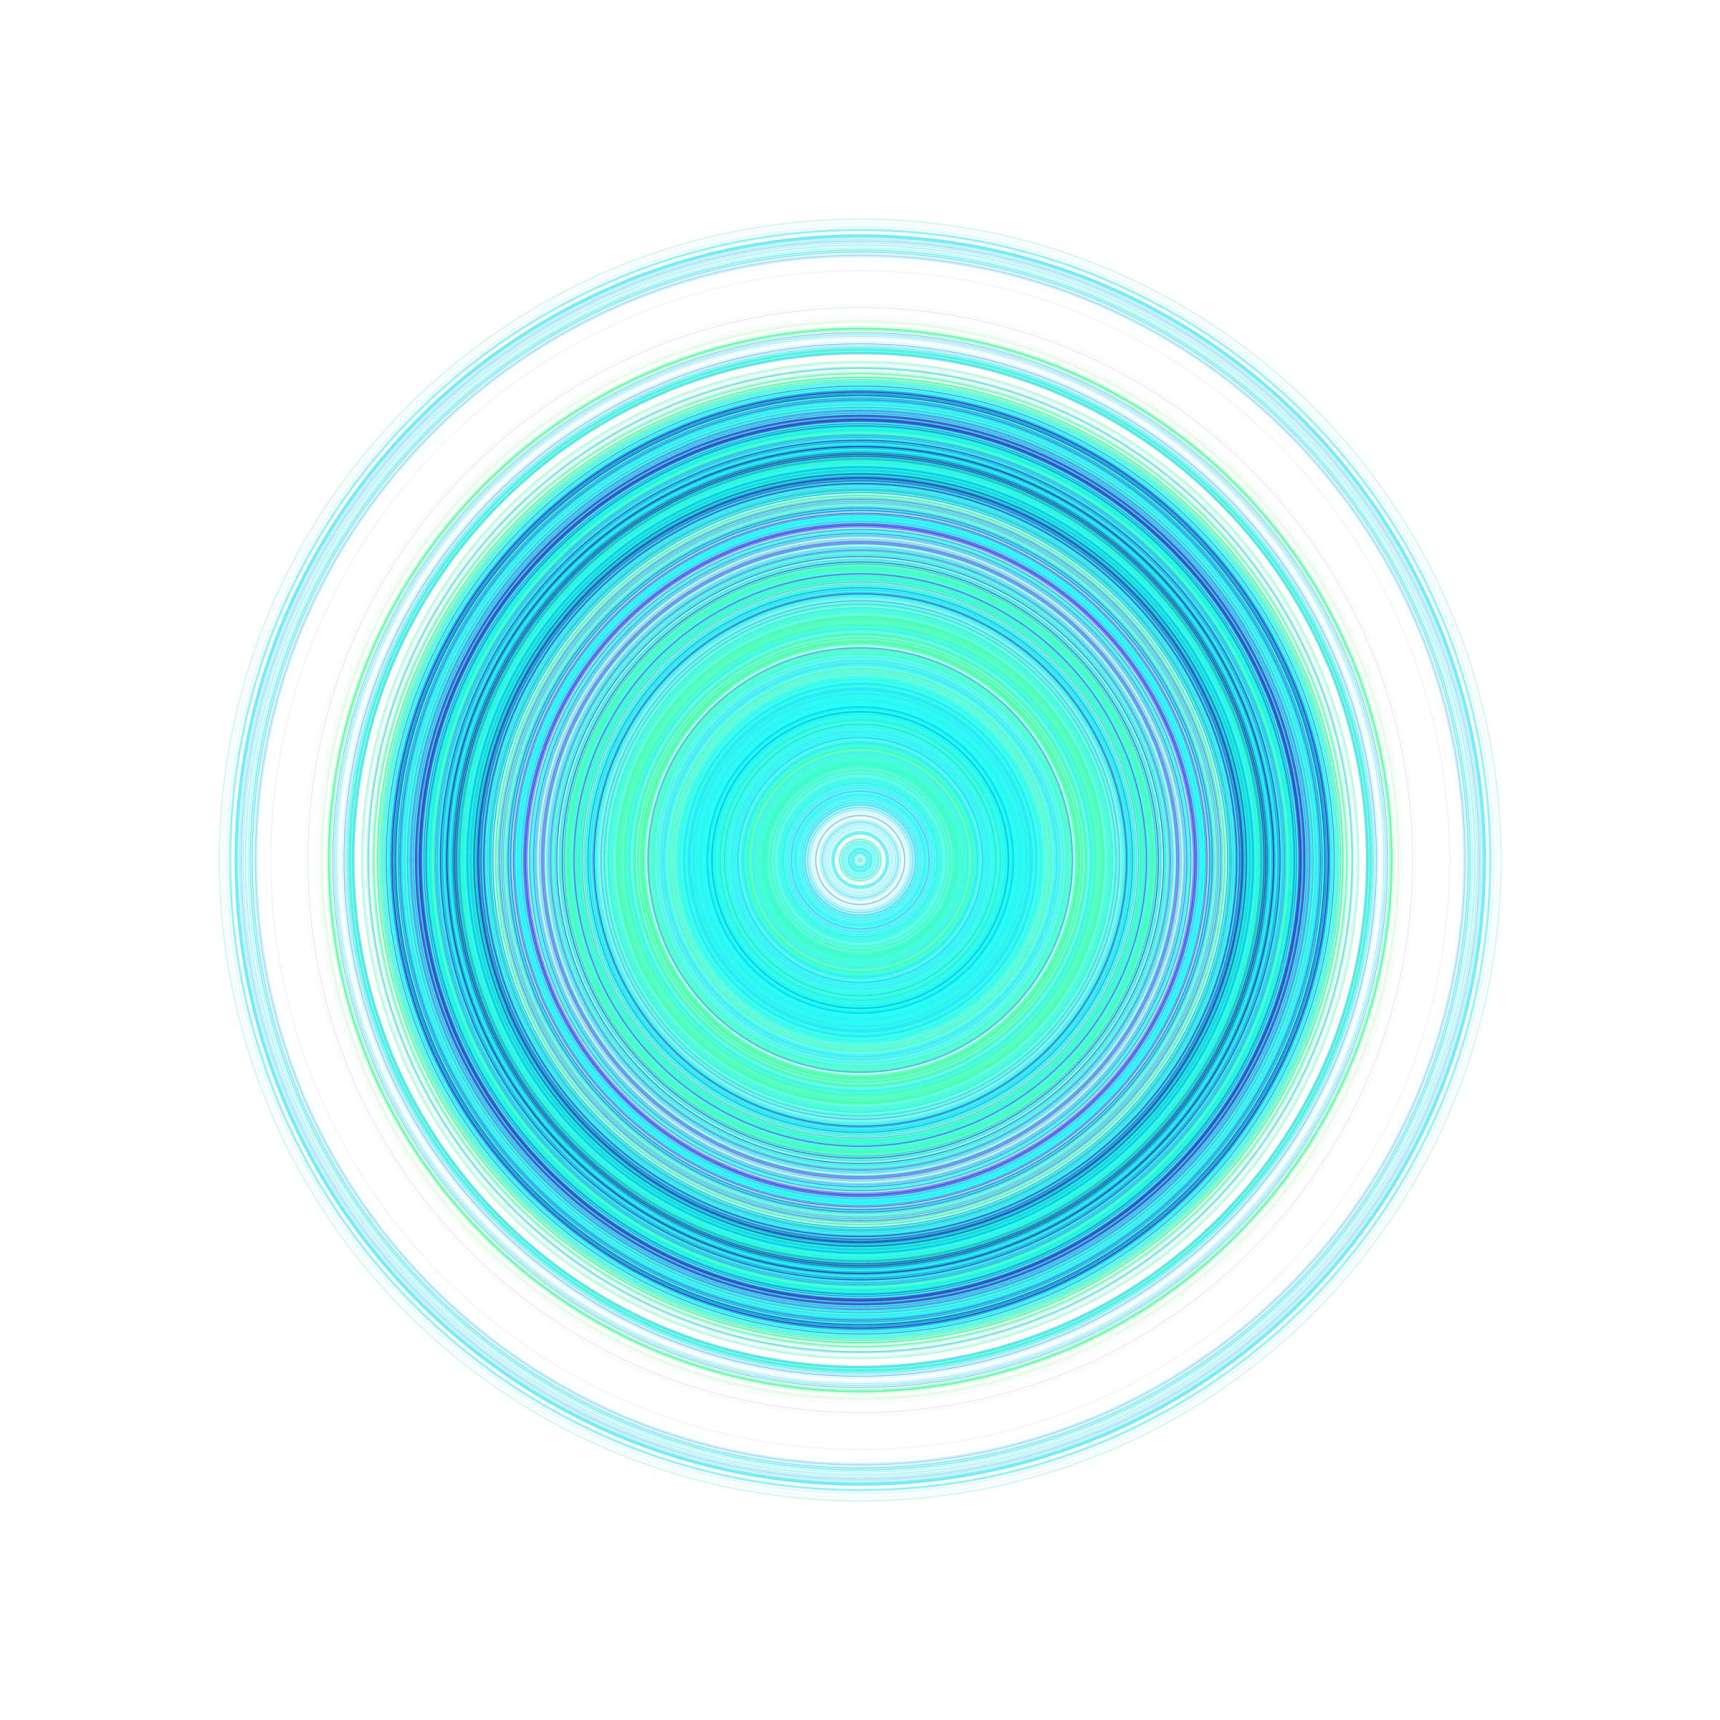
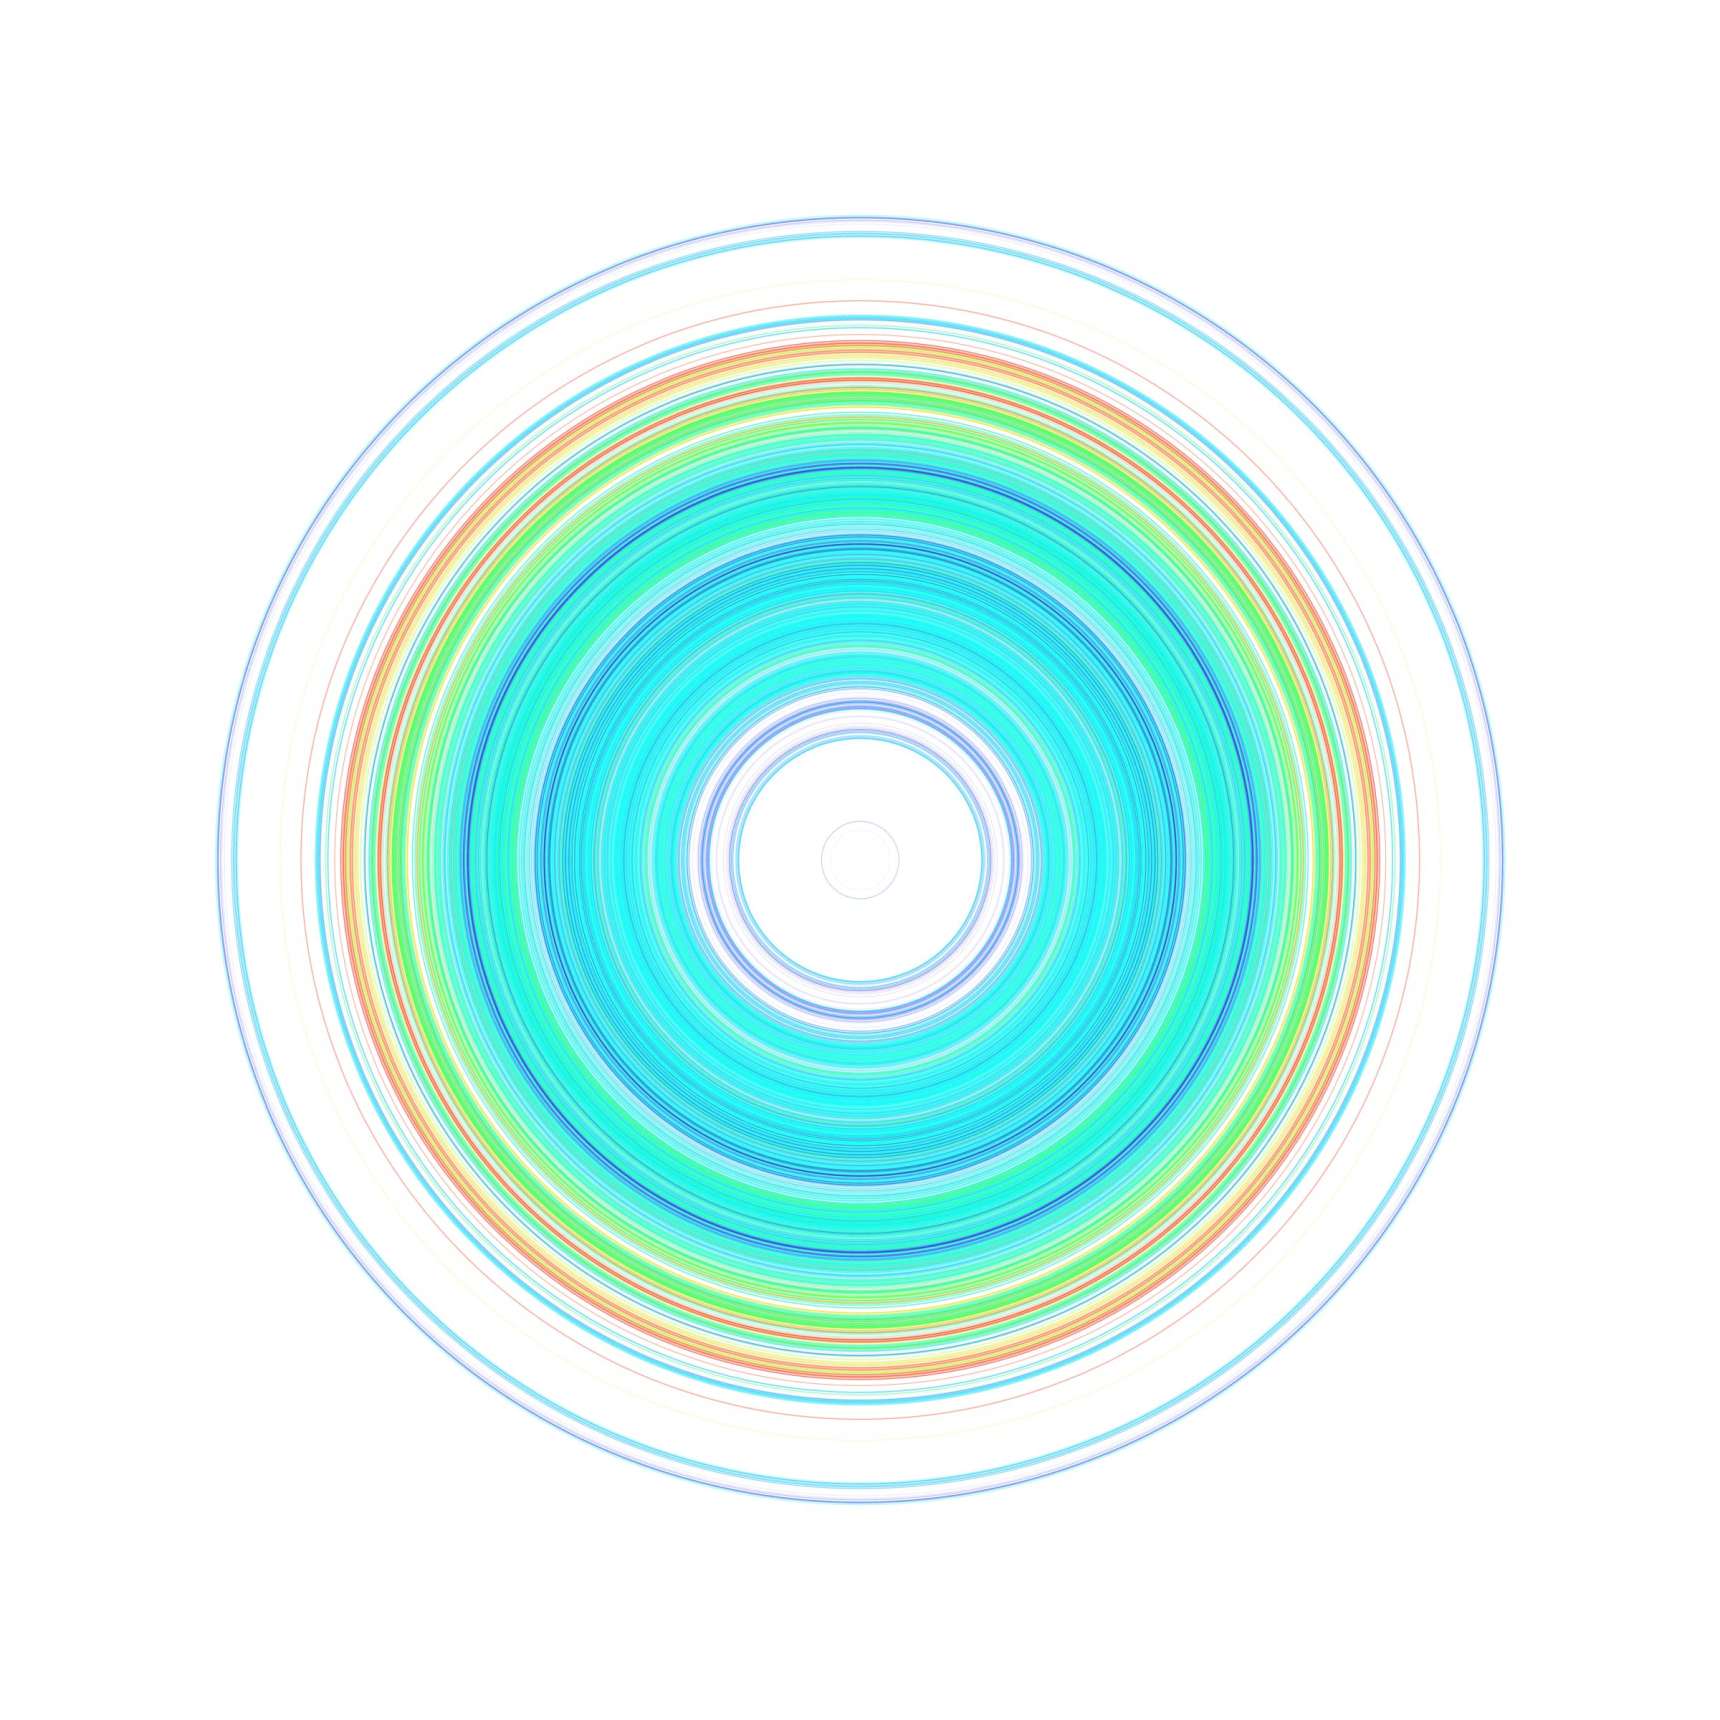
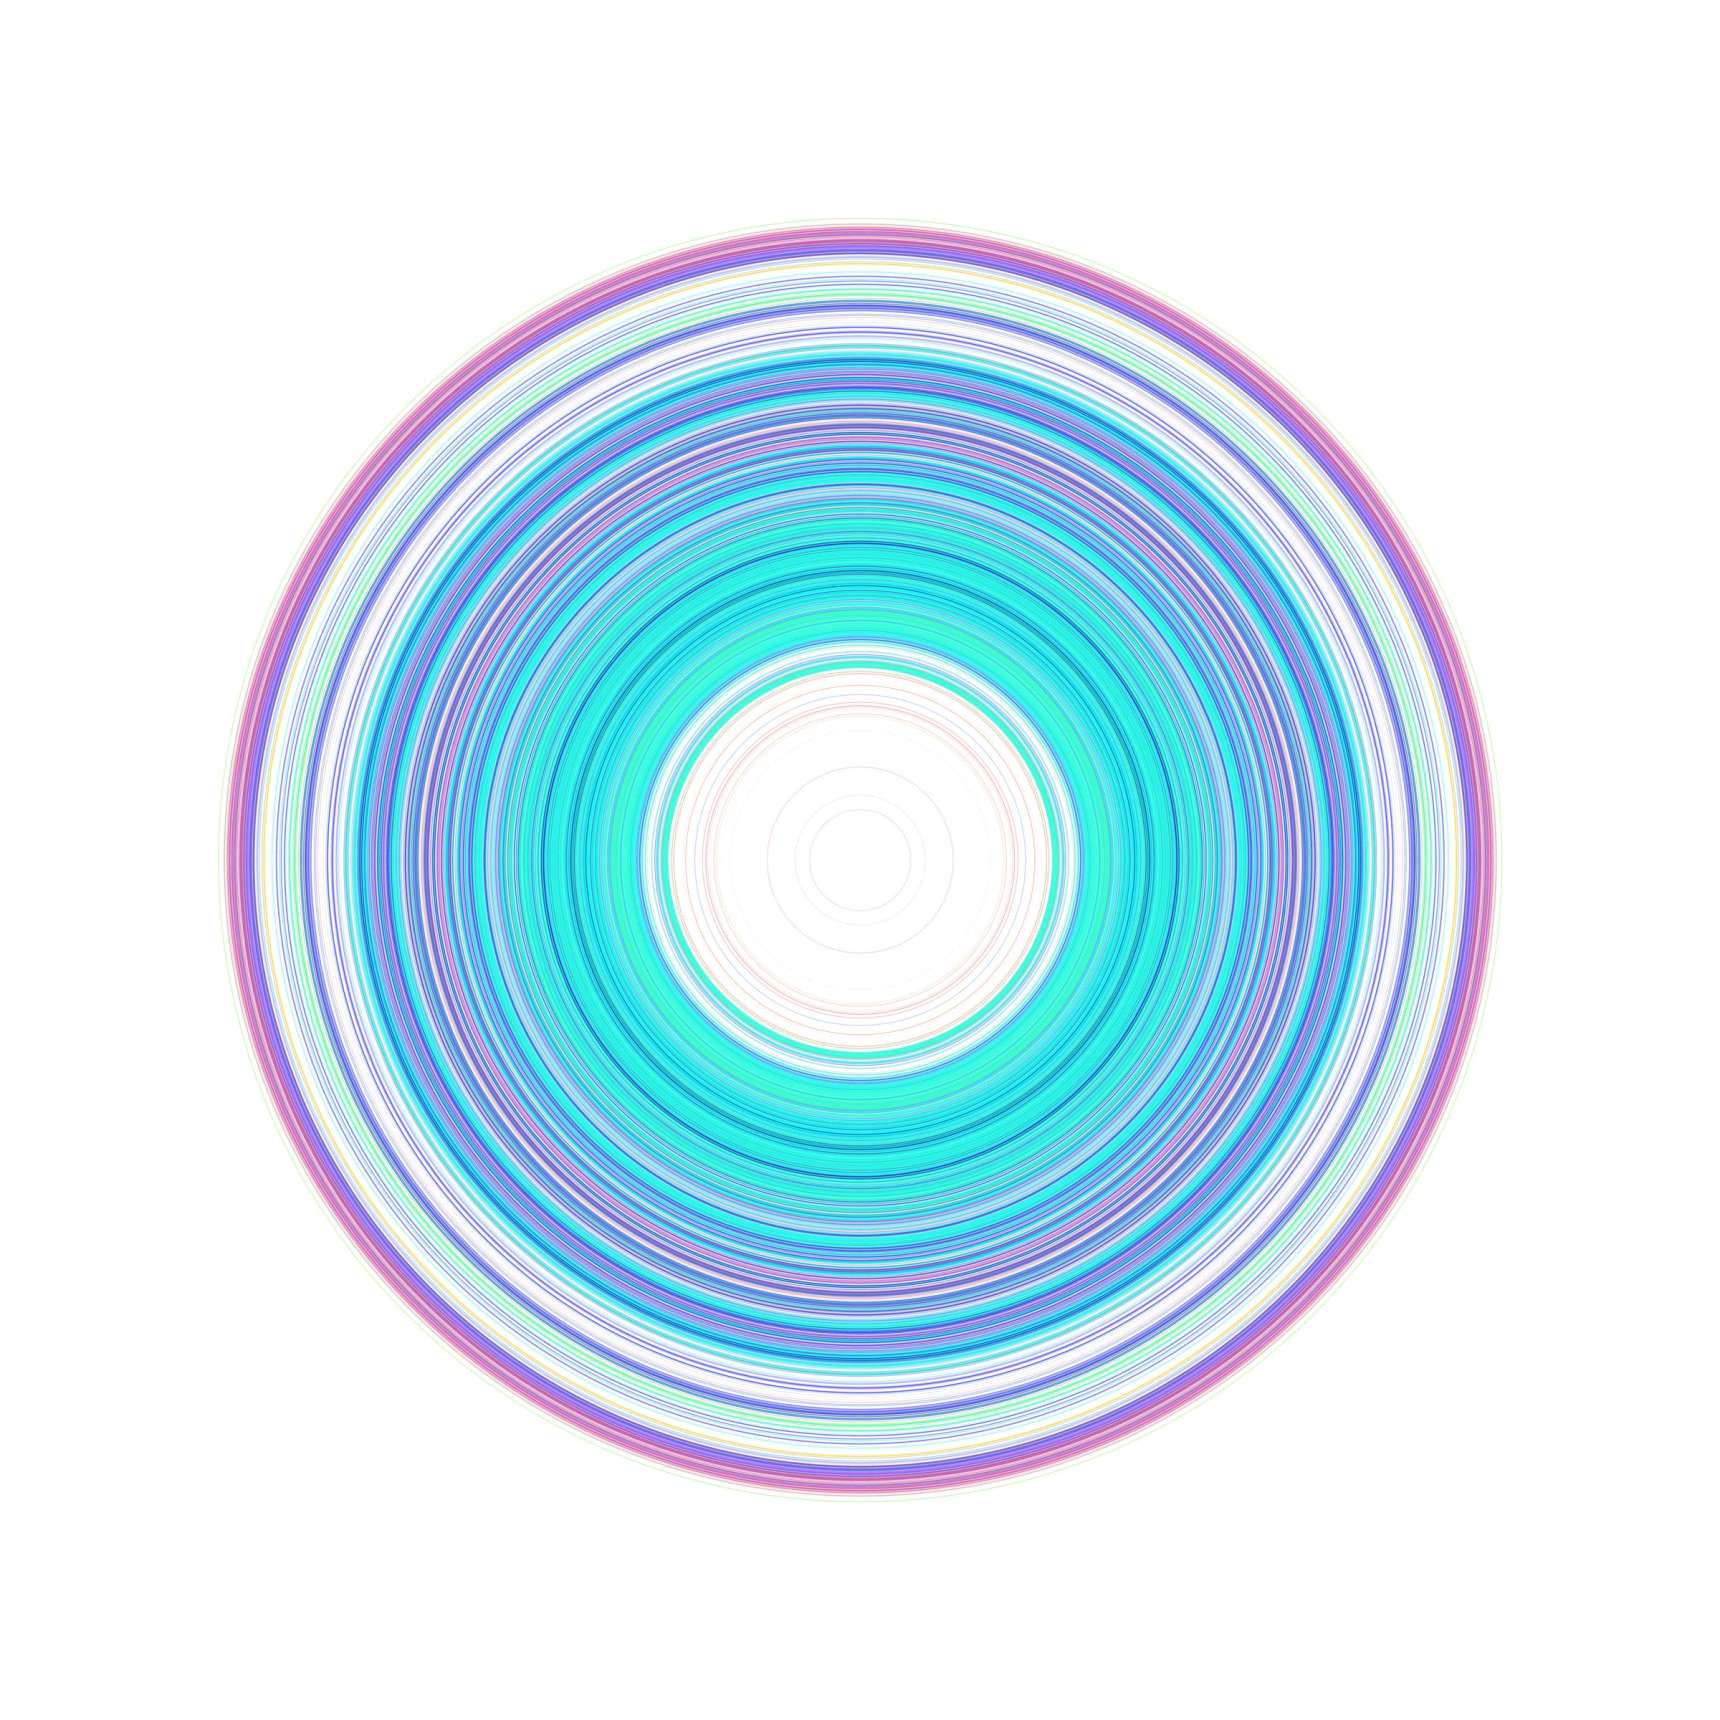
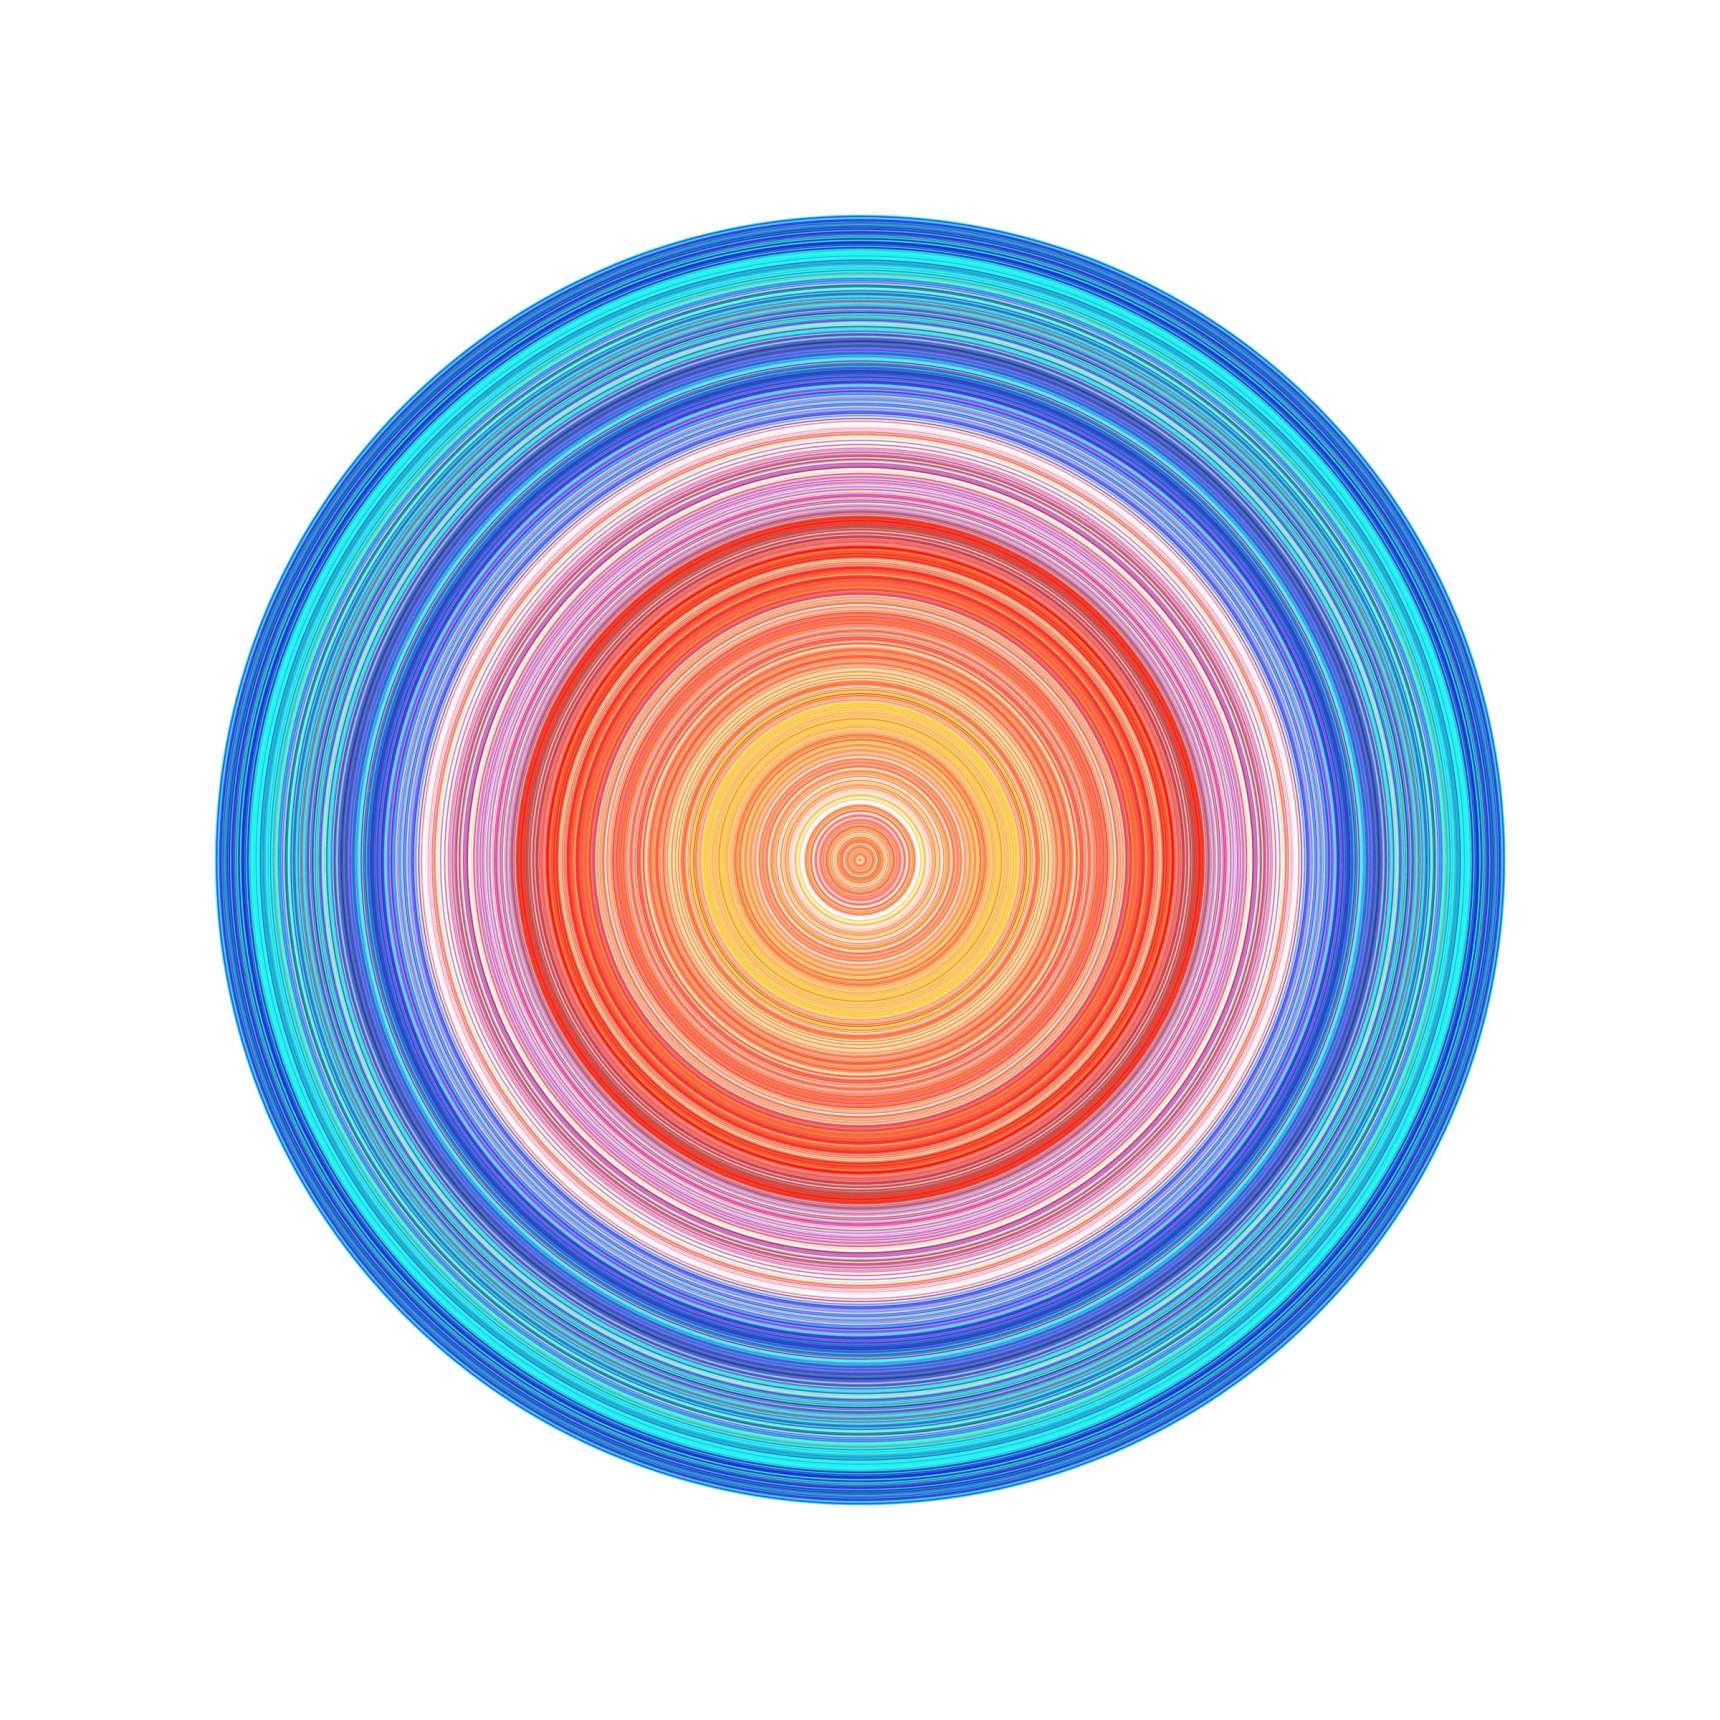
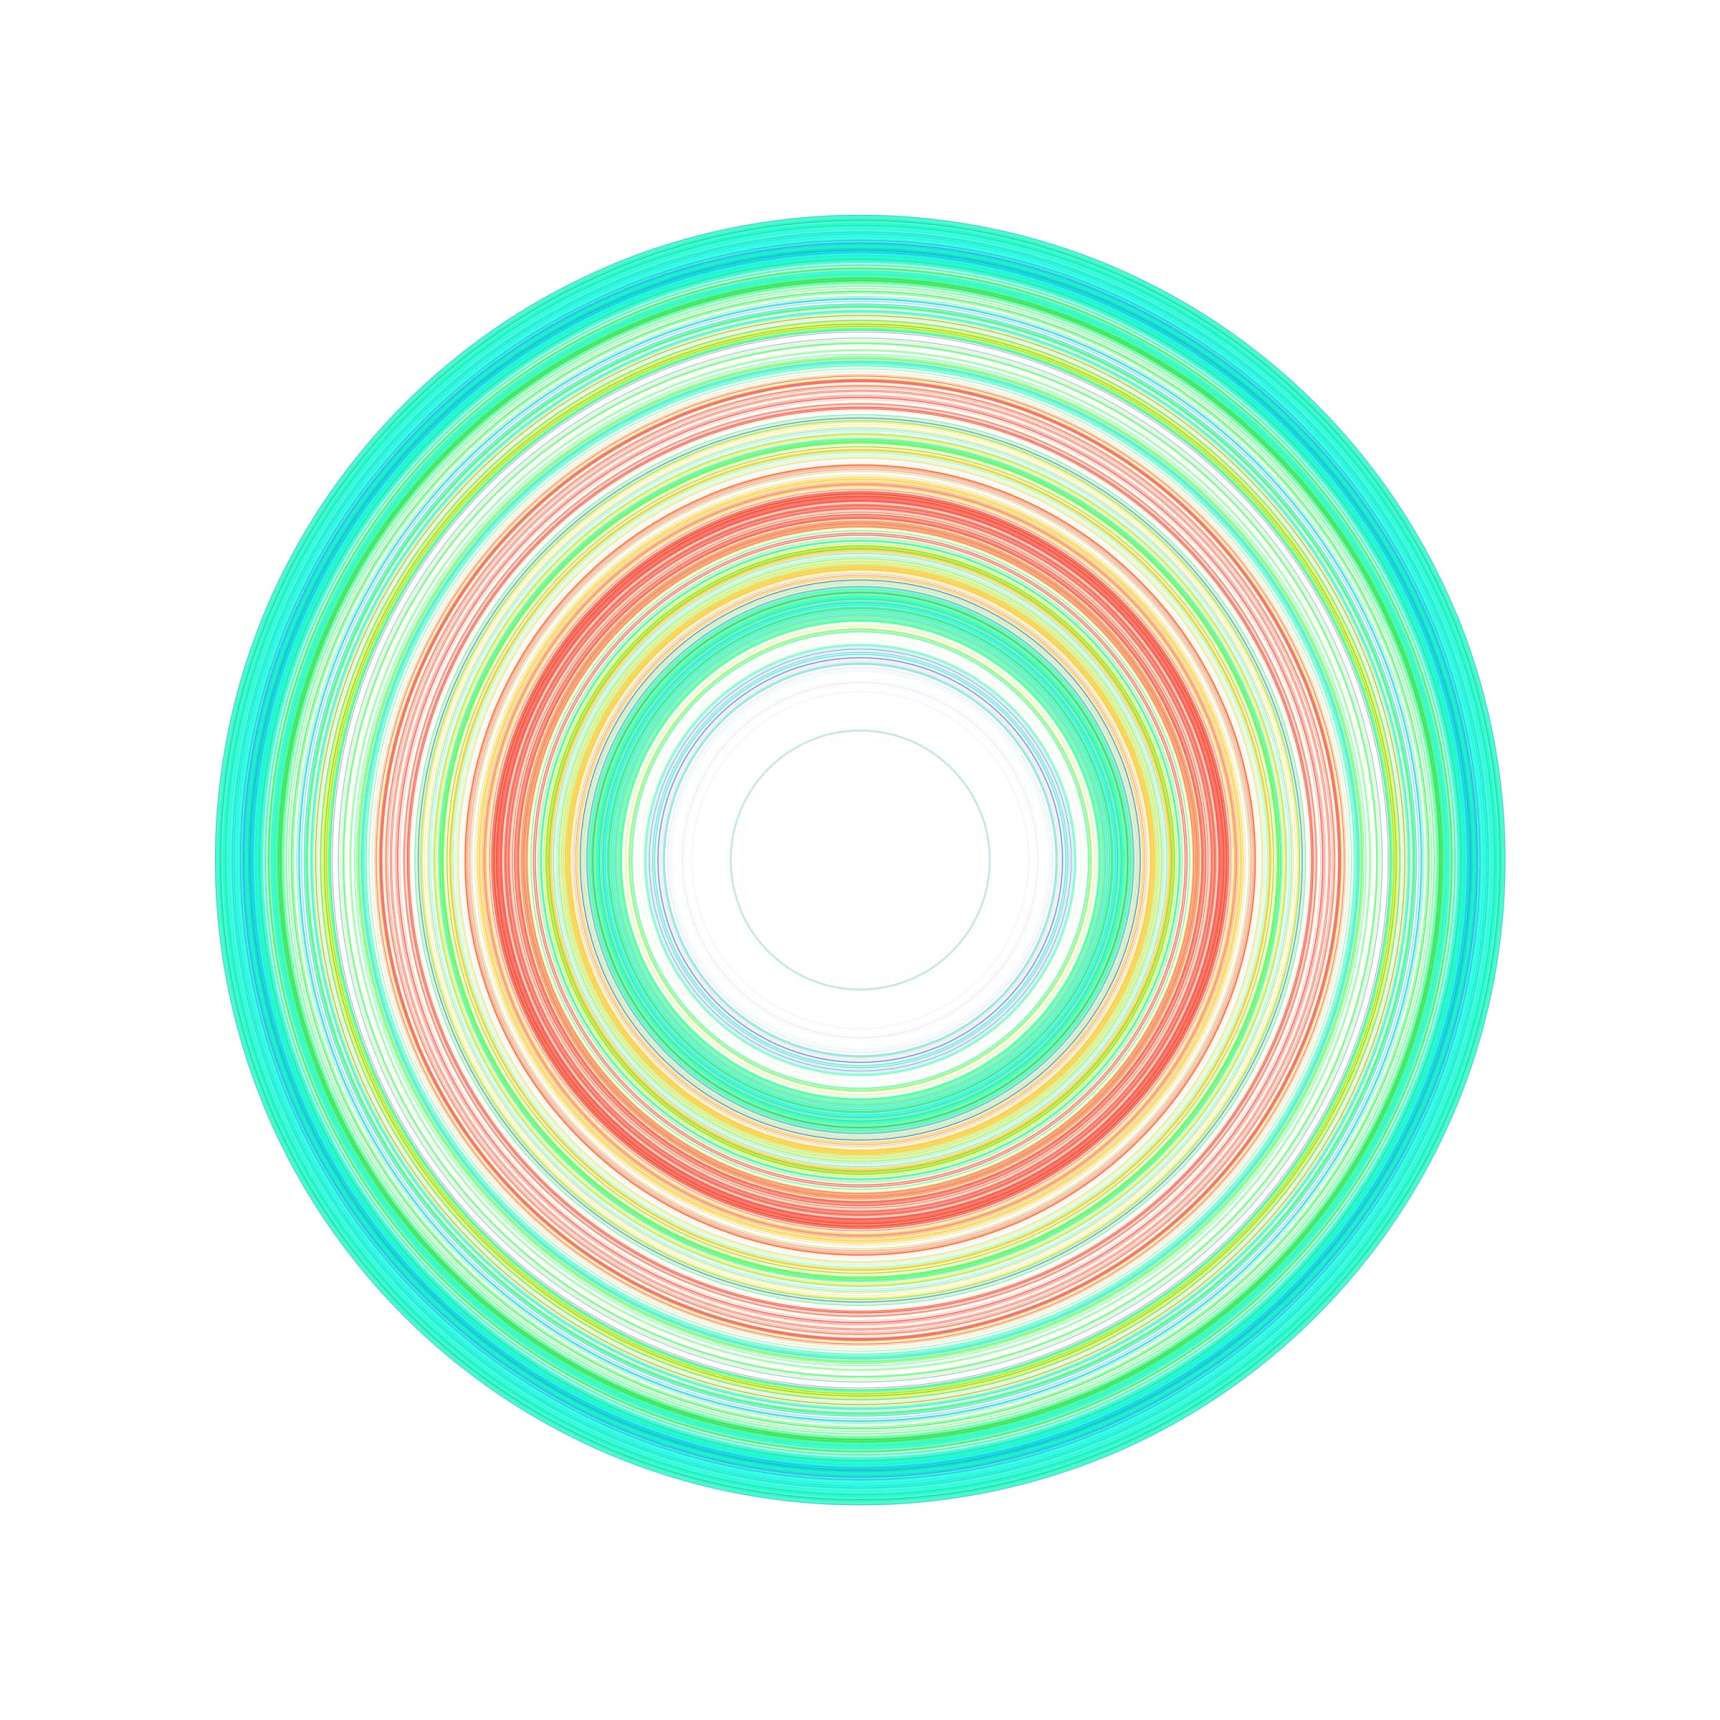
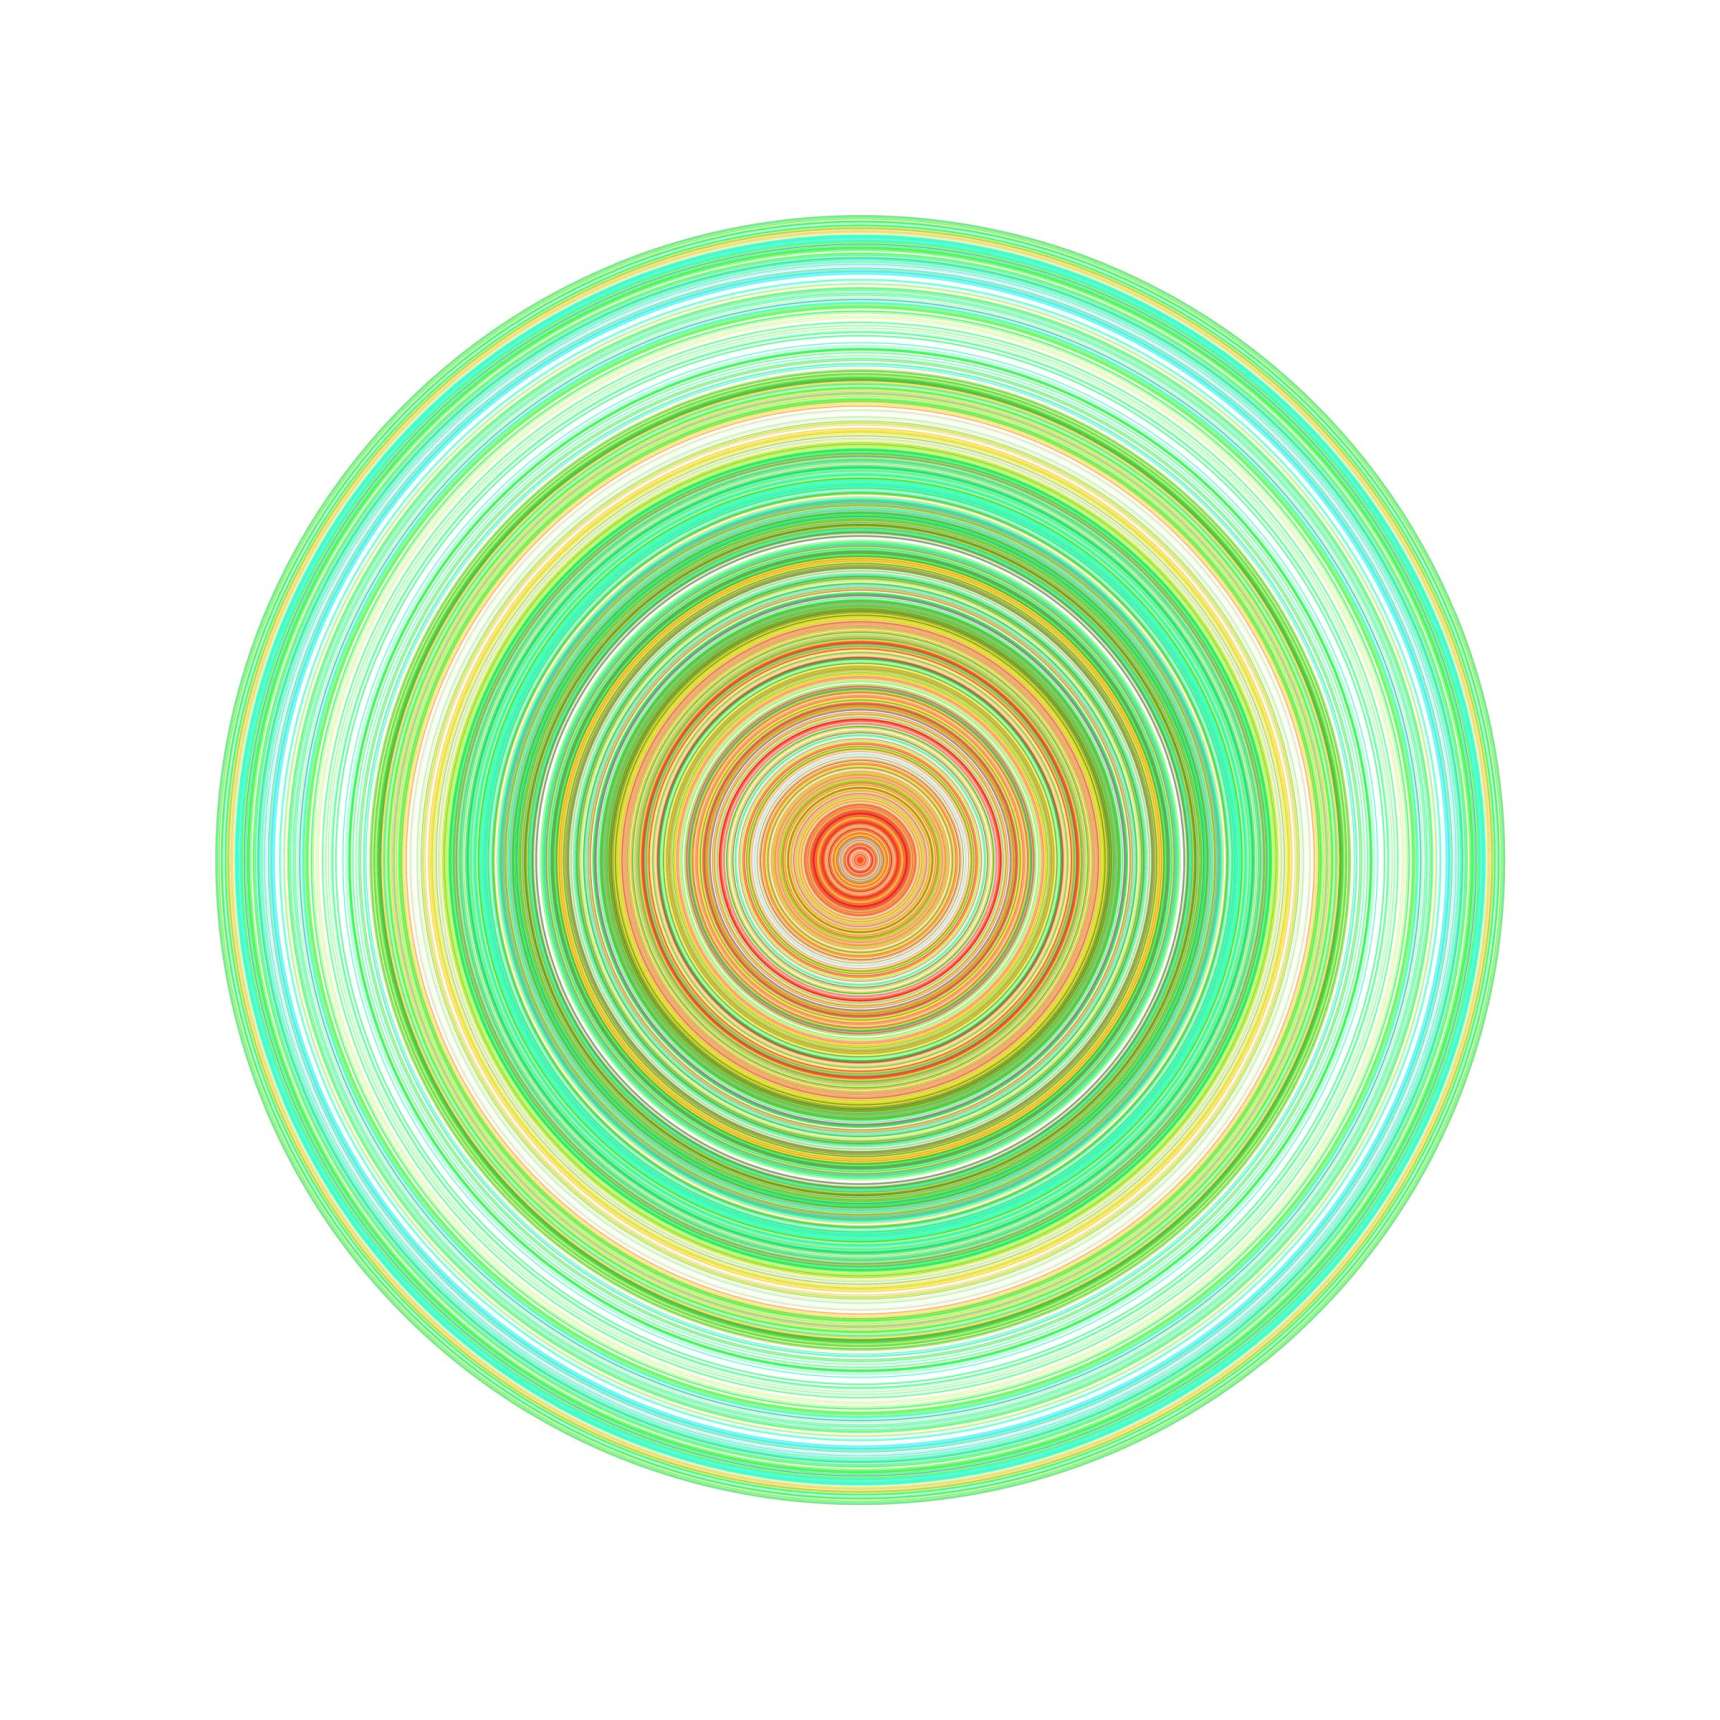
This process draws colorful circles made of thin rings that represent every second when wind was blowing. The drawing process starts in the center with a ring one pixel in diameter. The rings get progressively larger as the day’s data is processed. Wind direction influences each ring's color and wind speed its thickness.
One of the things I enjoy about my wind drawings is being able to compare ones based on data from different days. The two composite drawings seen here are based on wind data collected at two different locations.
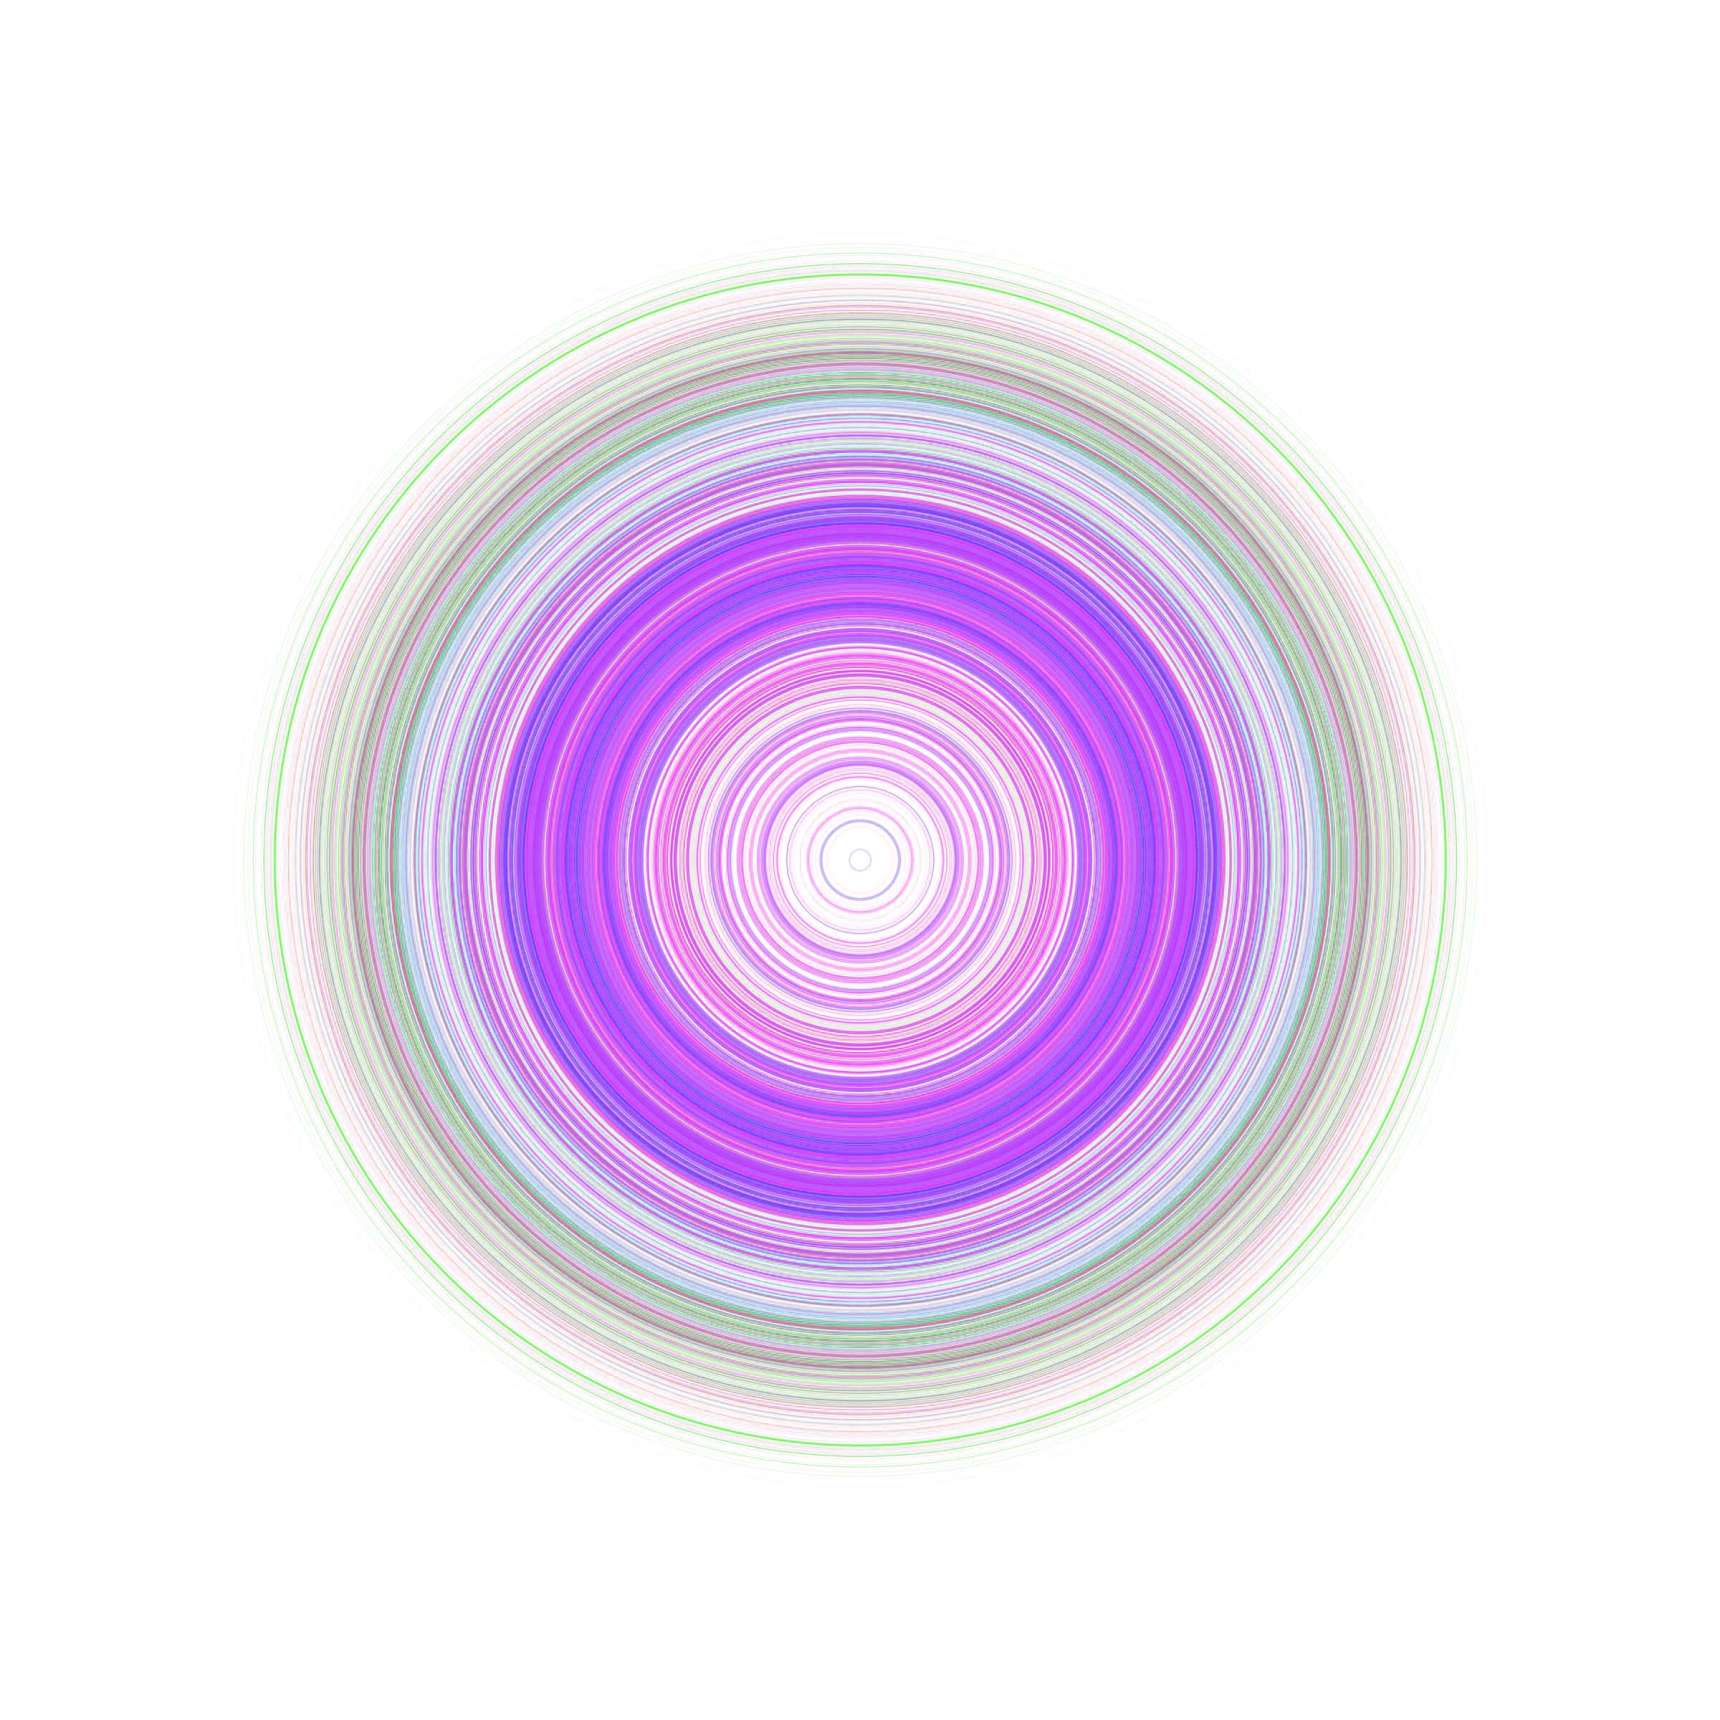
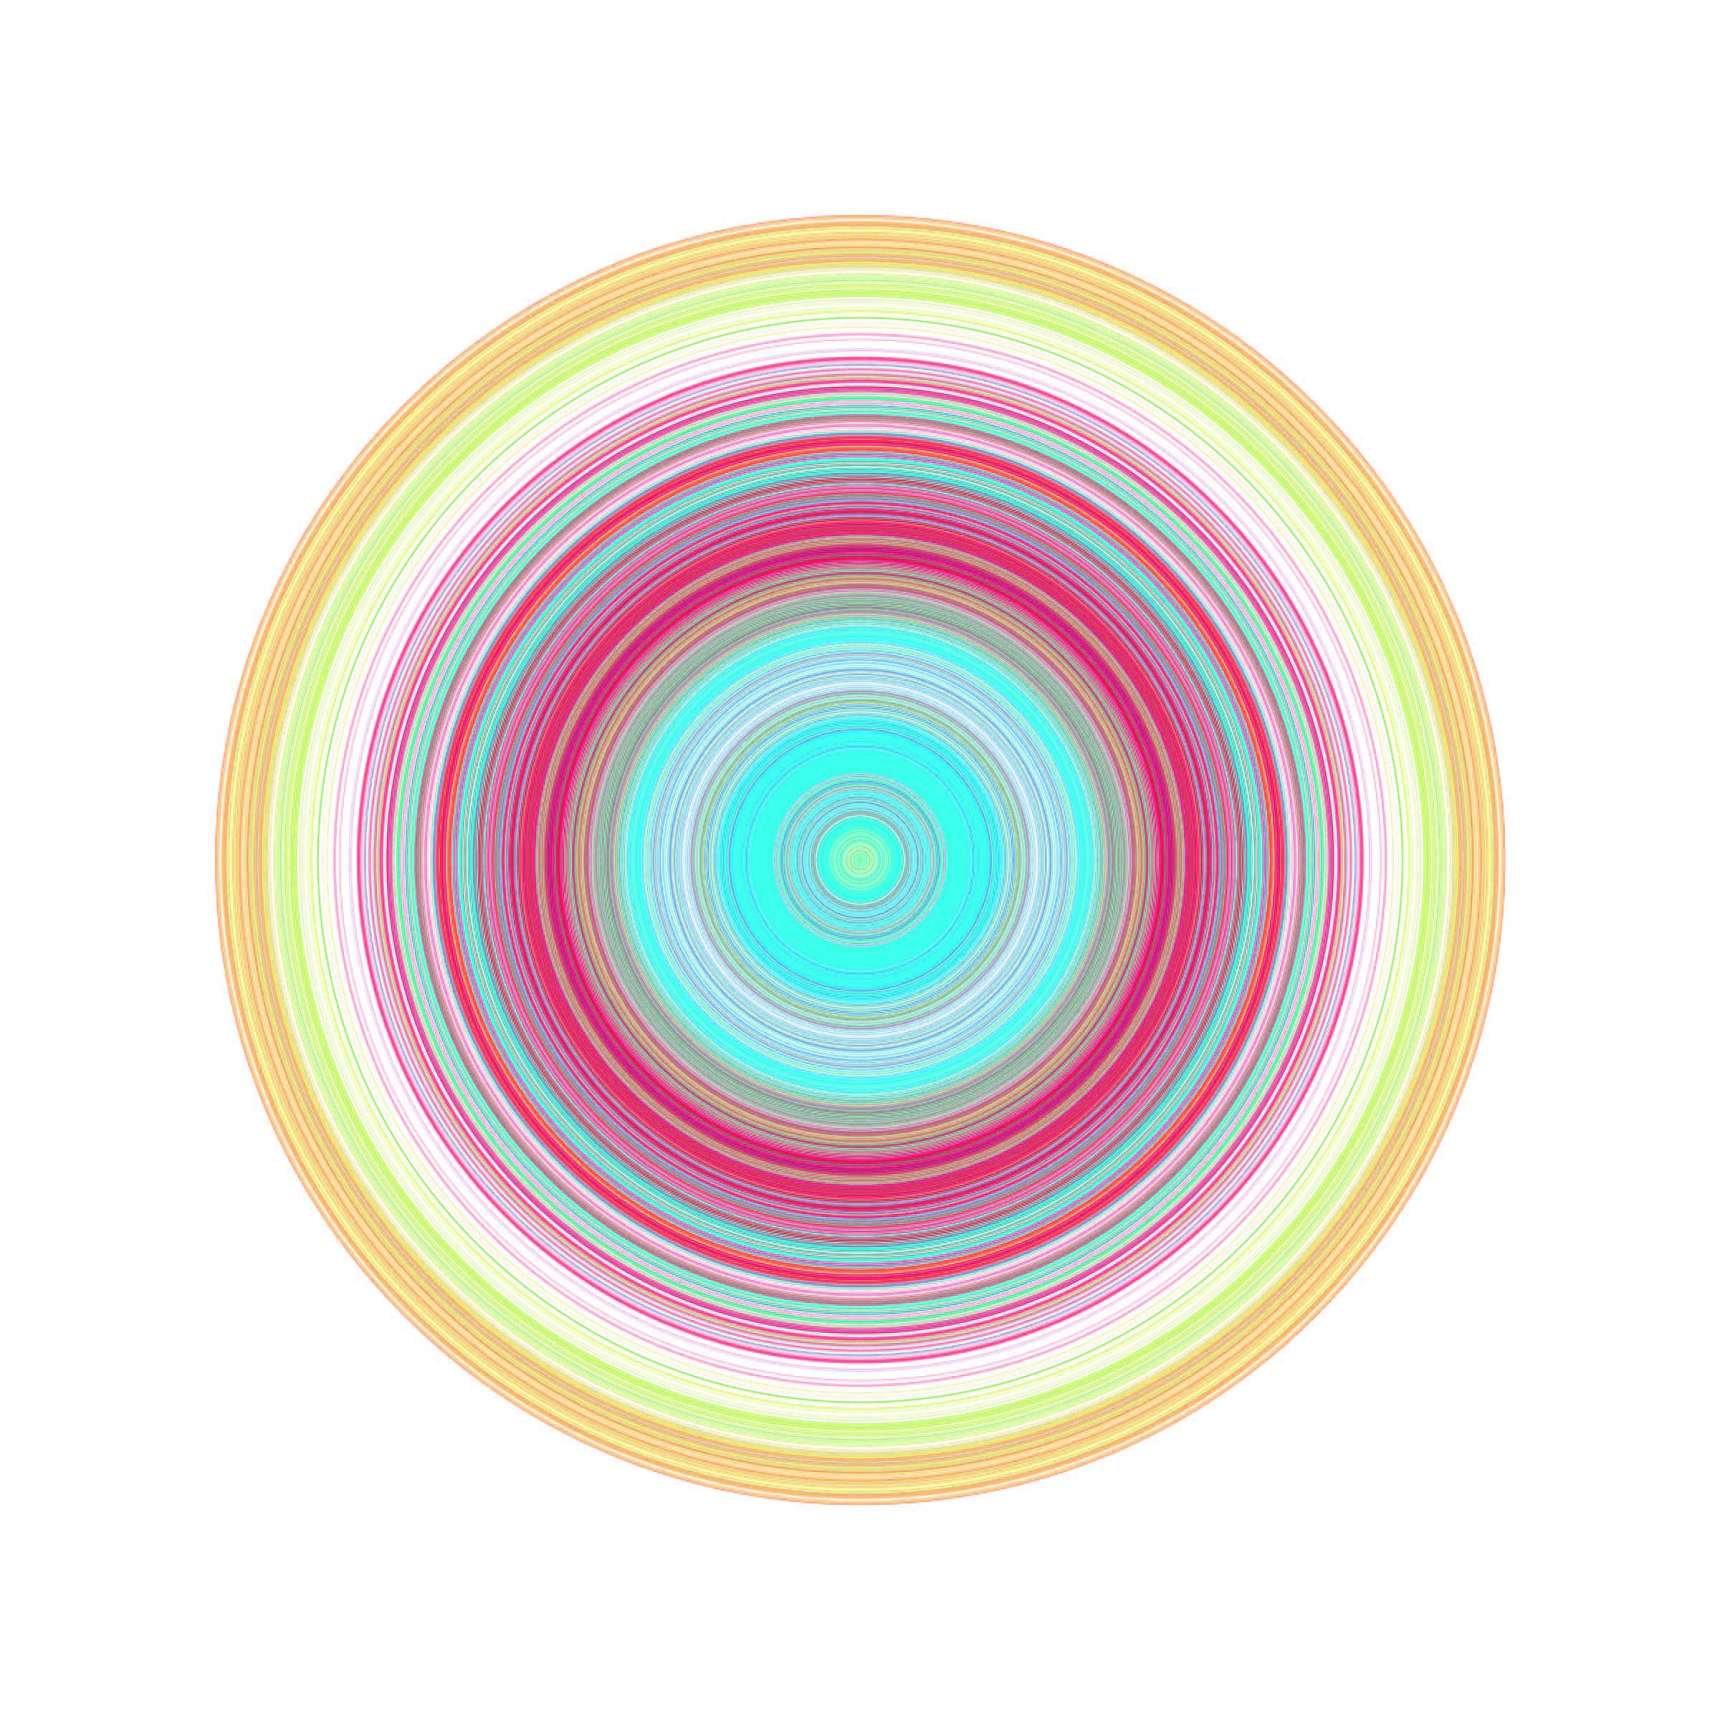

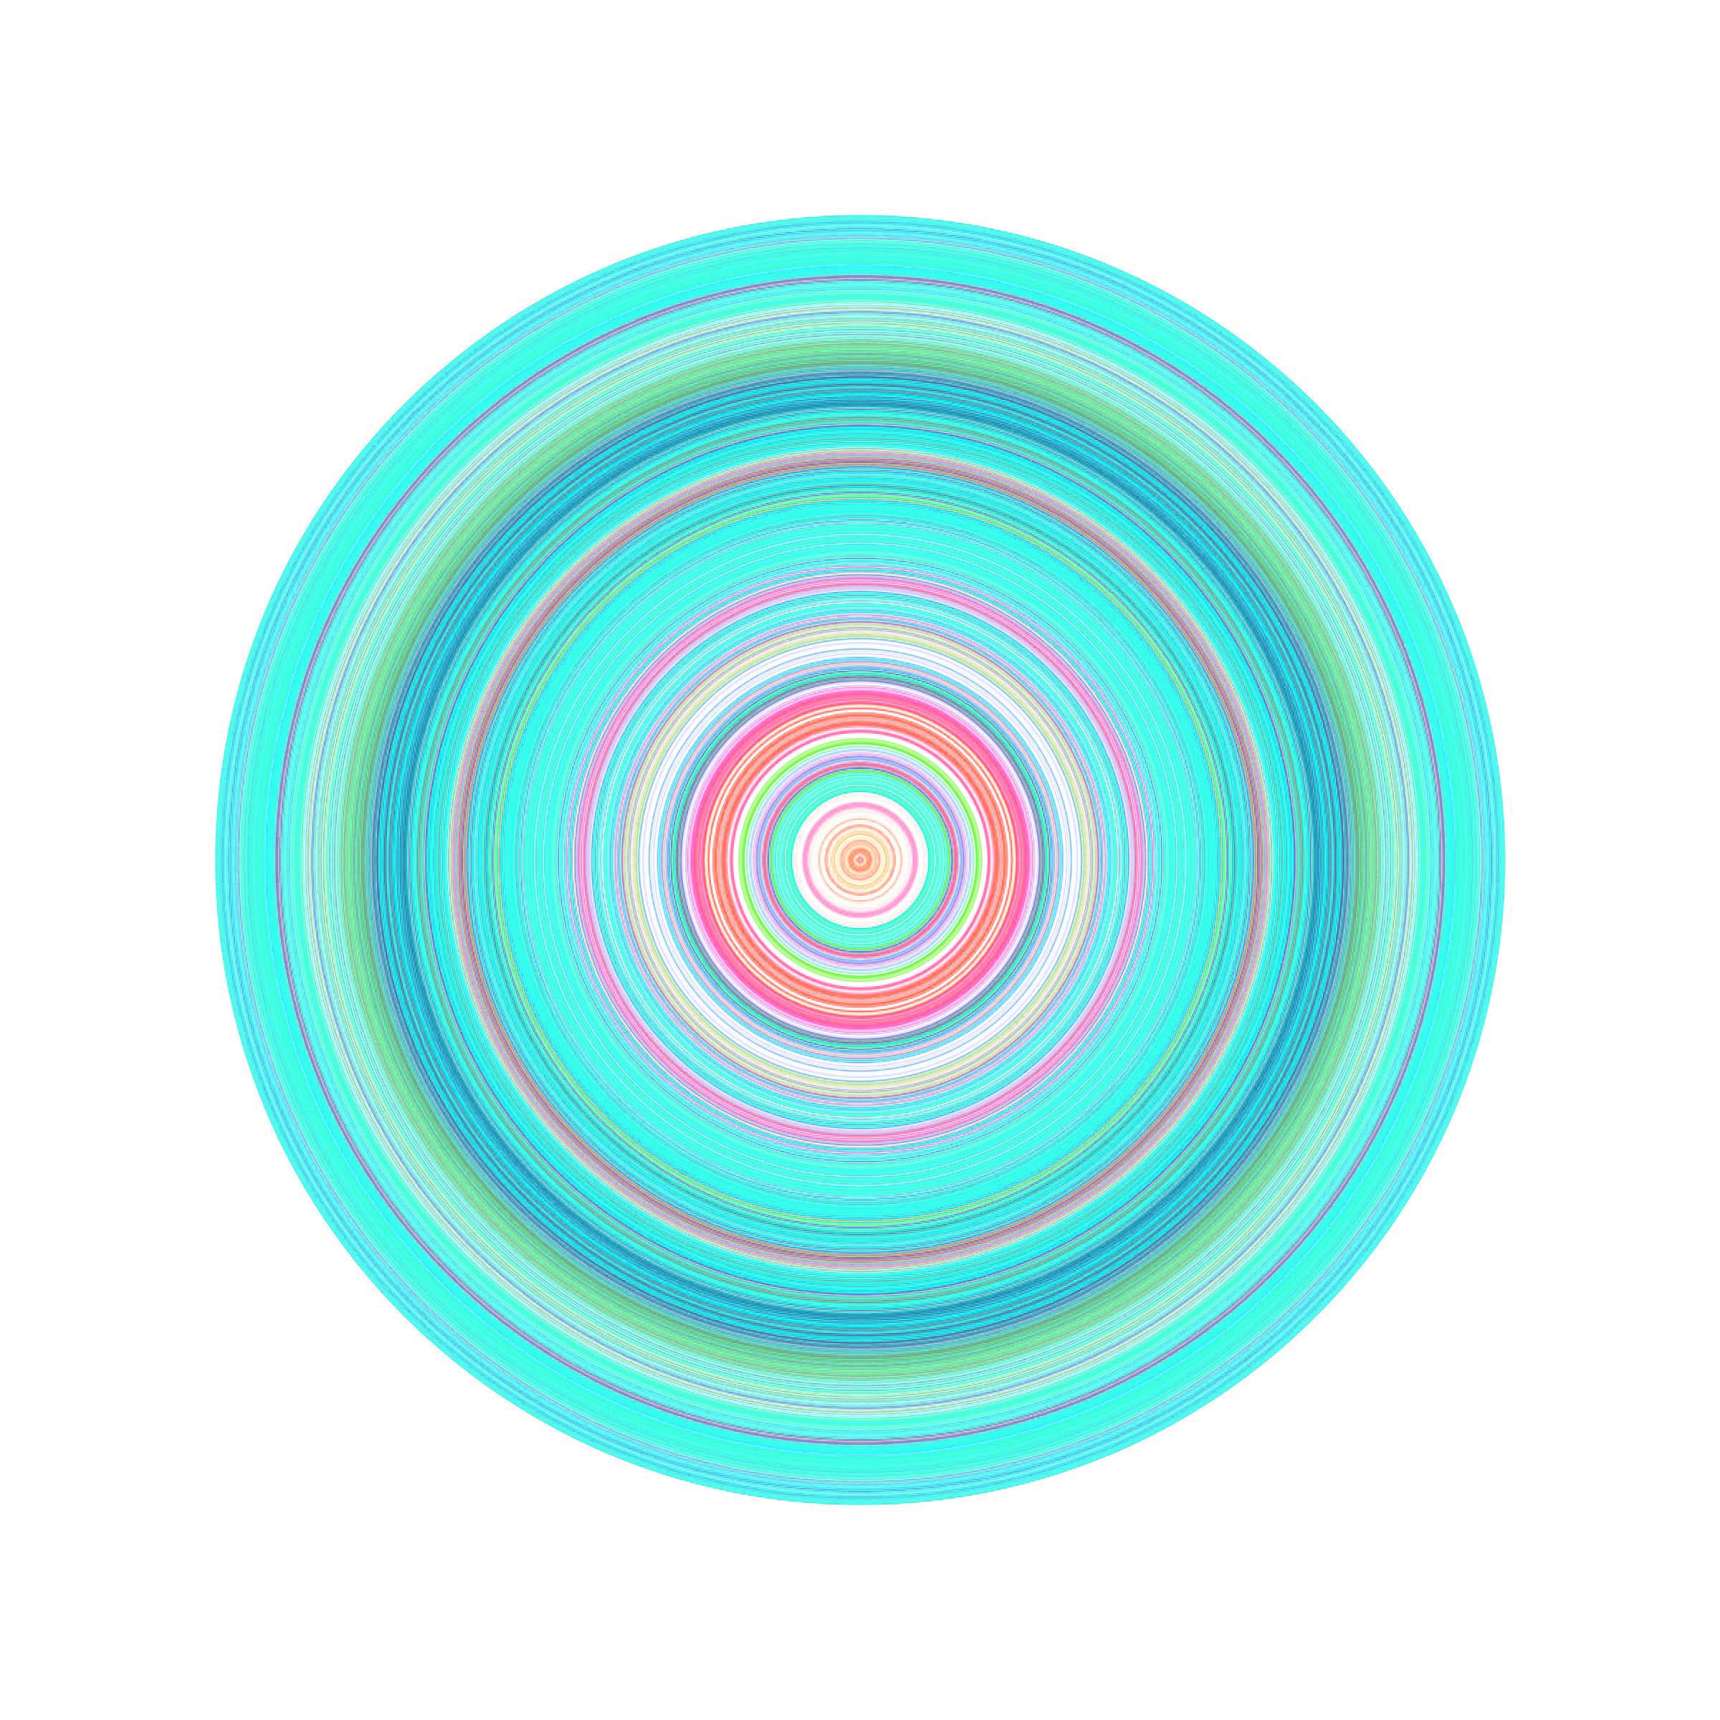


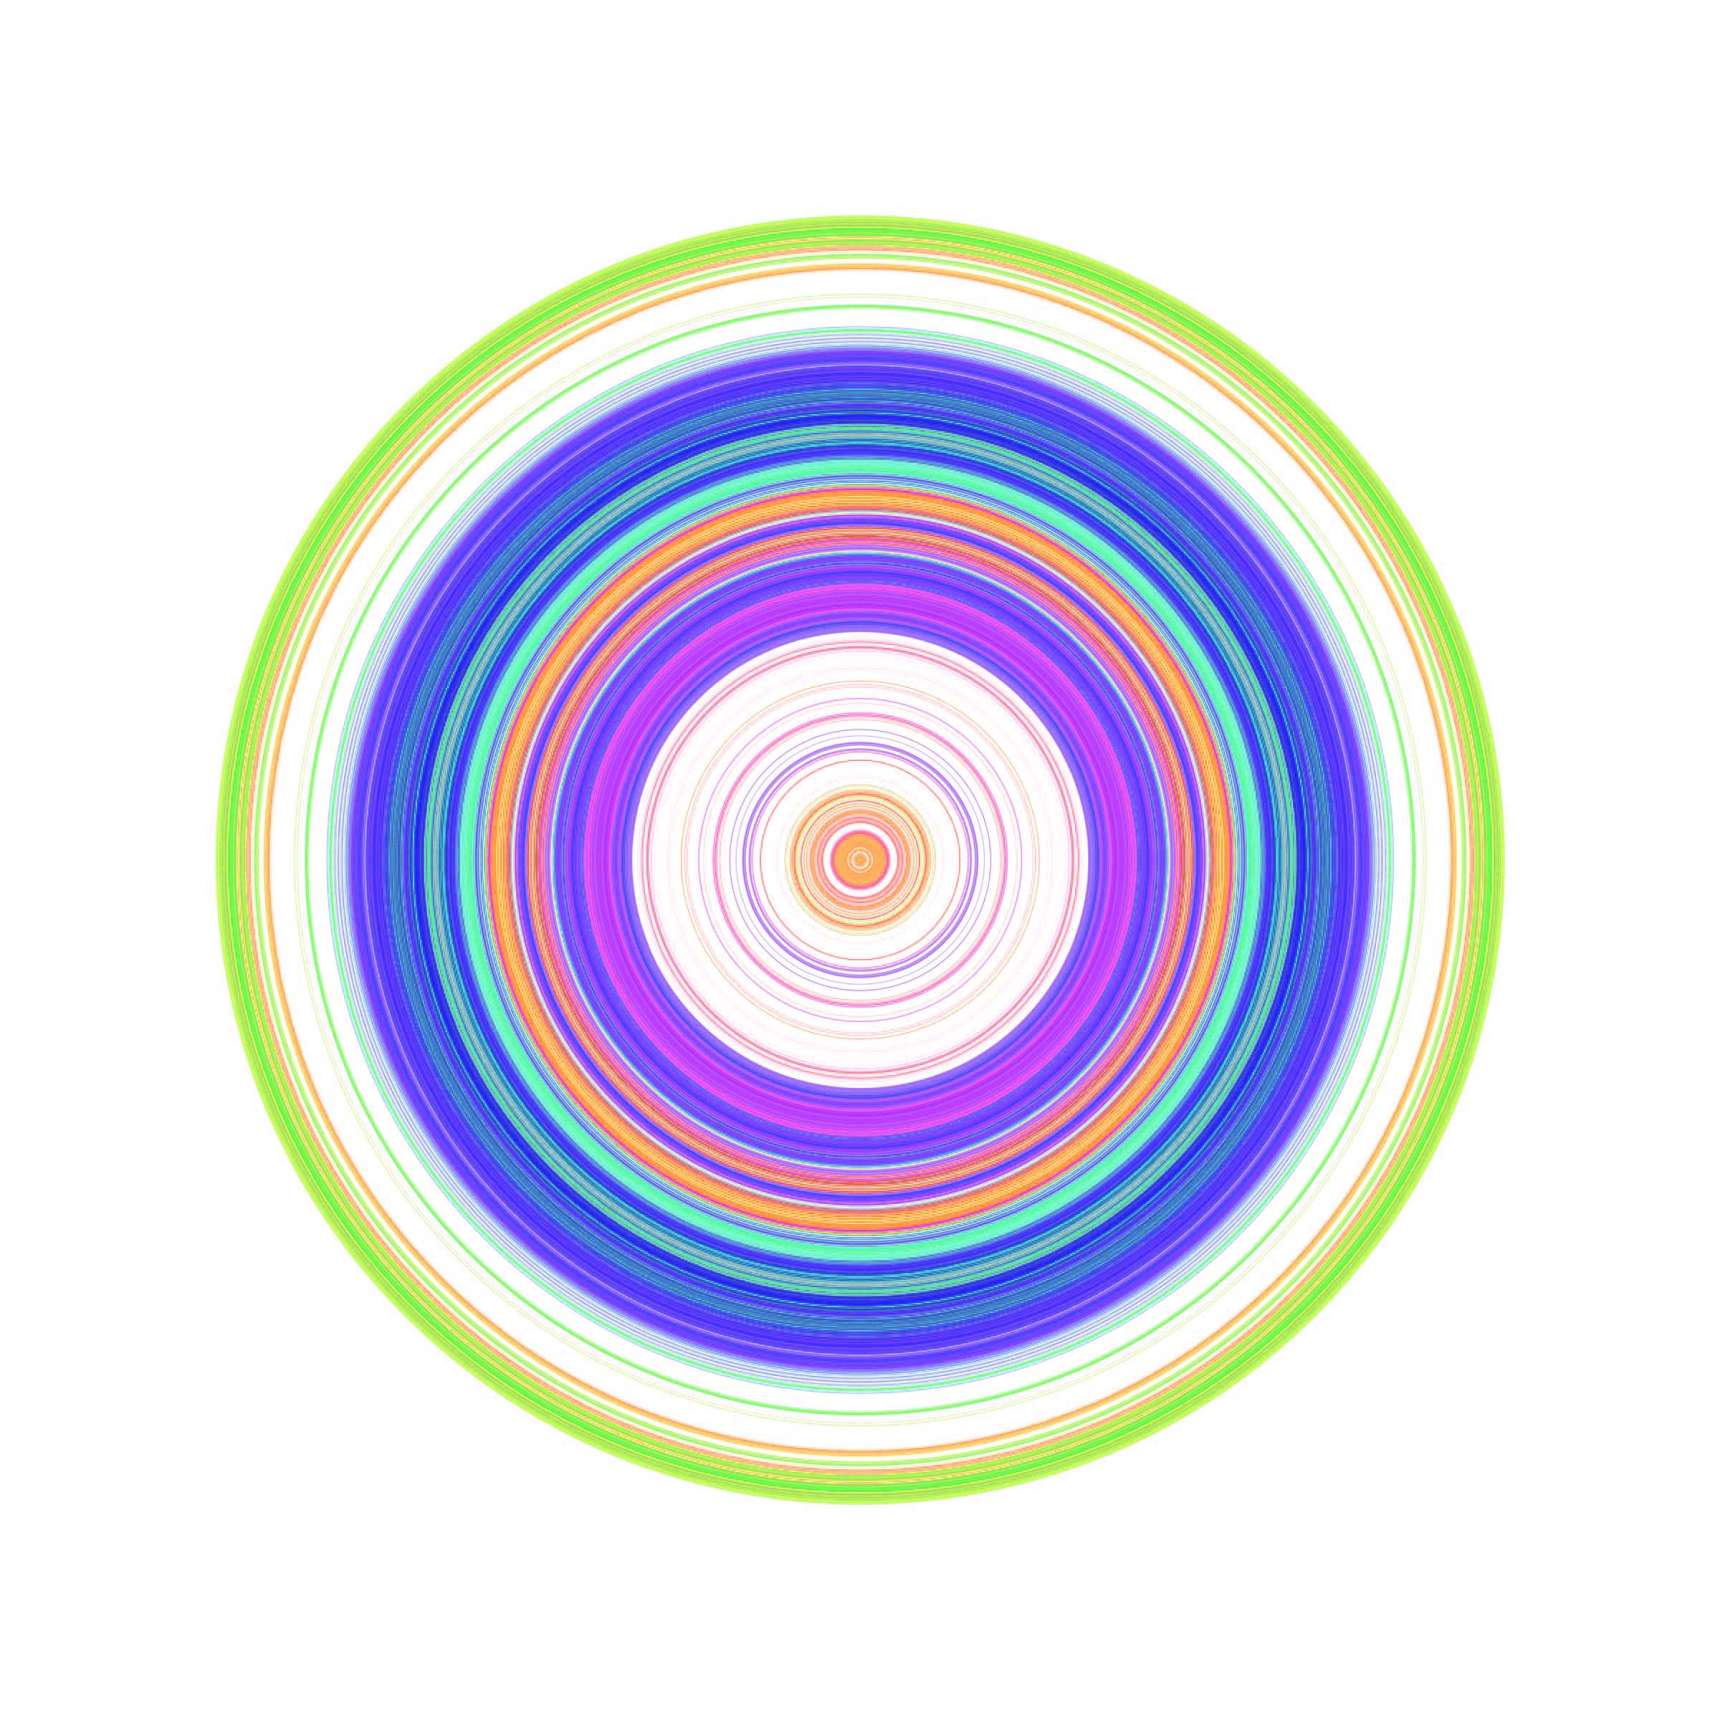
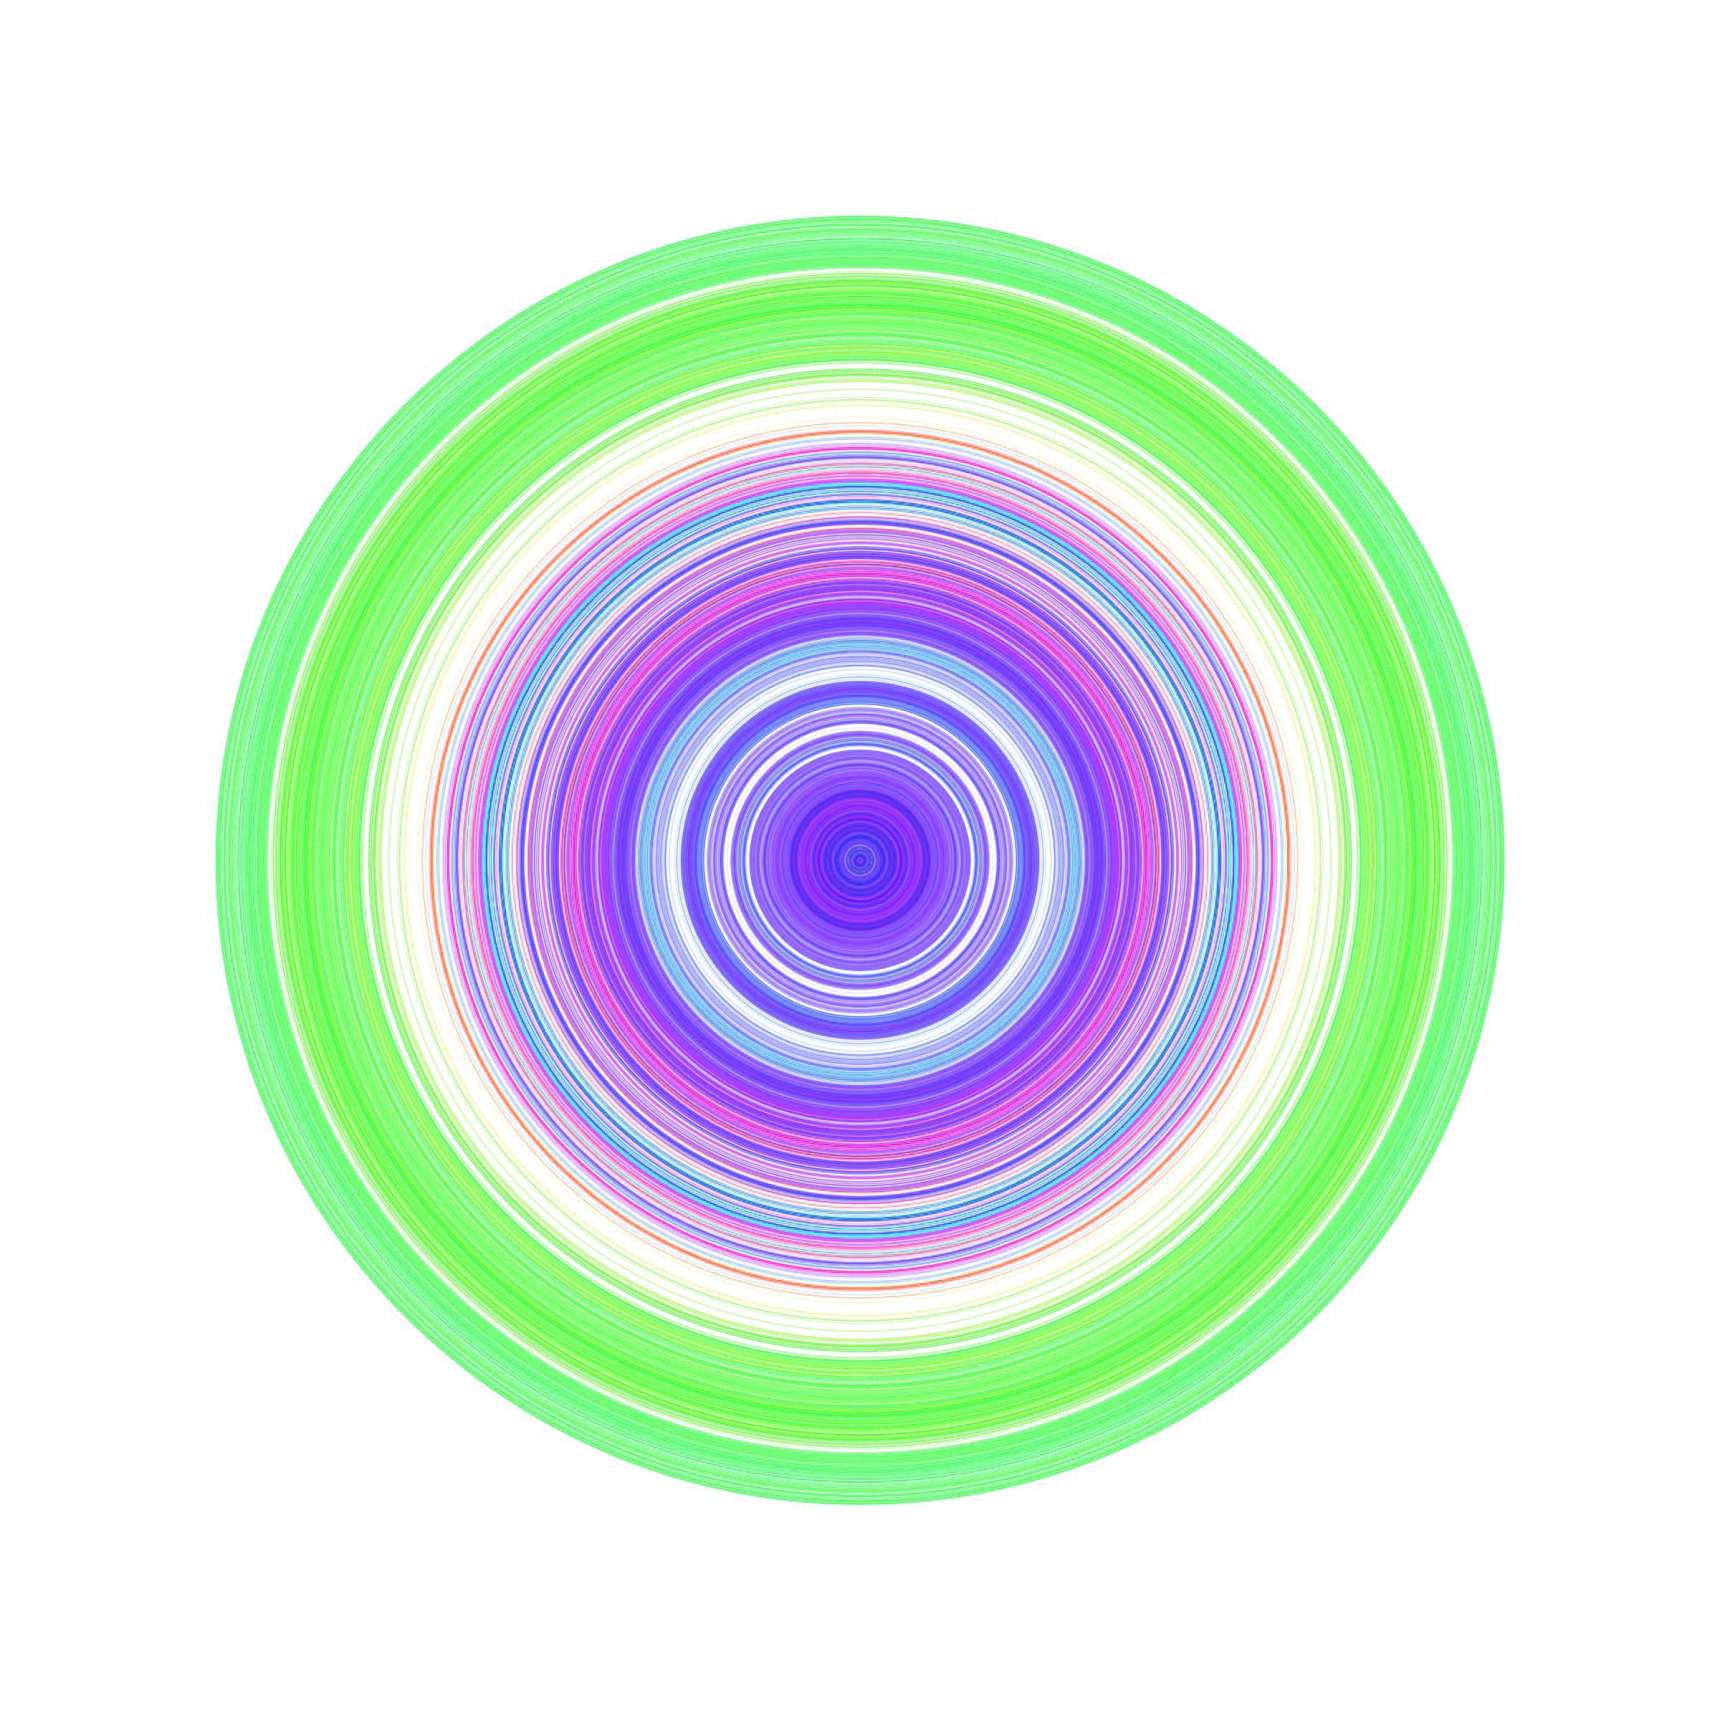

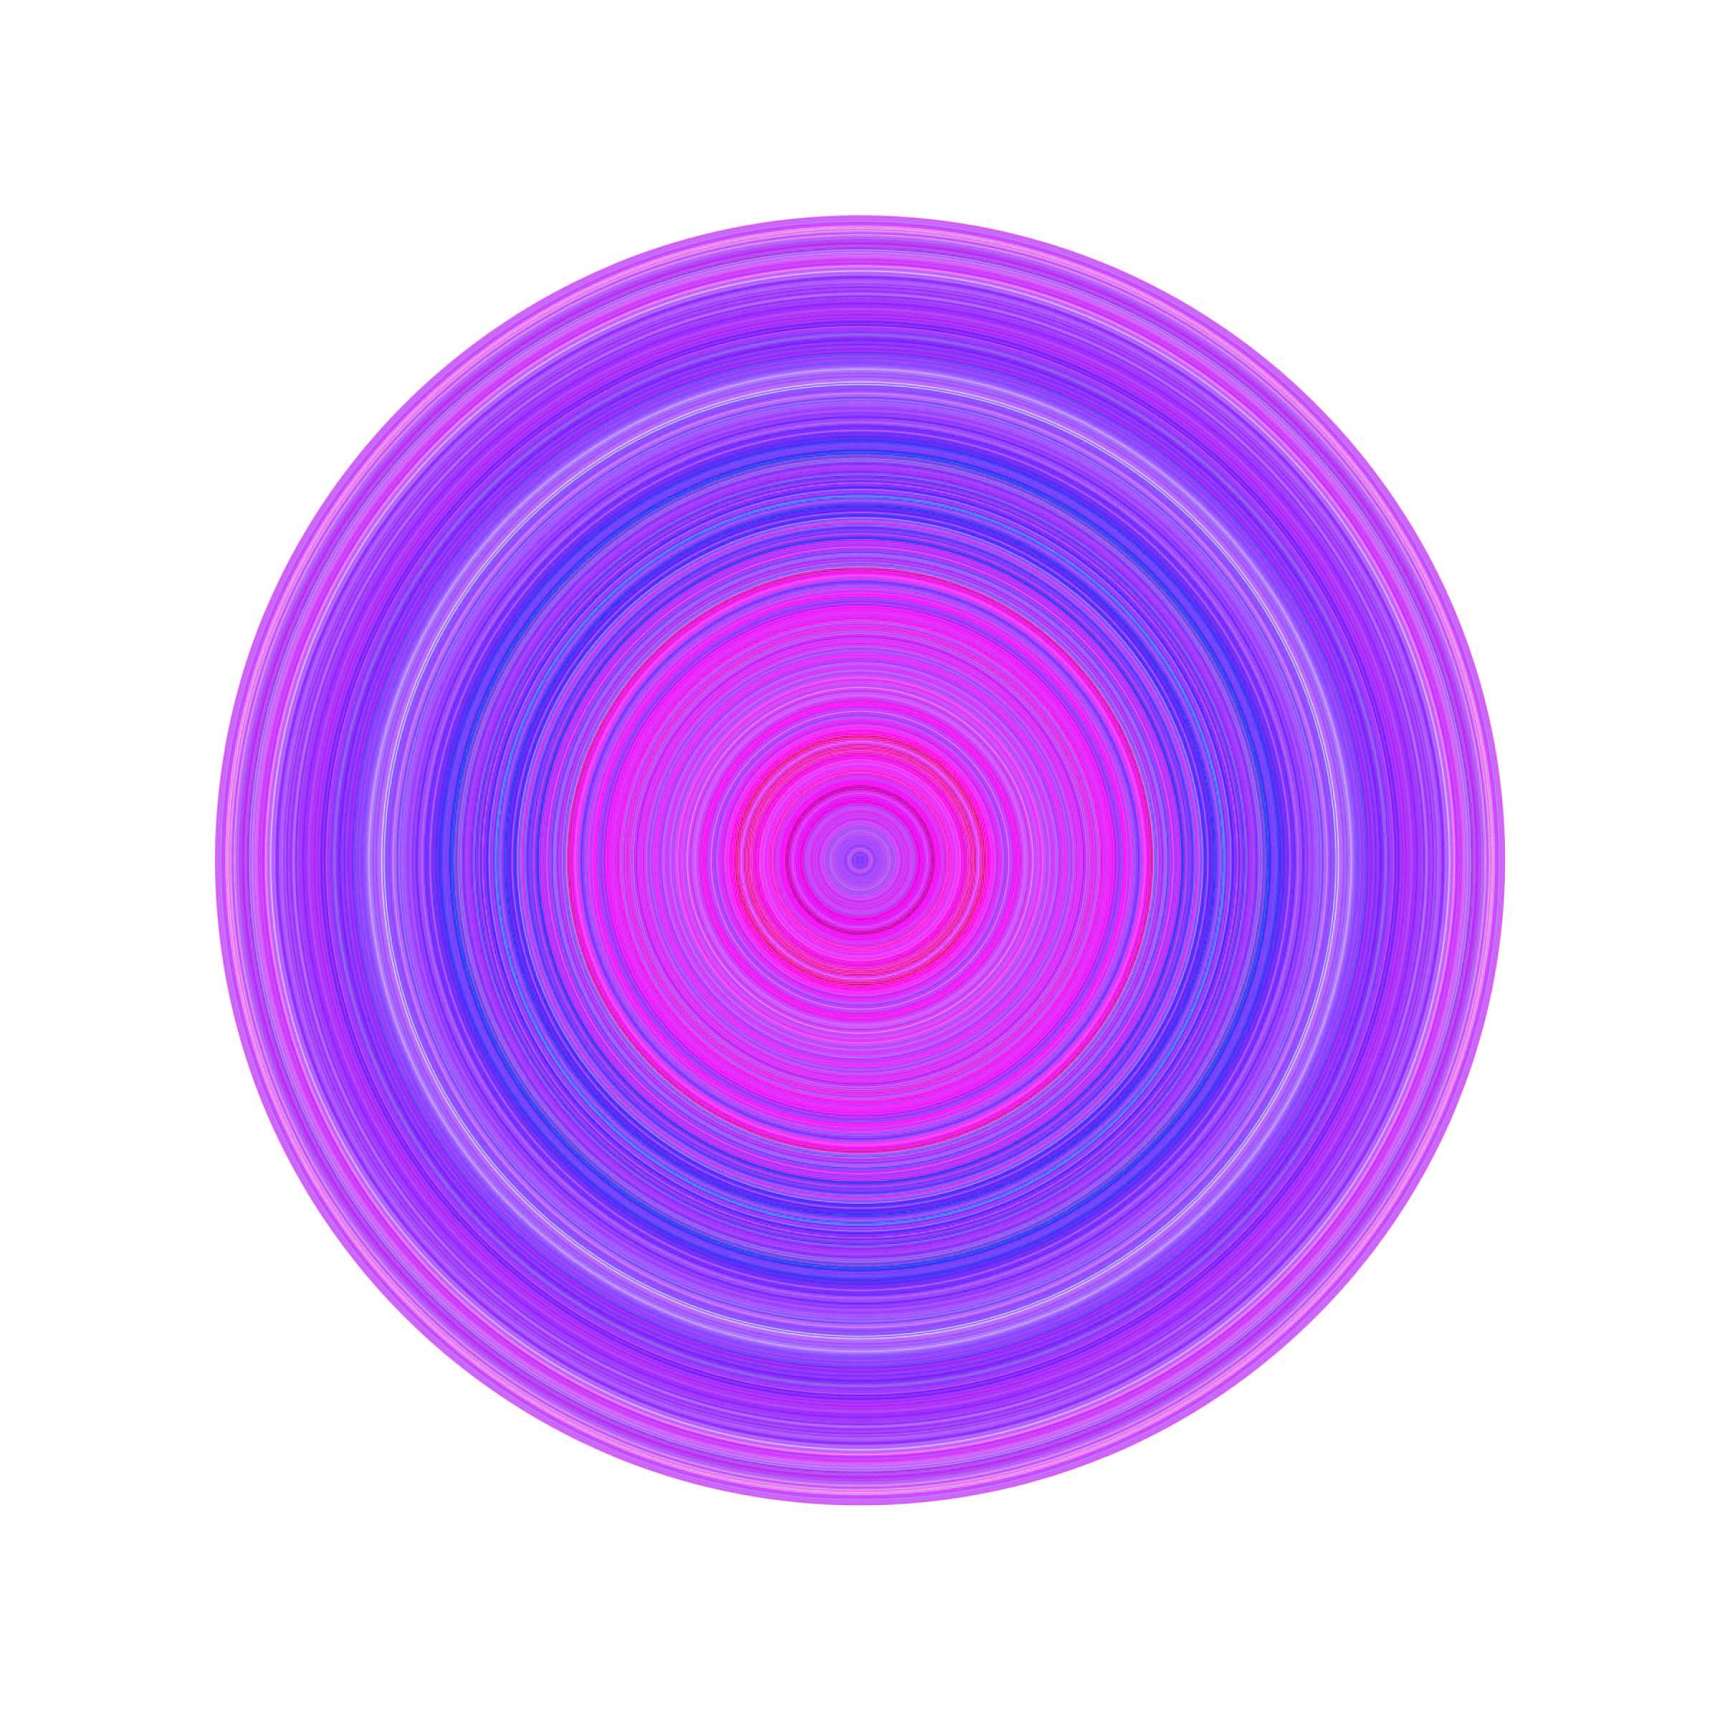

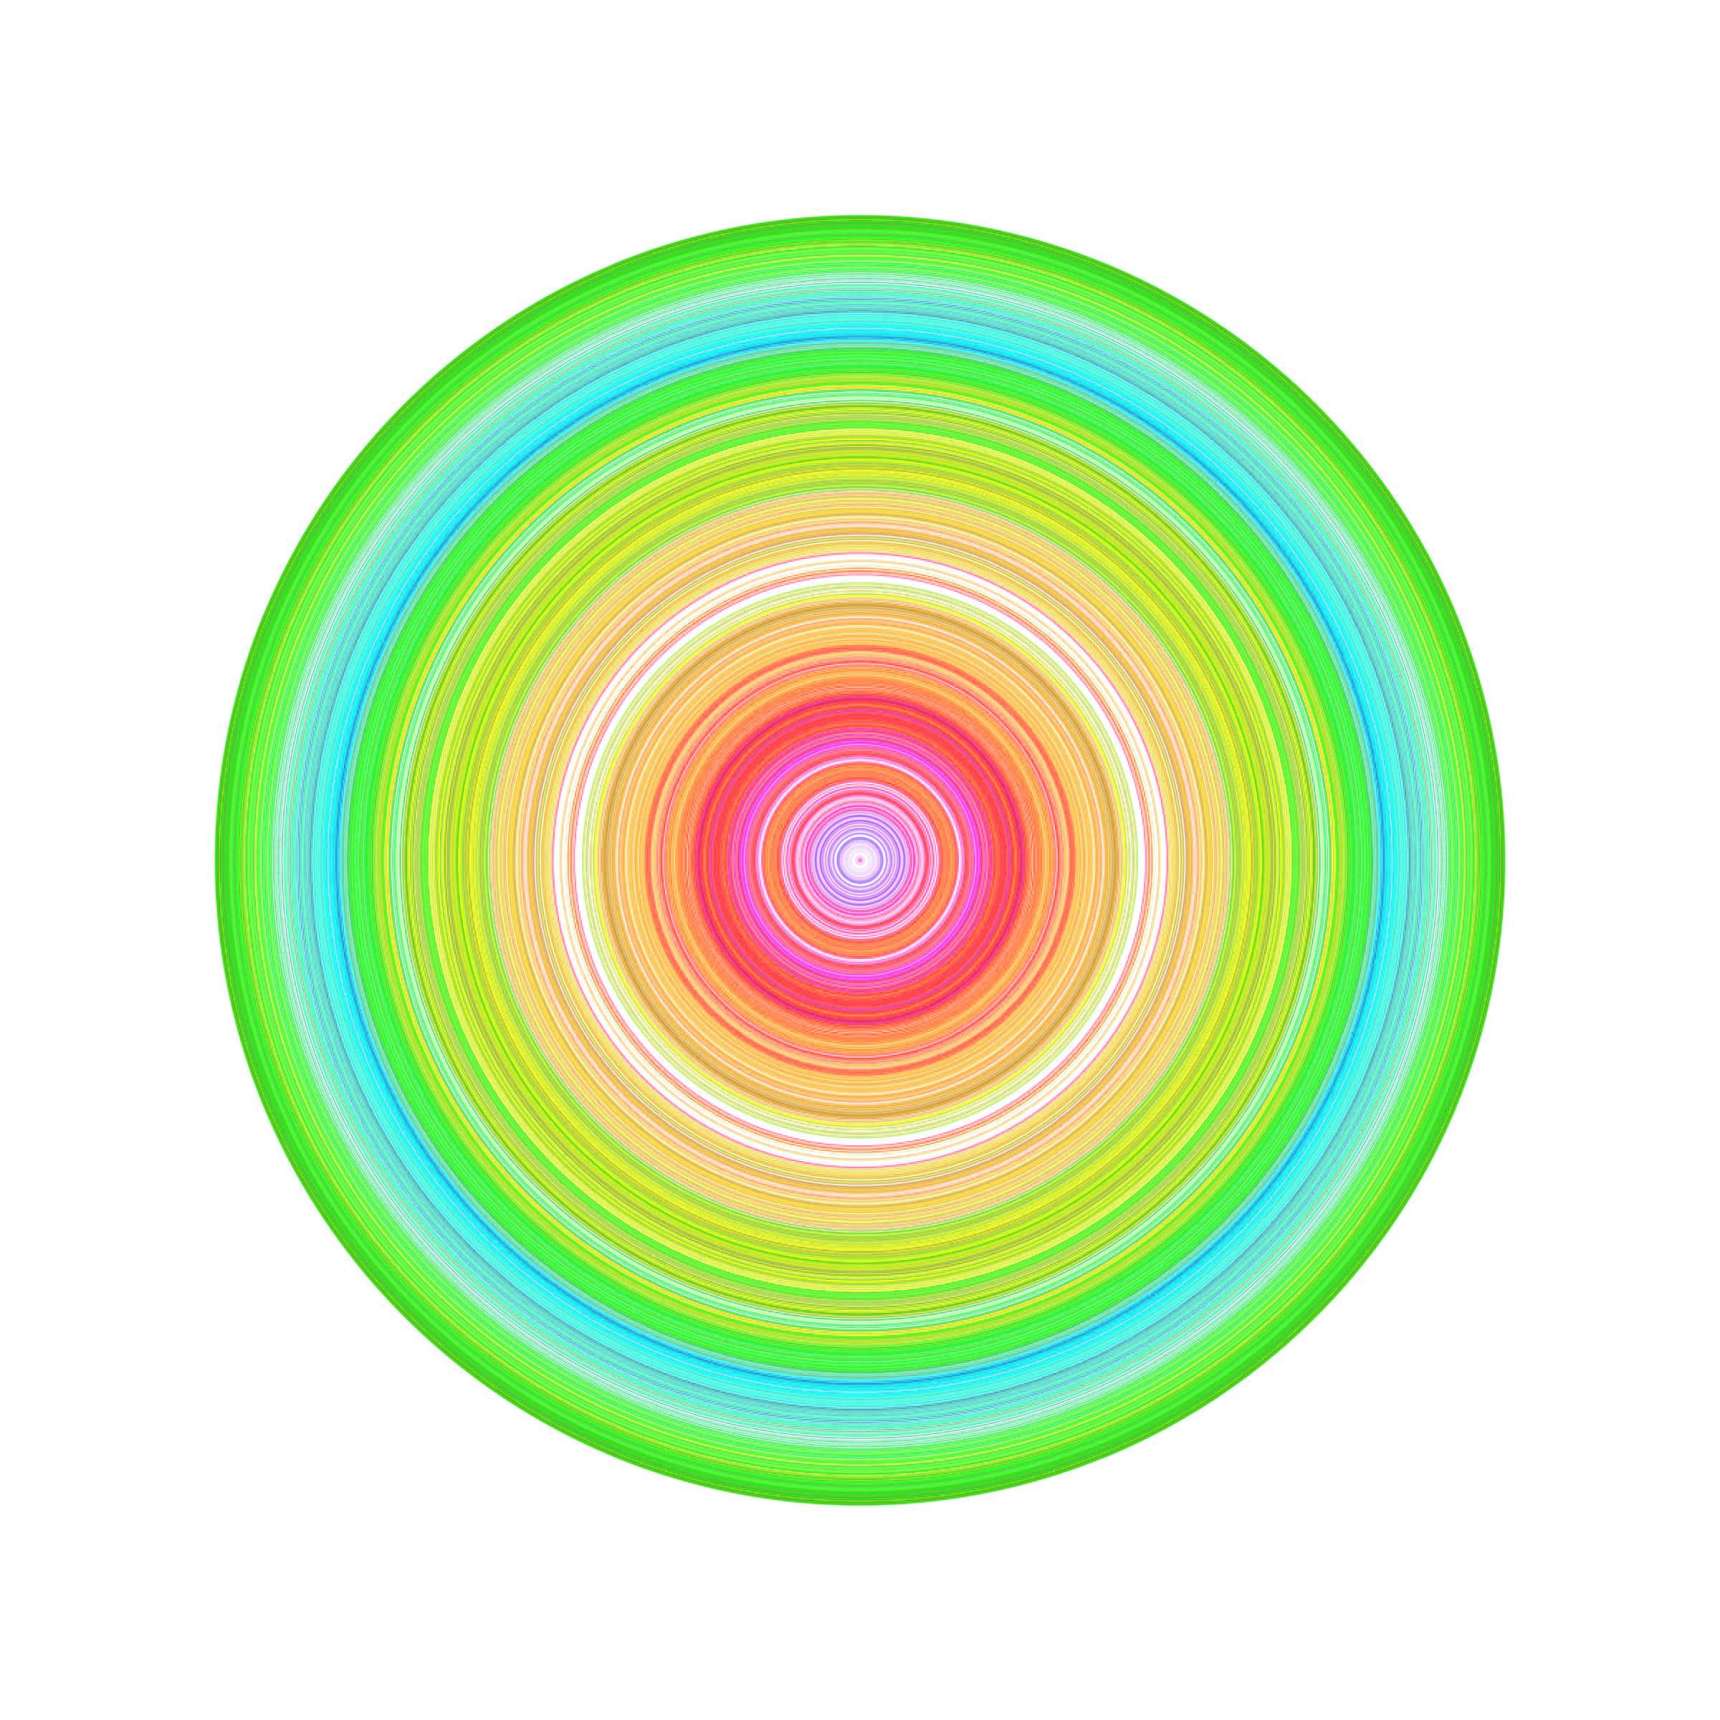

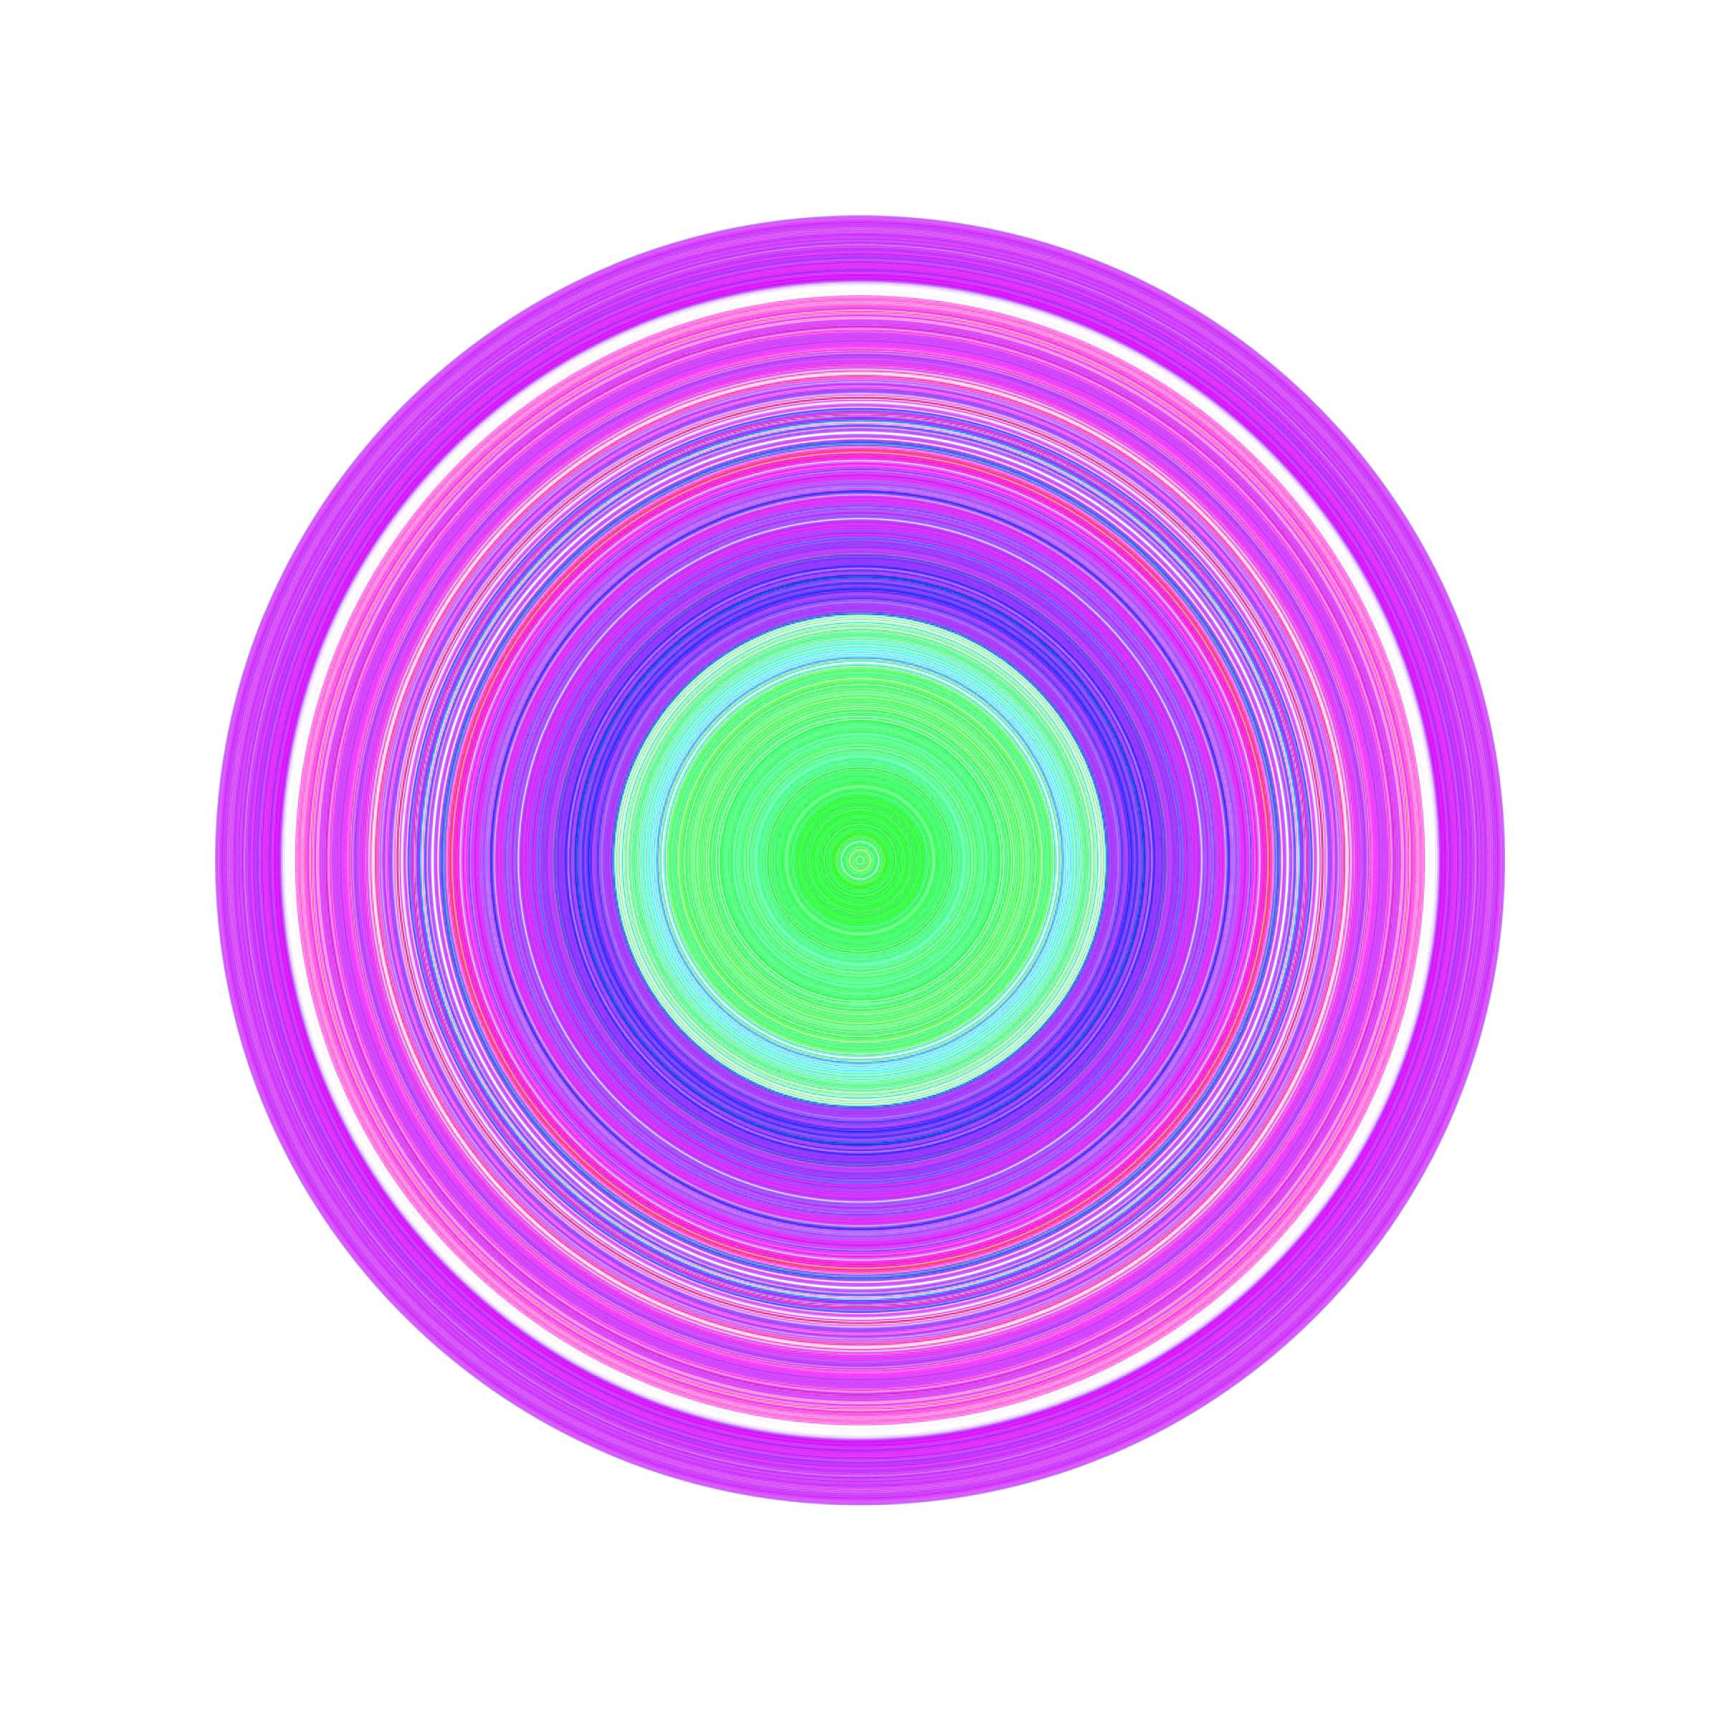


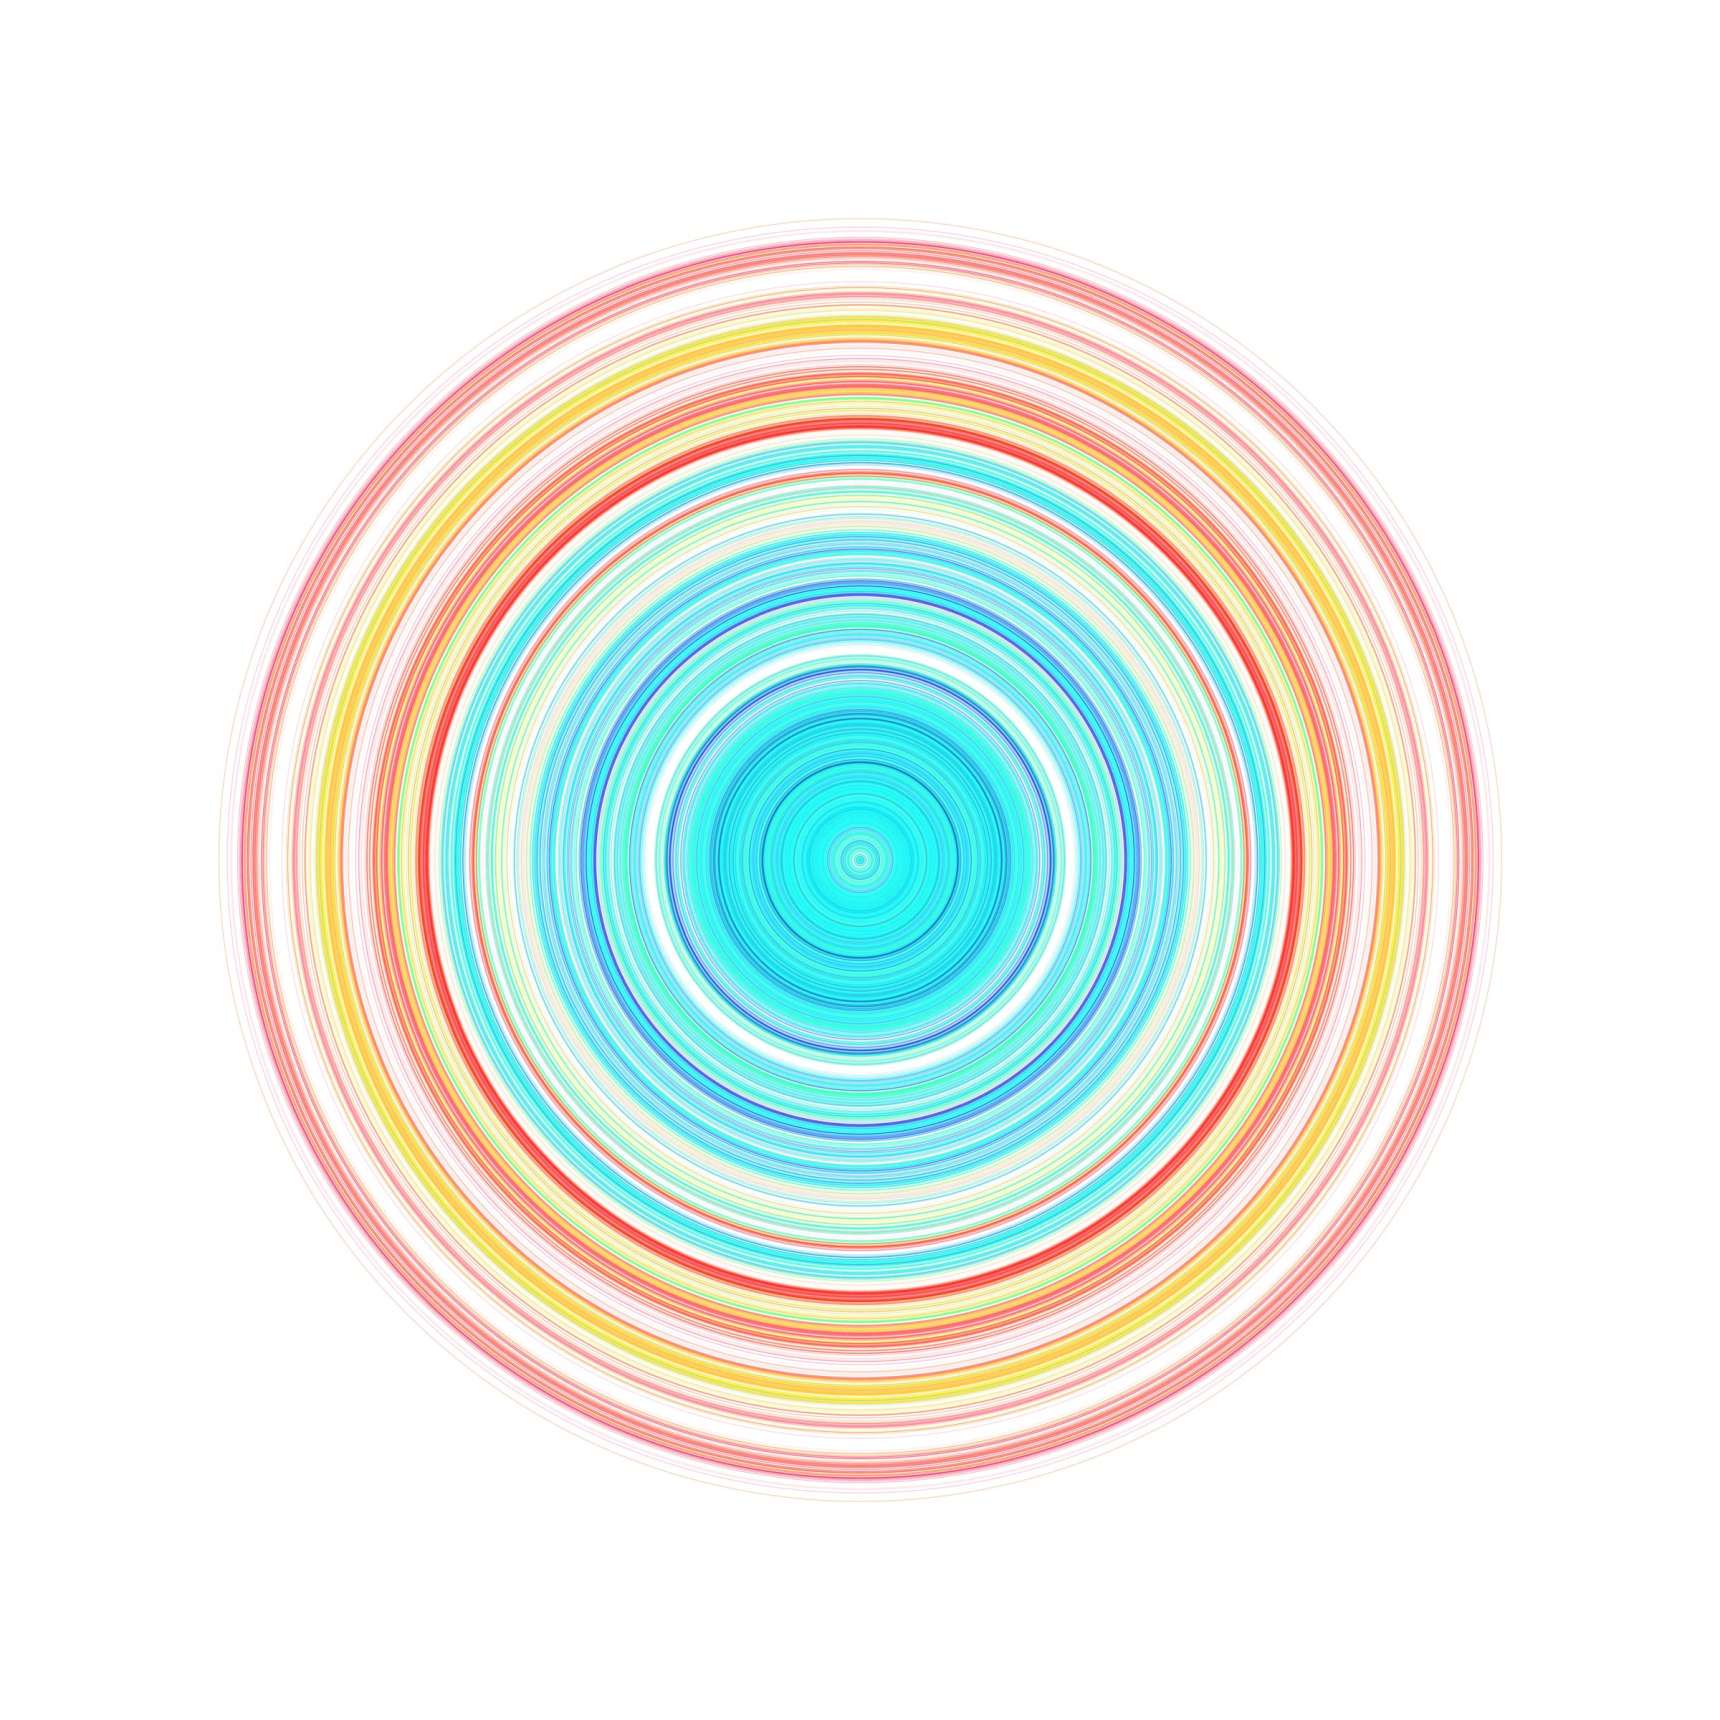


![Winds / September 11, 2010 / Greensboro, North Carolina / Process.2013.01 [ Detail ]](http://www.marknystrom.com/devmns/sites/default/files/styles/drimage_1720_0/public/2023-04/process_2013_01-2010_9_11-greensboro-detail.jpg?itok=lspuVMCf)
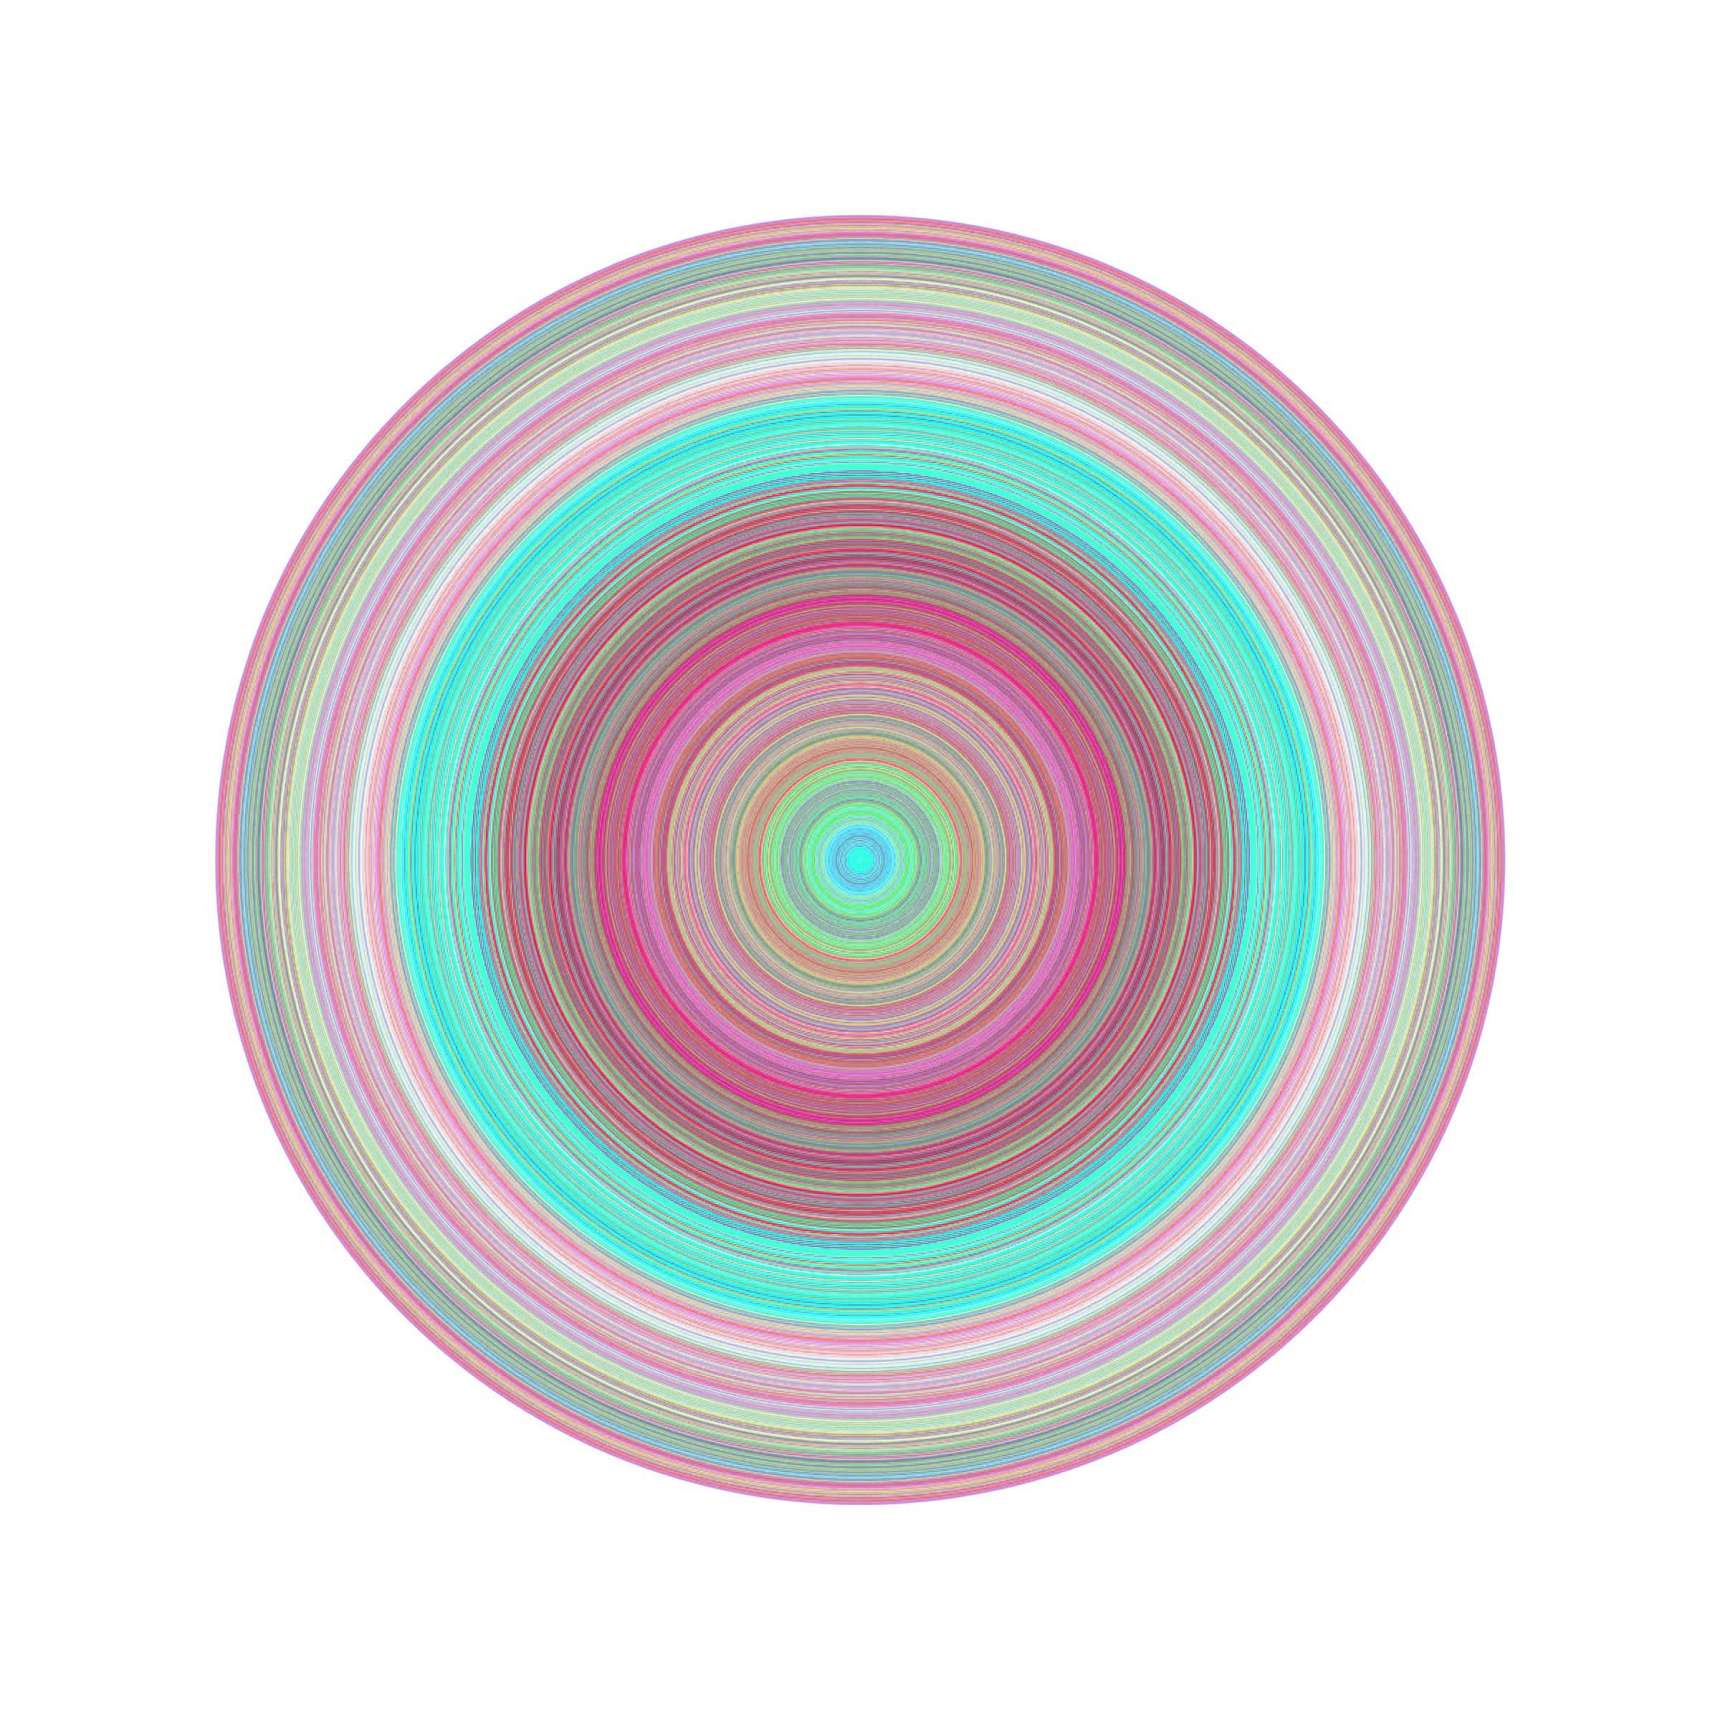
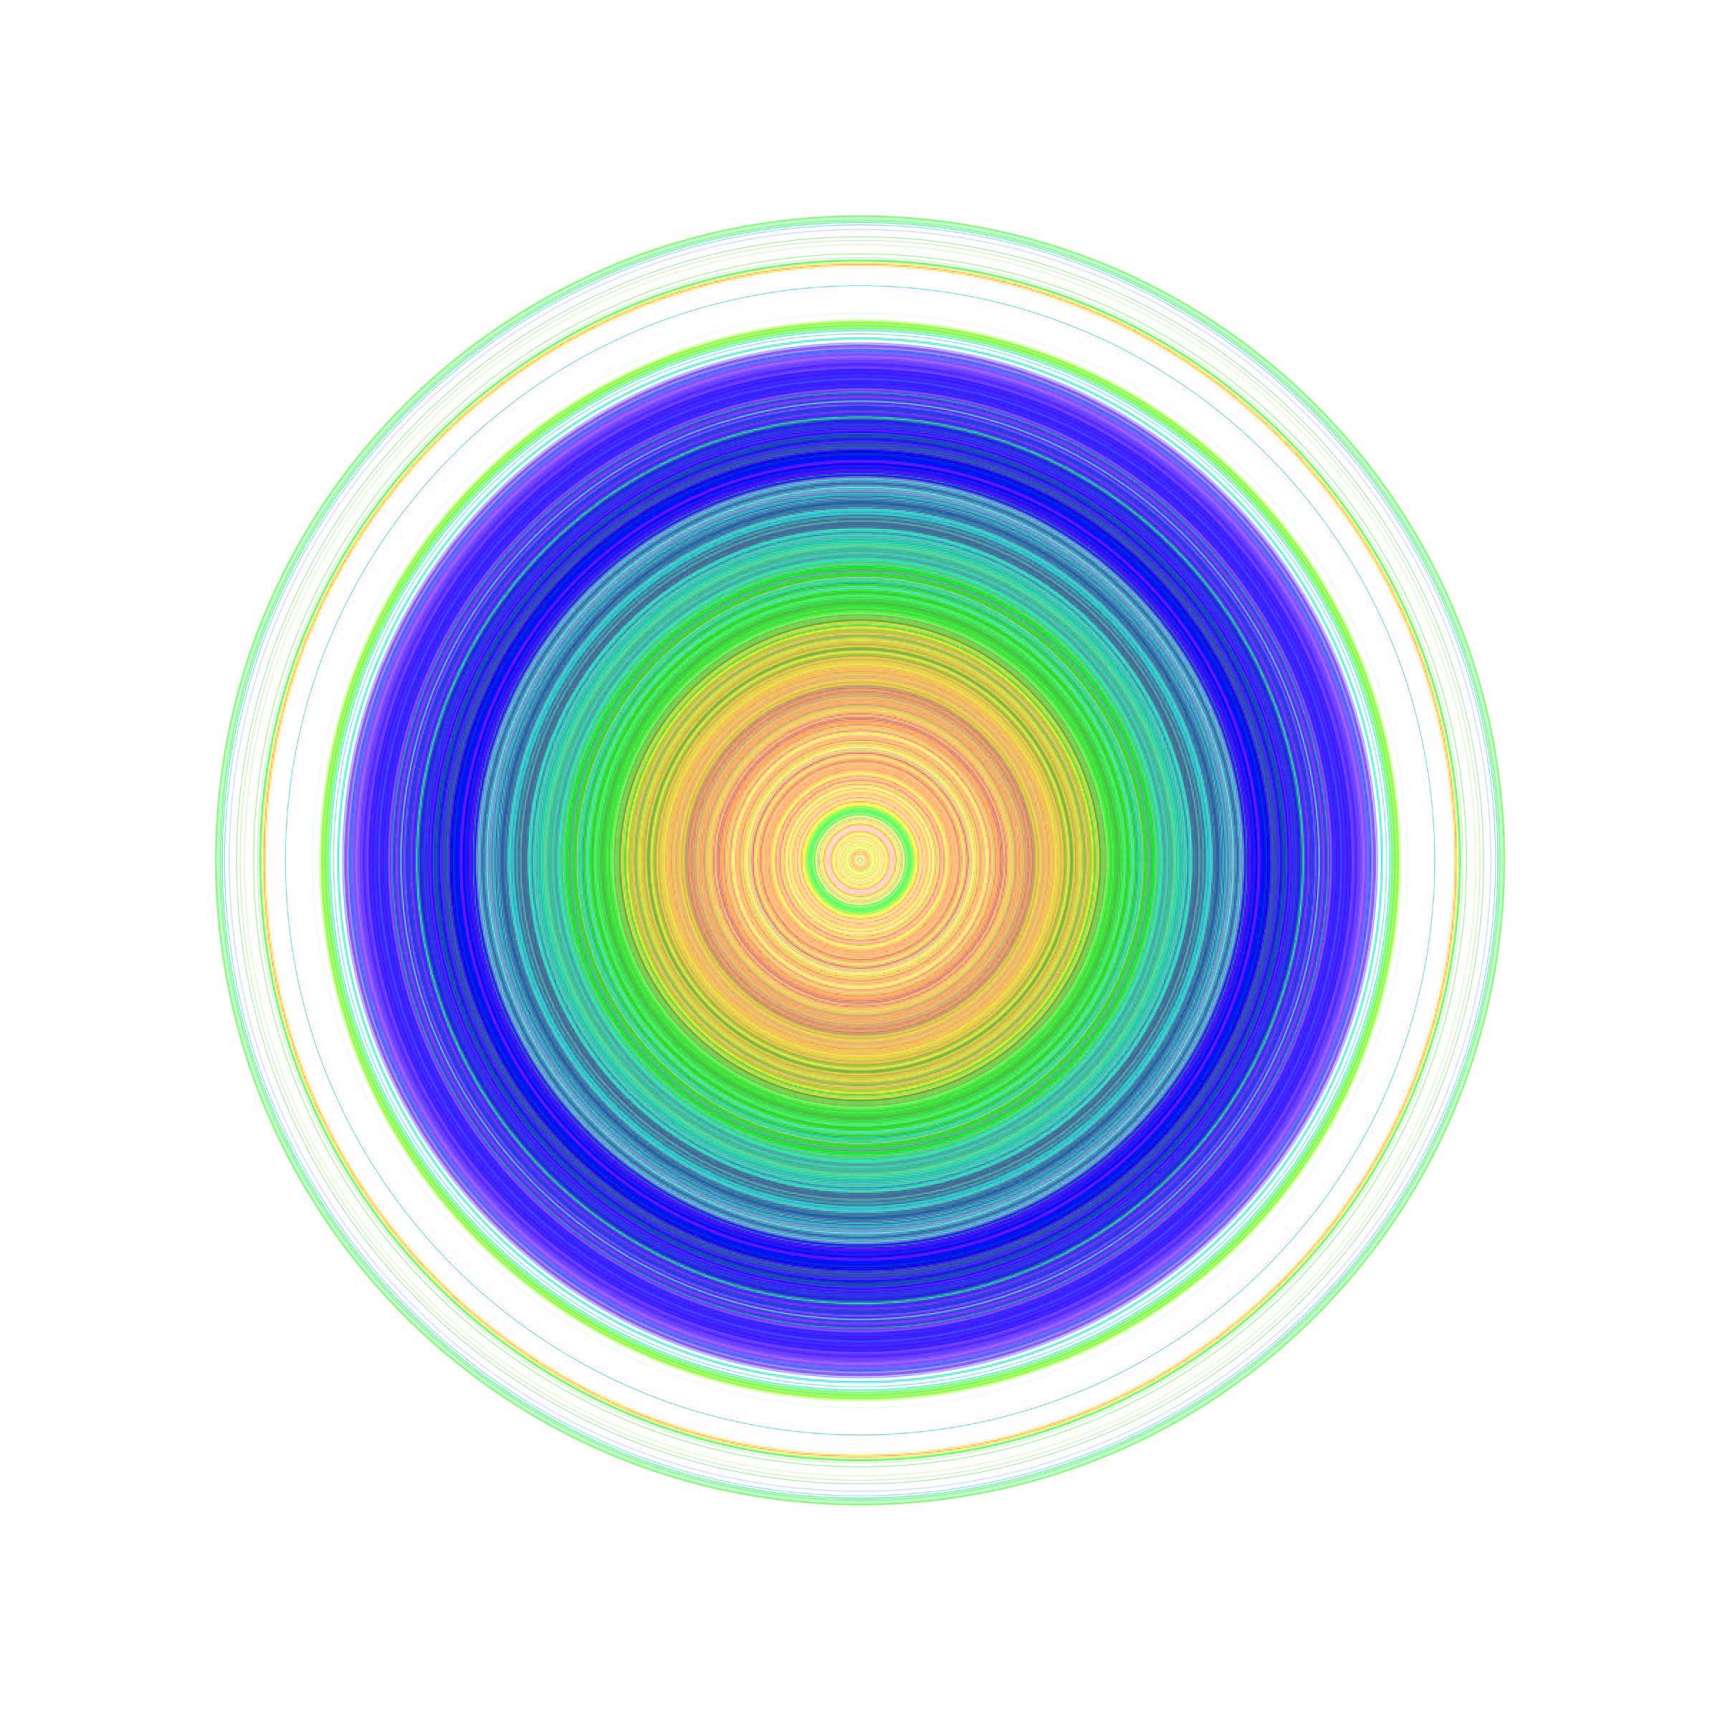
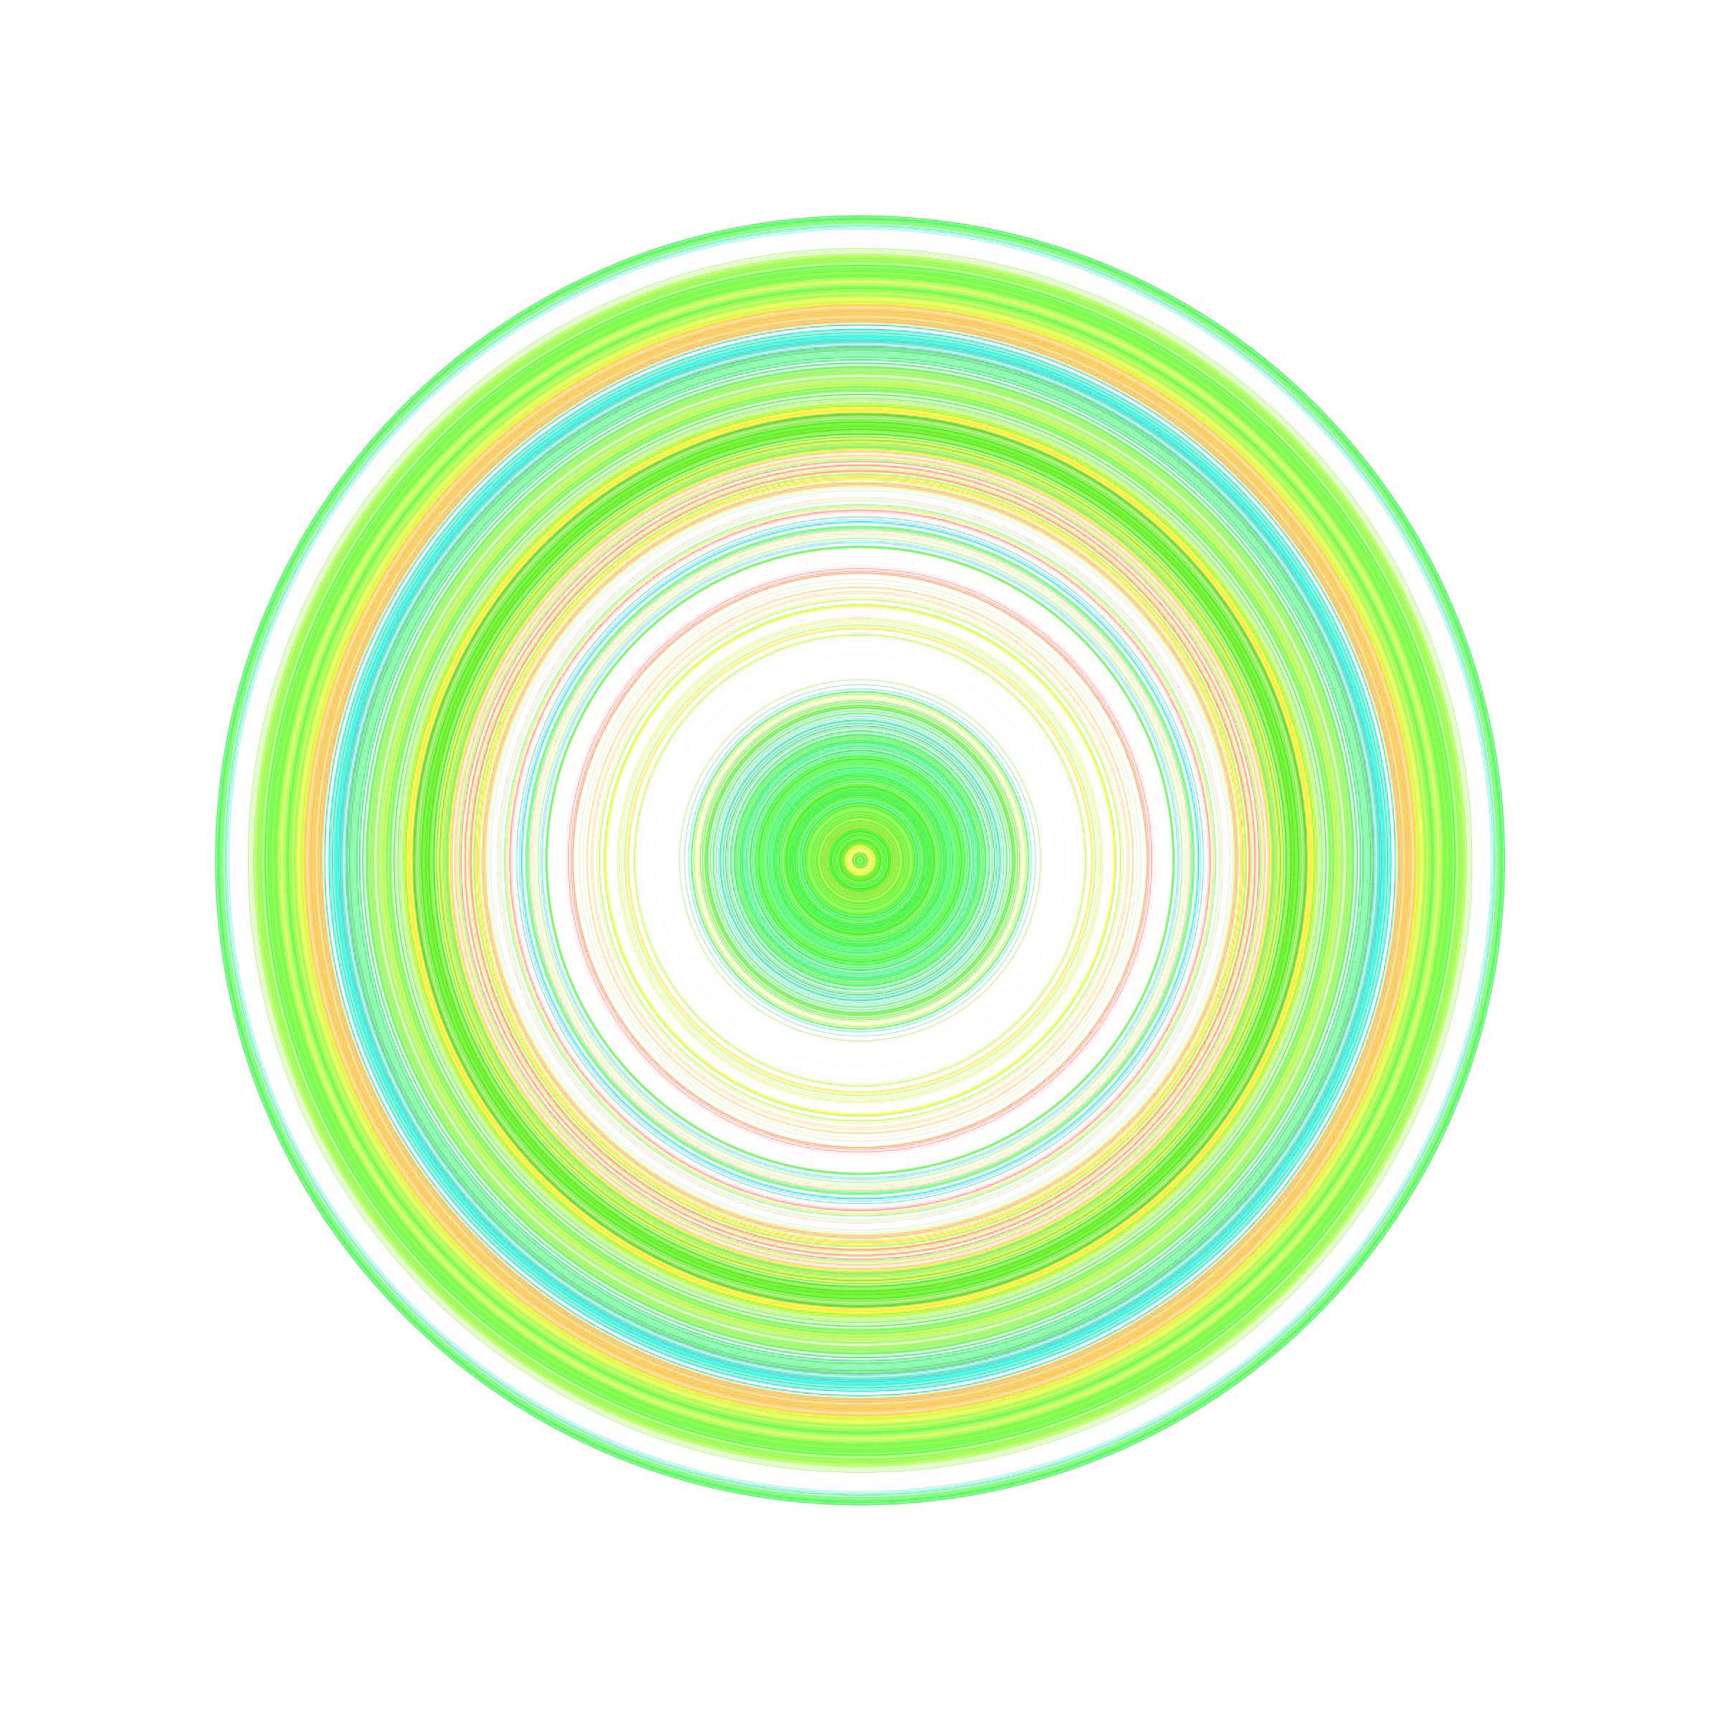
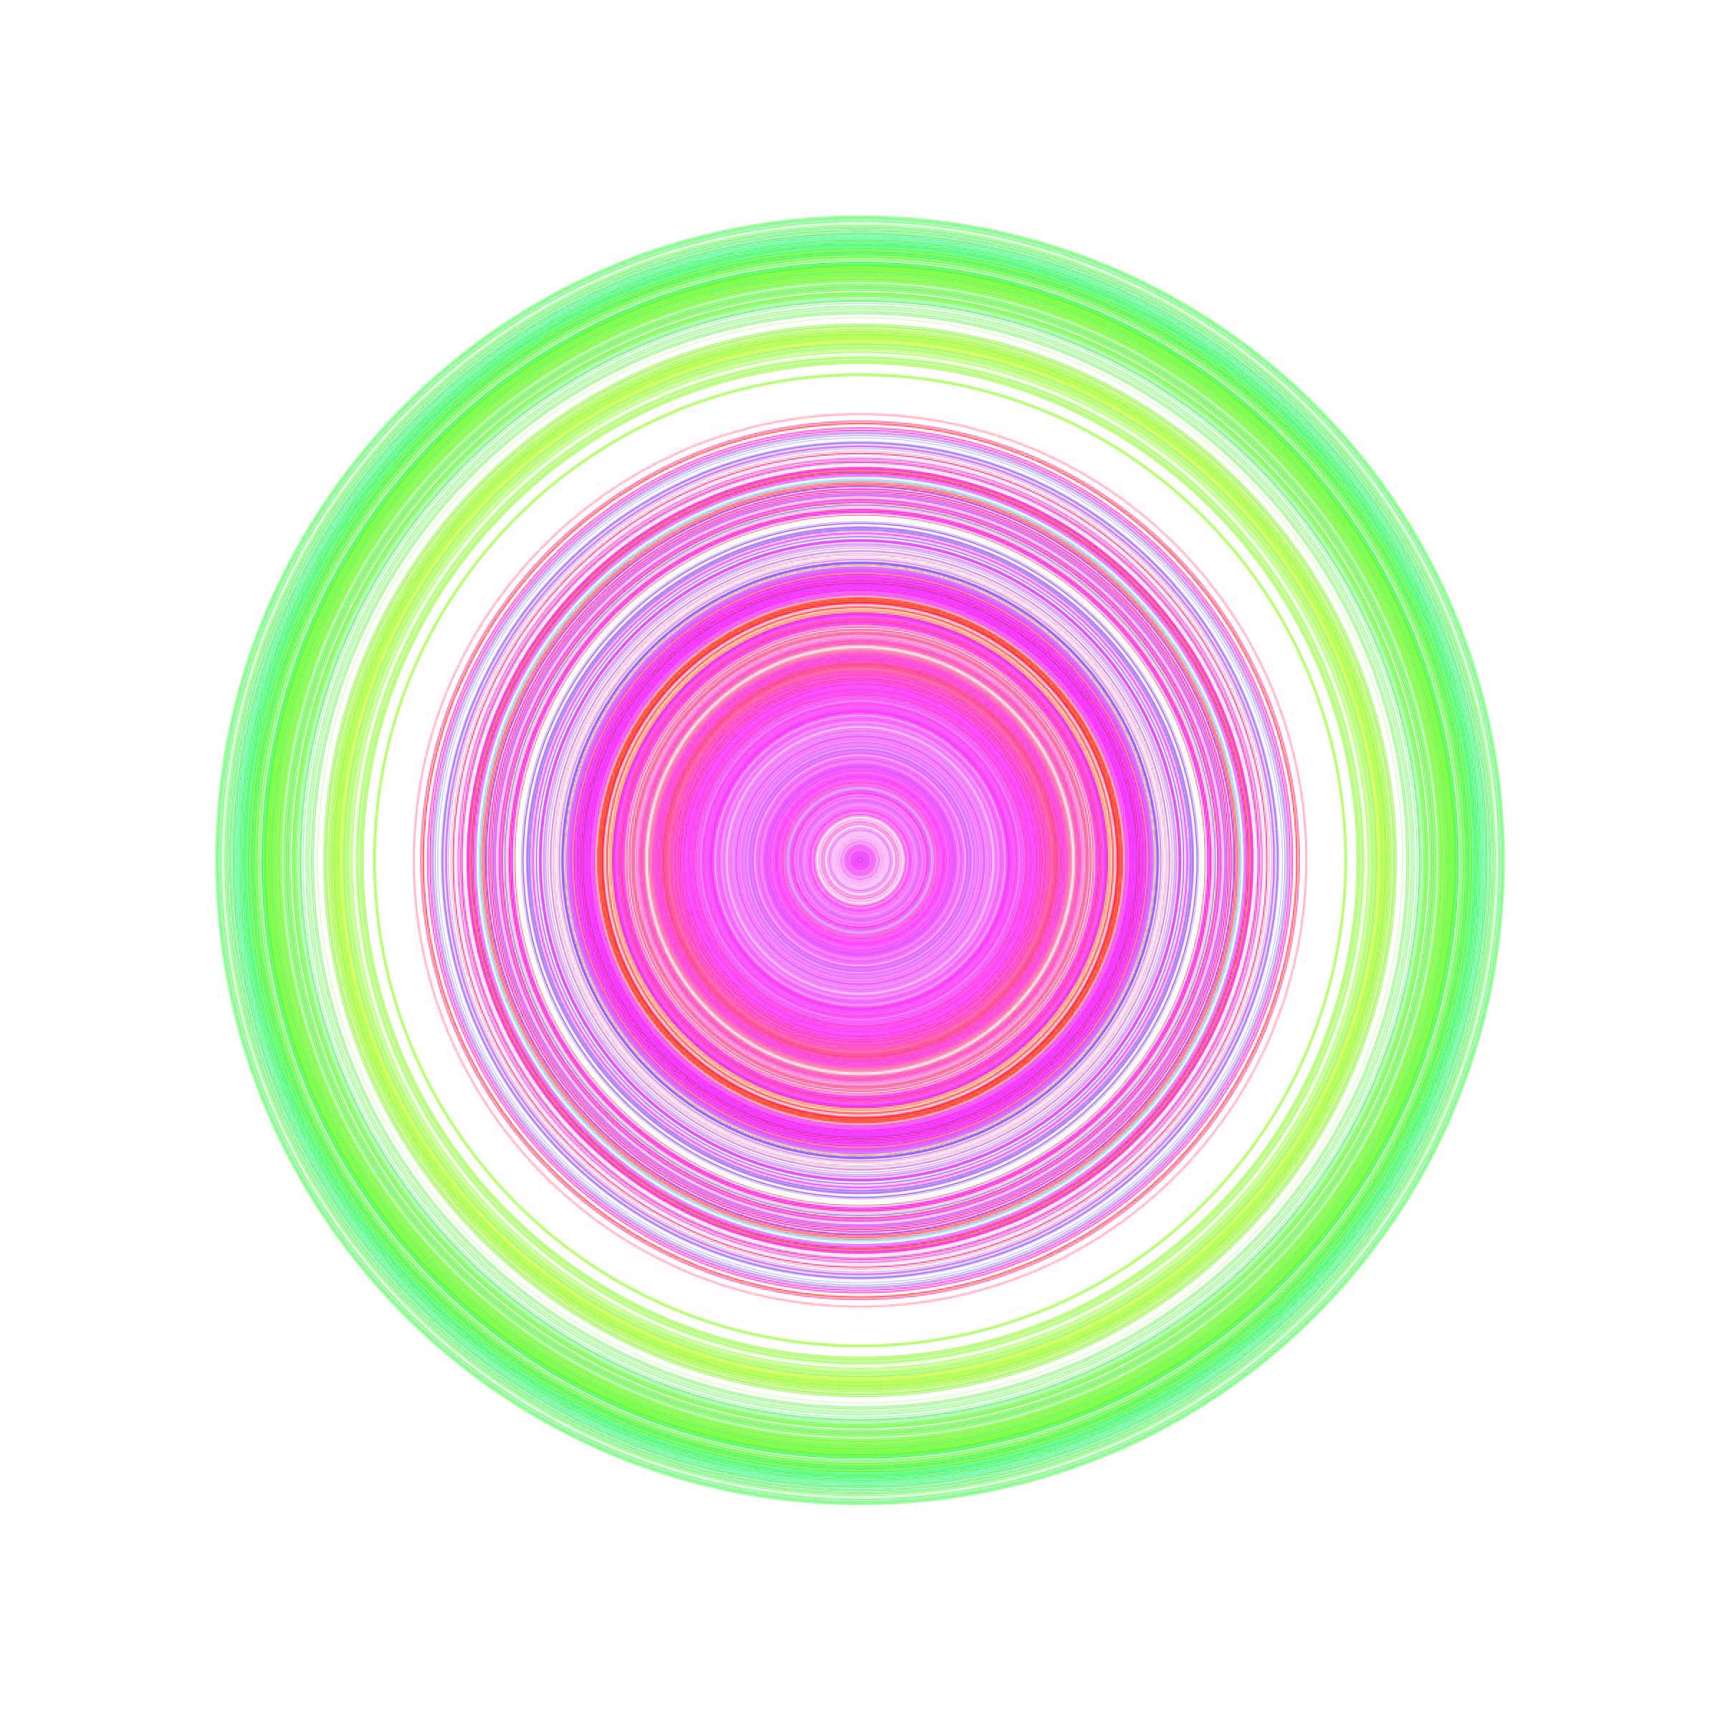
![Winds / September 26, 2010 / Greensboro, North Carolina / Process.2013.01 [ Detail ]](http://www.marknystrom.com/devmns/sites/default/files/styles/drimage_1720_0/public/2023-04/process_2013_01-2010_9_26-greensboro-detail.jpg?itok=FiR5bpKn)
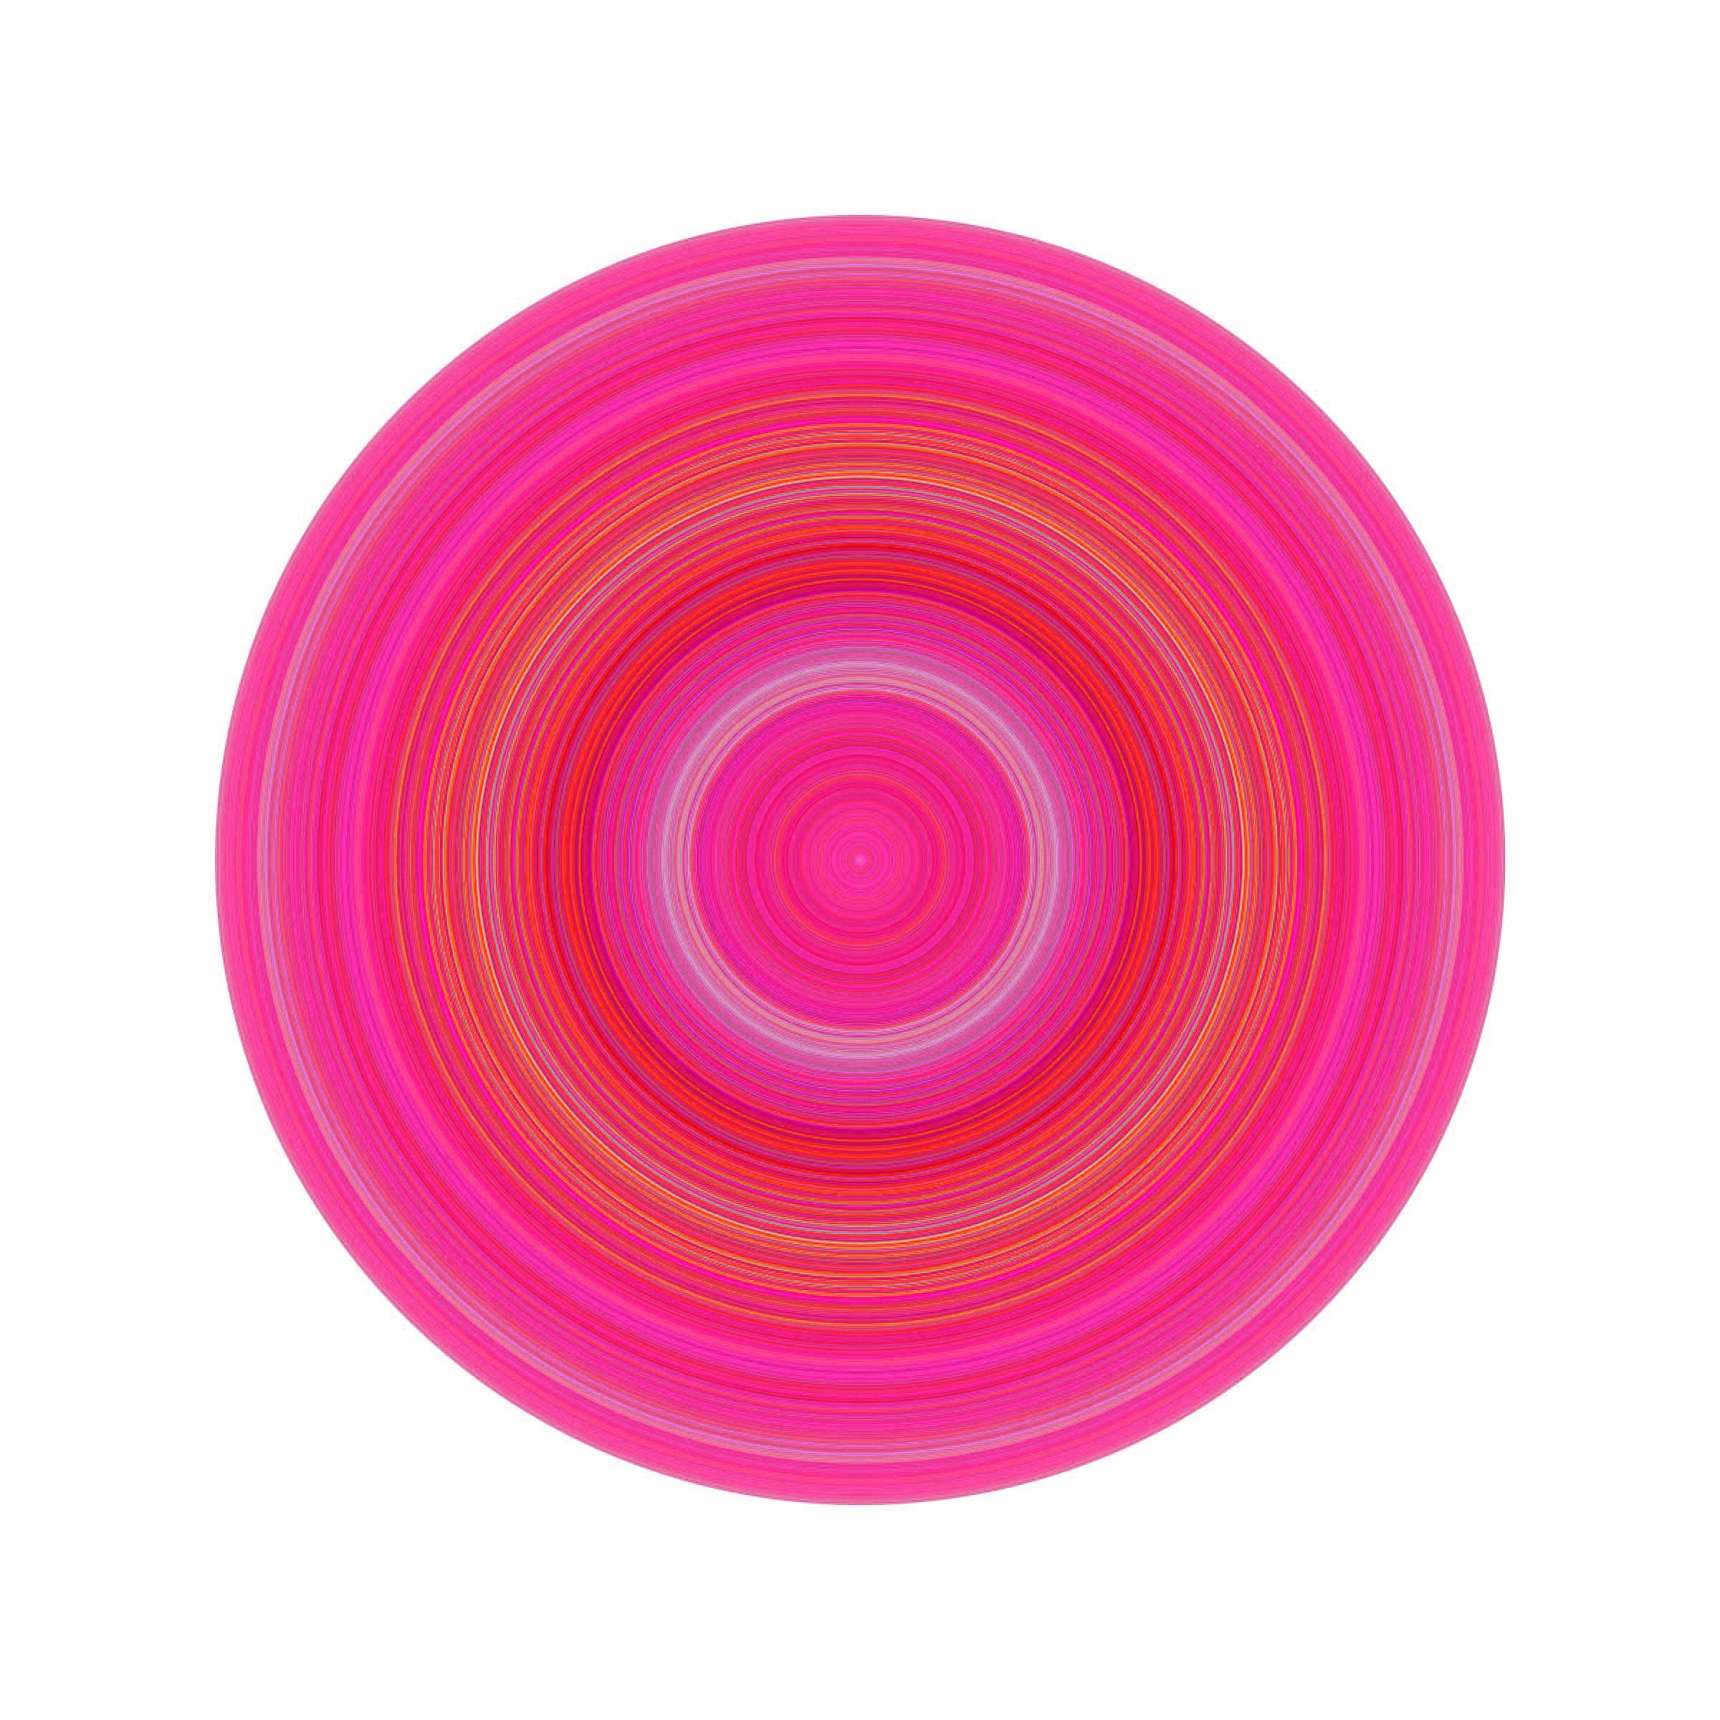
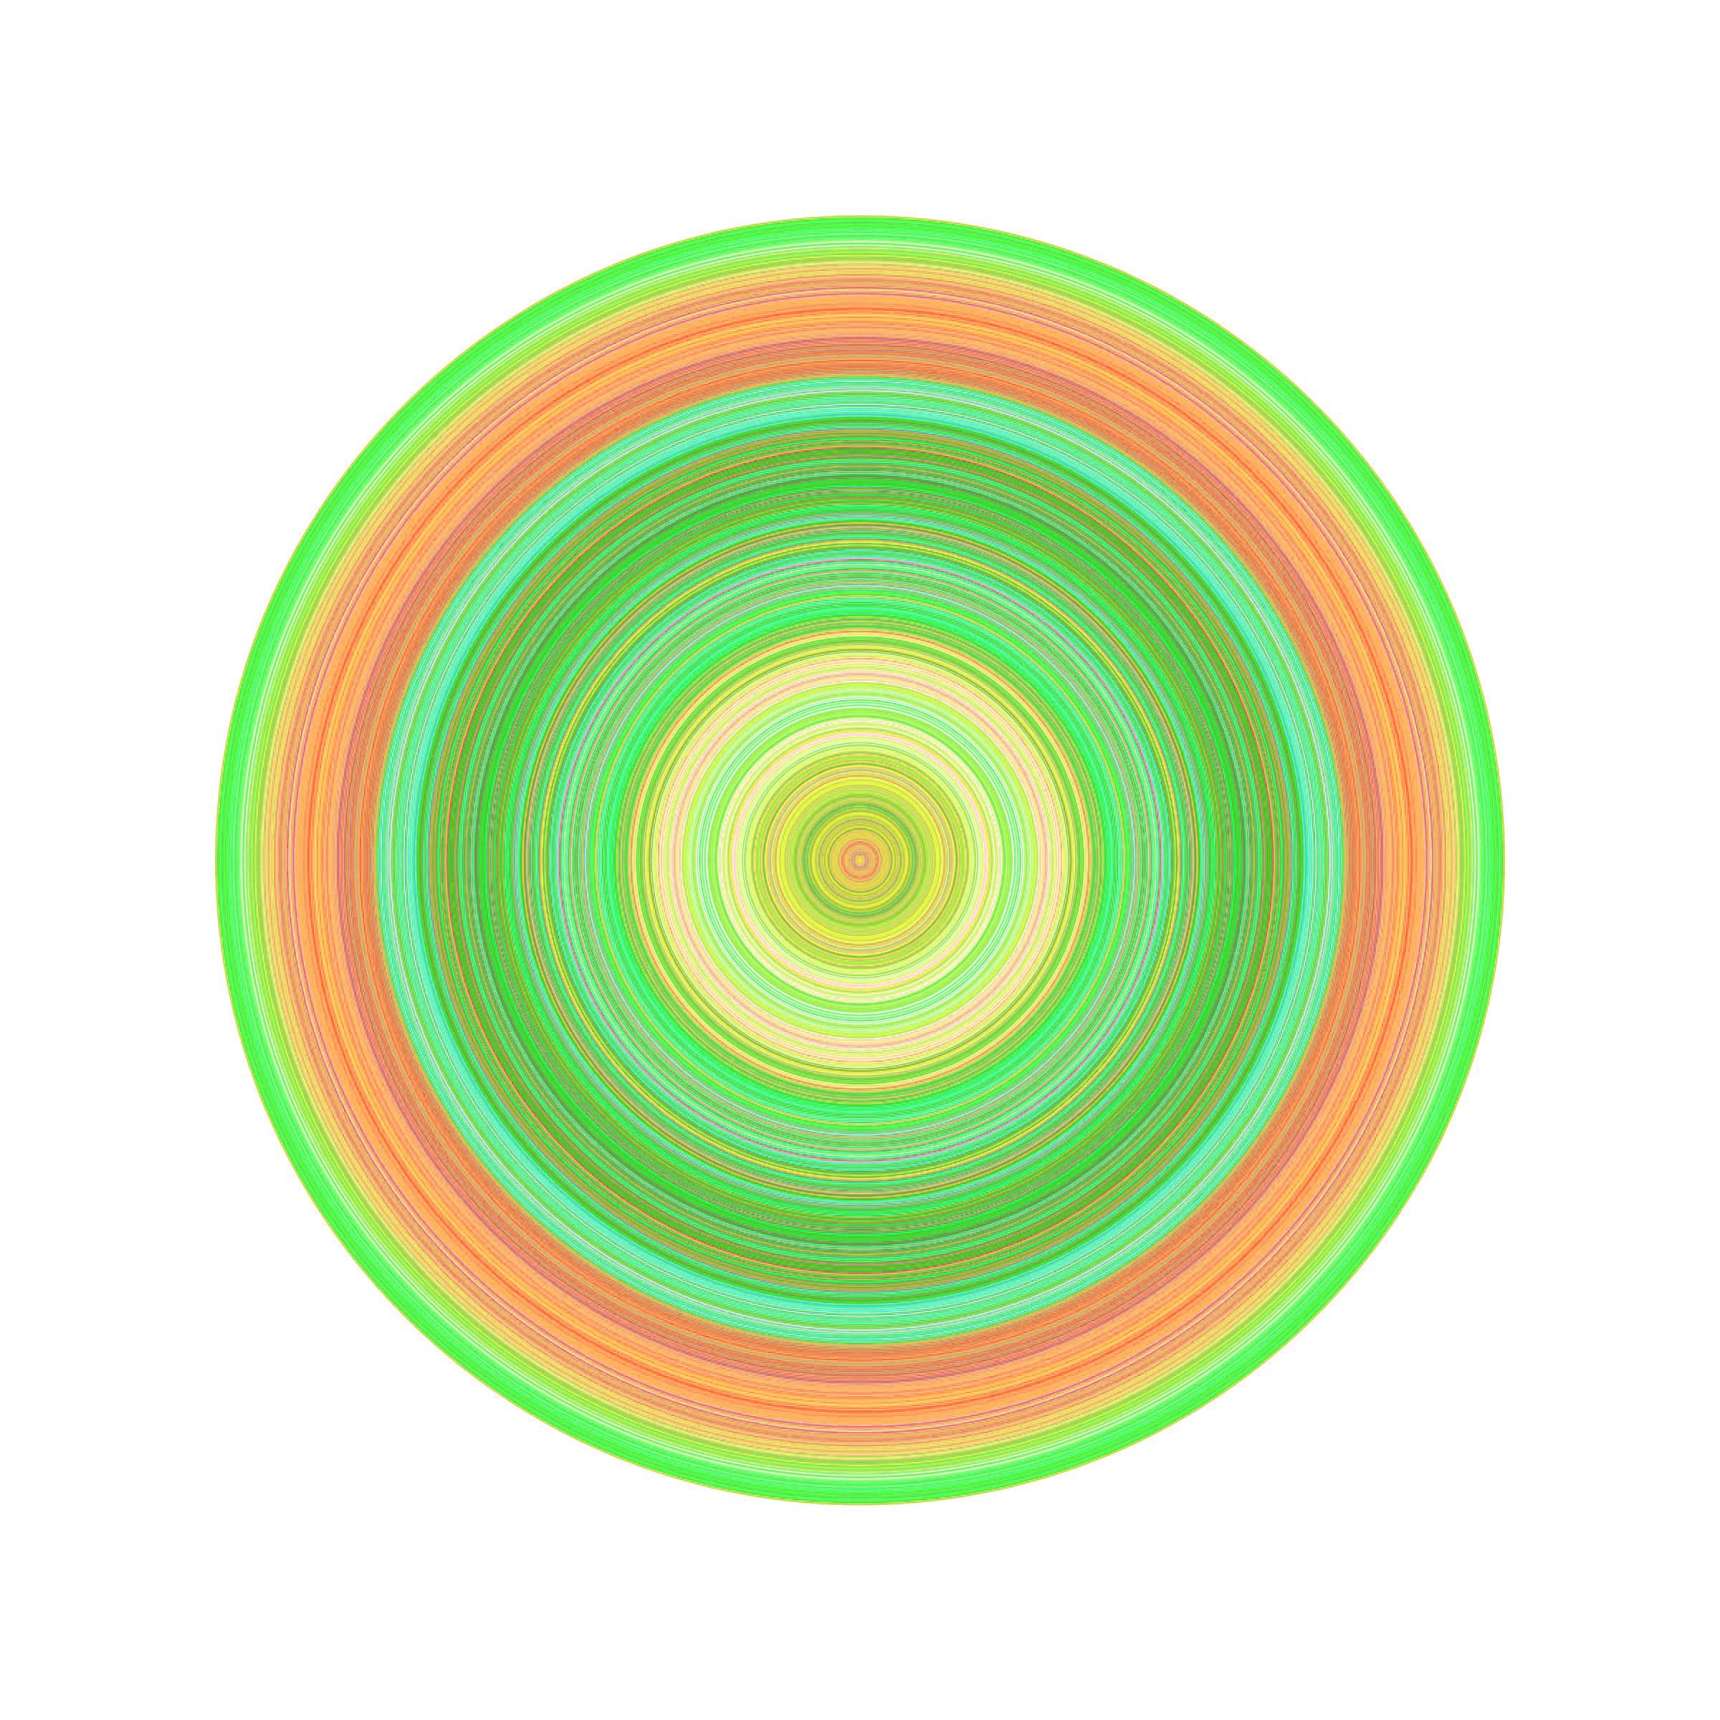
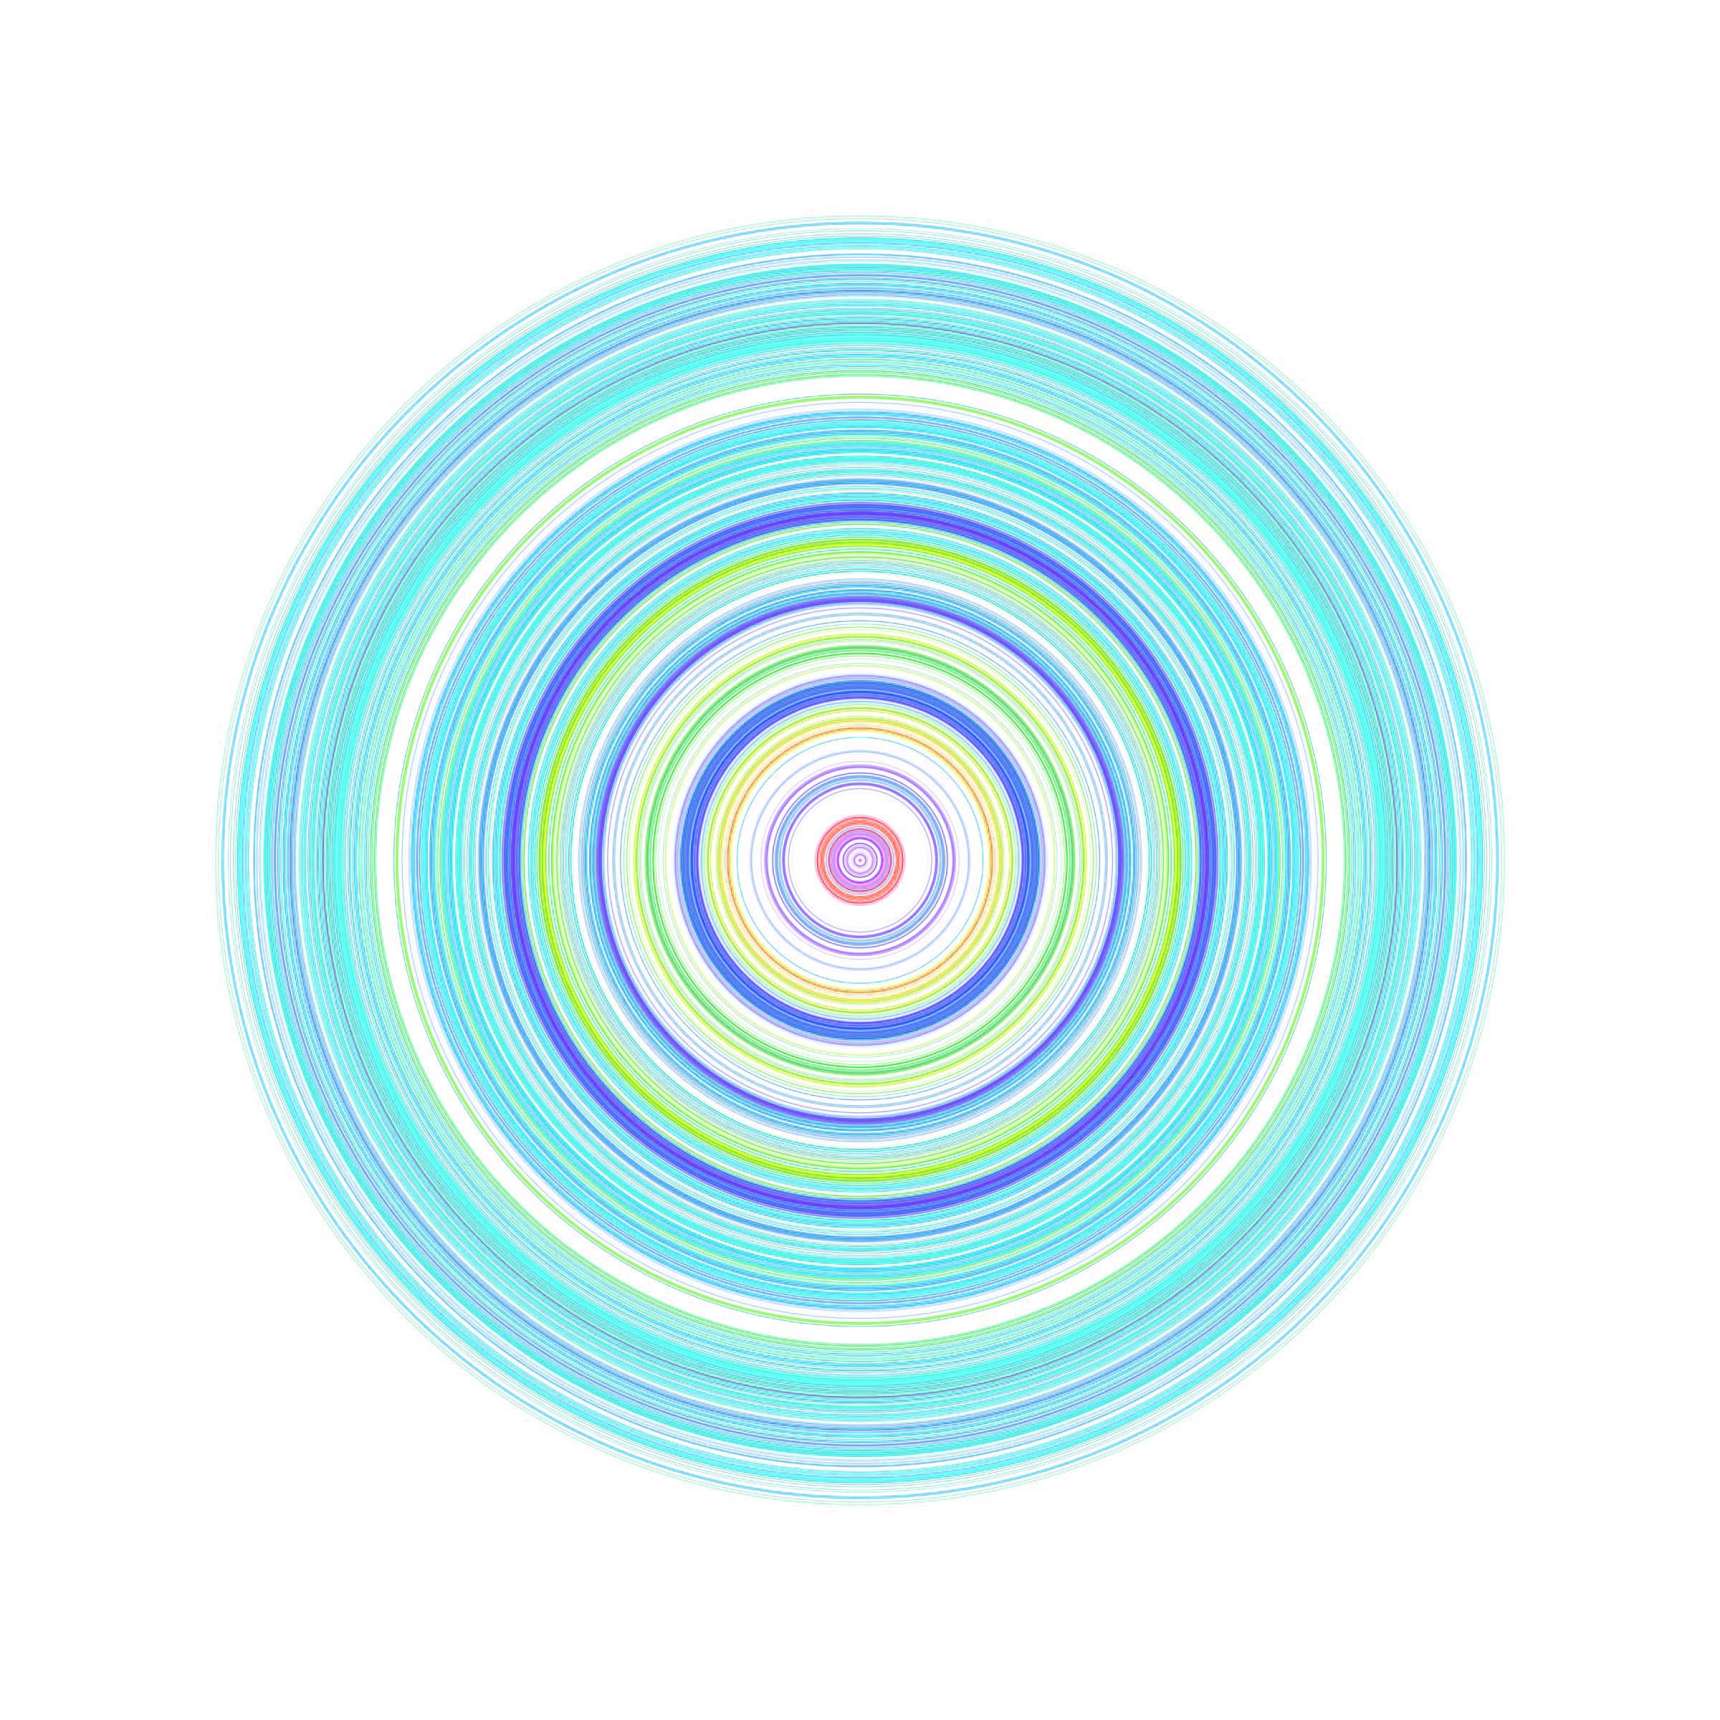
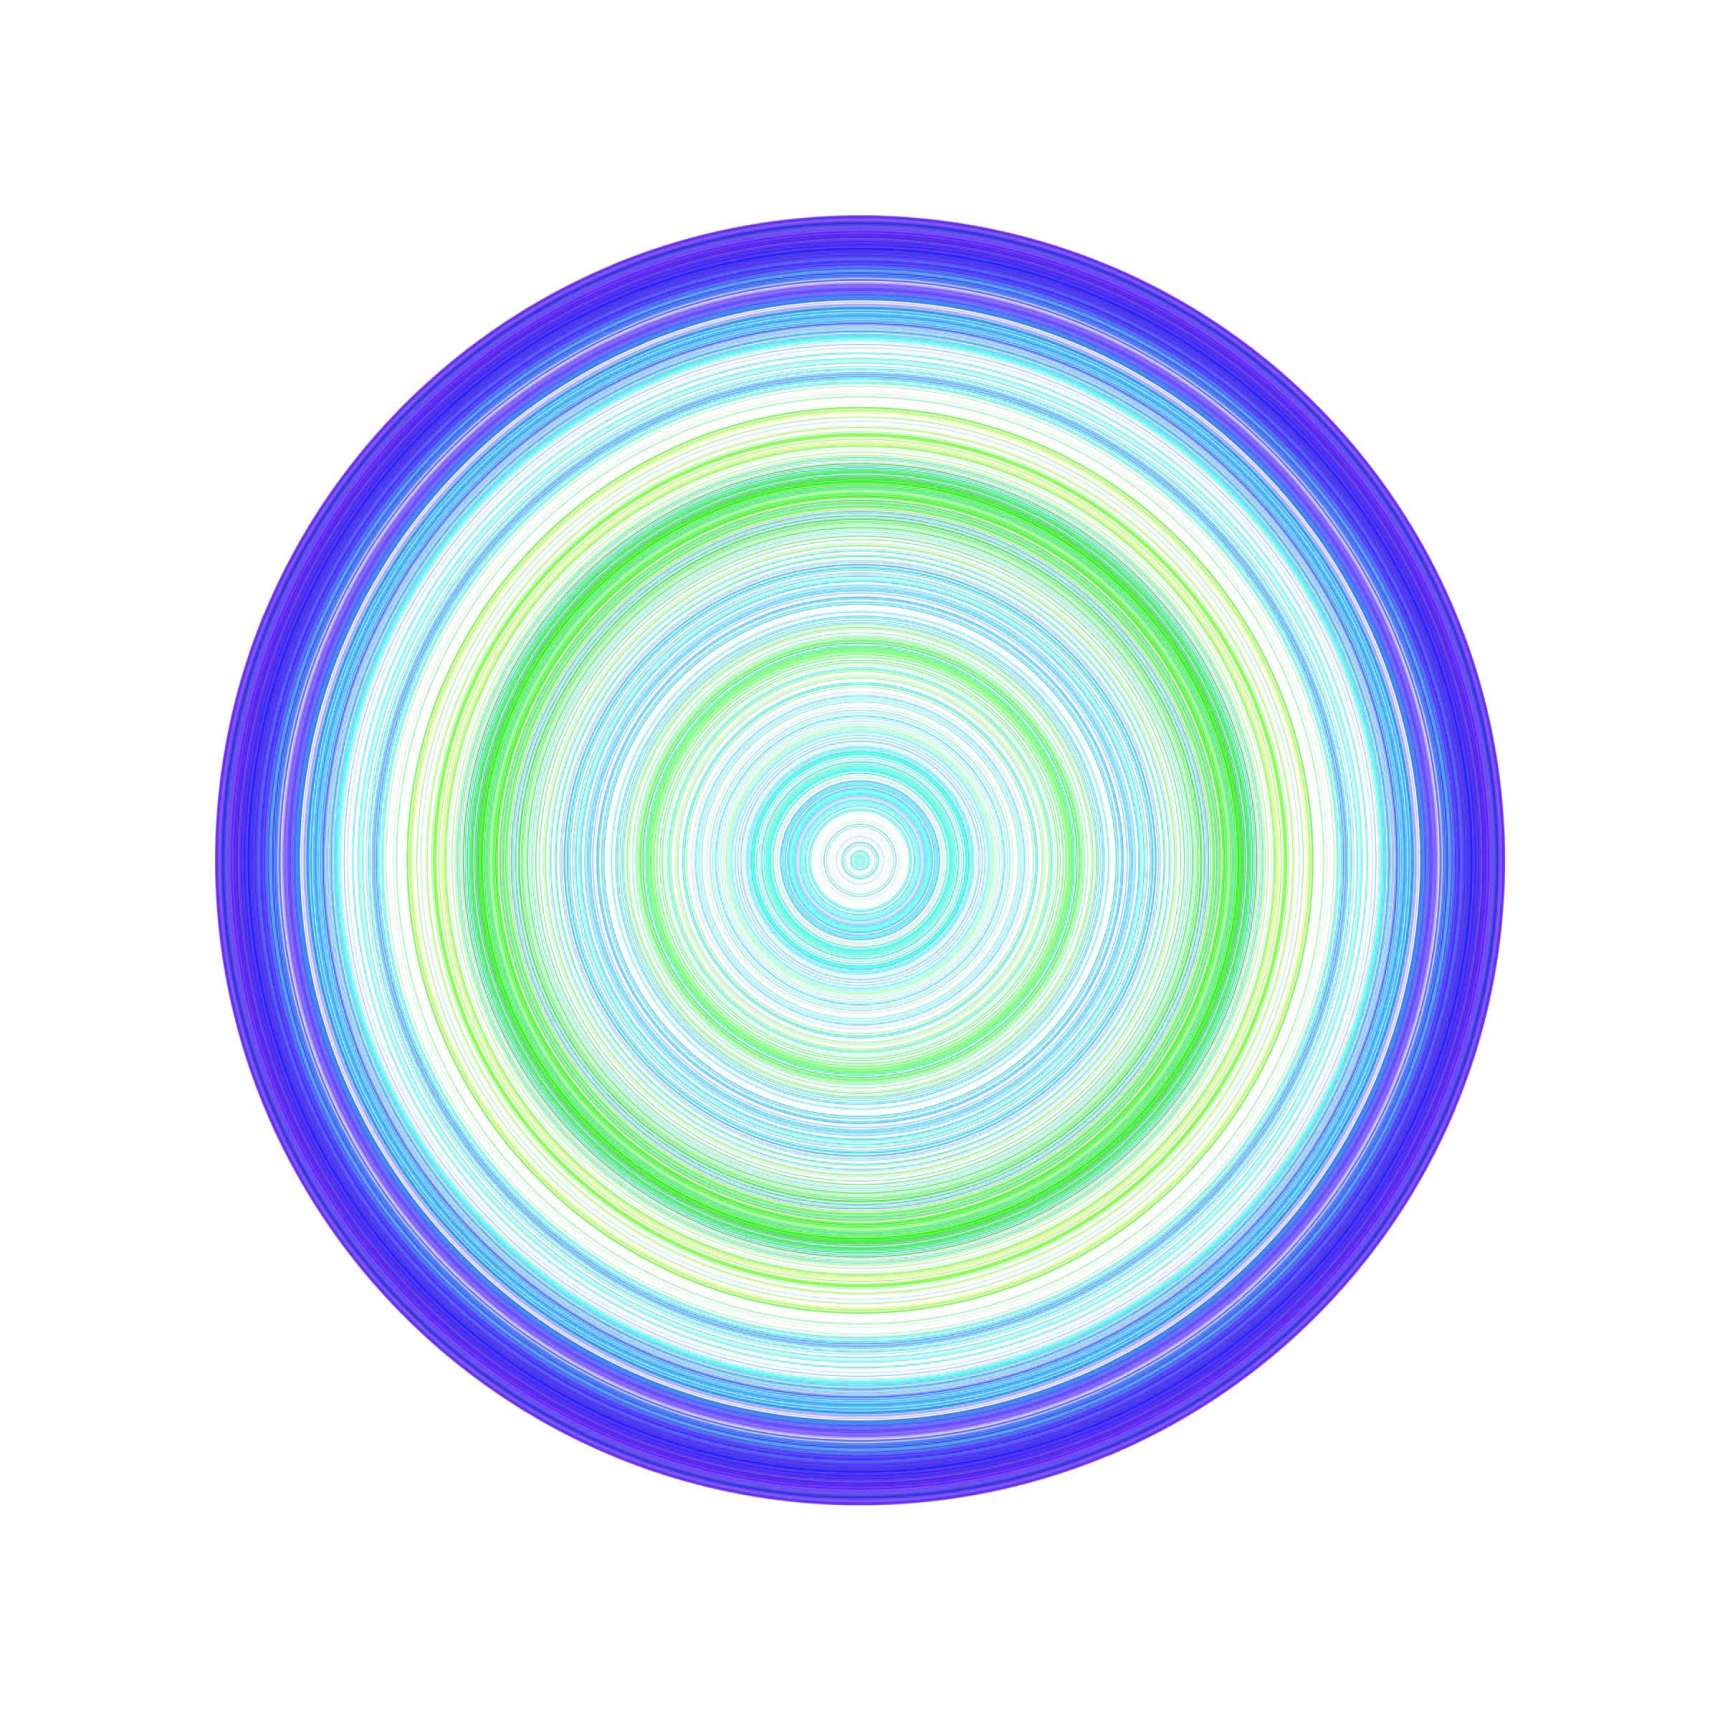
![Winds / September 20, 2010 / Greensboro, North Carolina / Process.2013.01 [ Detail ]](http://www.marknystrom.com/devmns/sites/default/files/styles/drimage_1720_0/public/2023-04/process_2013_01-2010_9_20-greensboro-detail.jpg?itok=jy4EIShe)
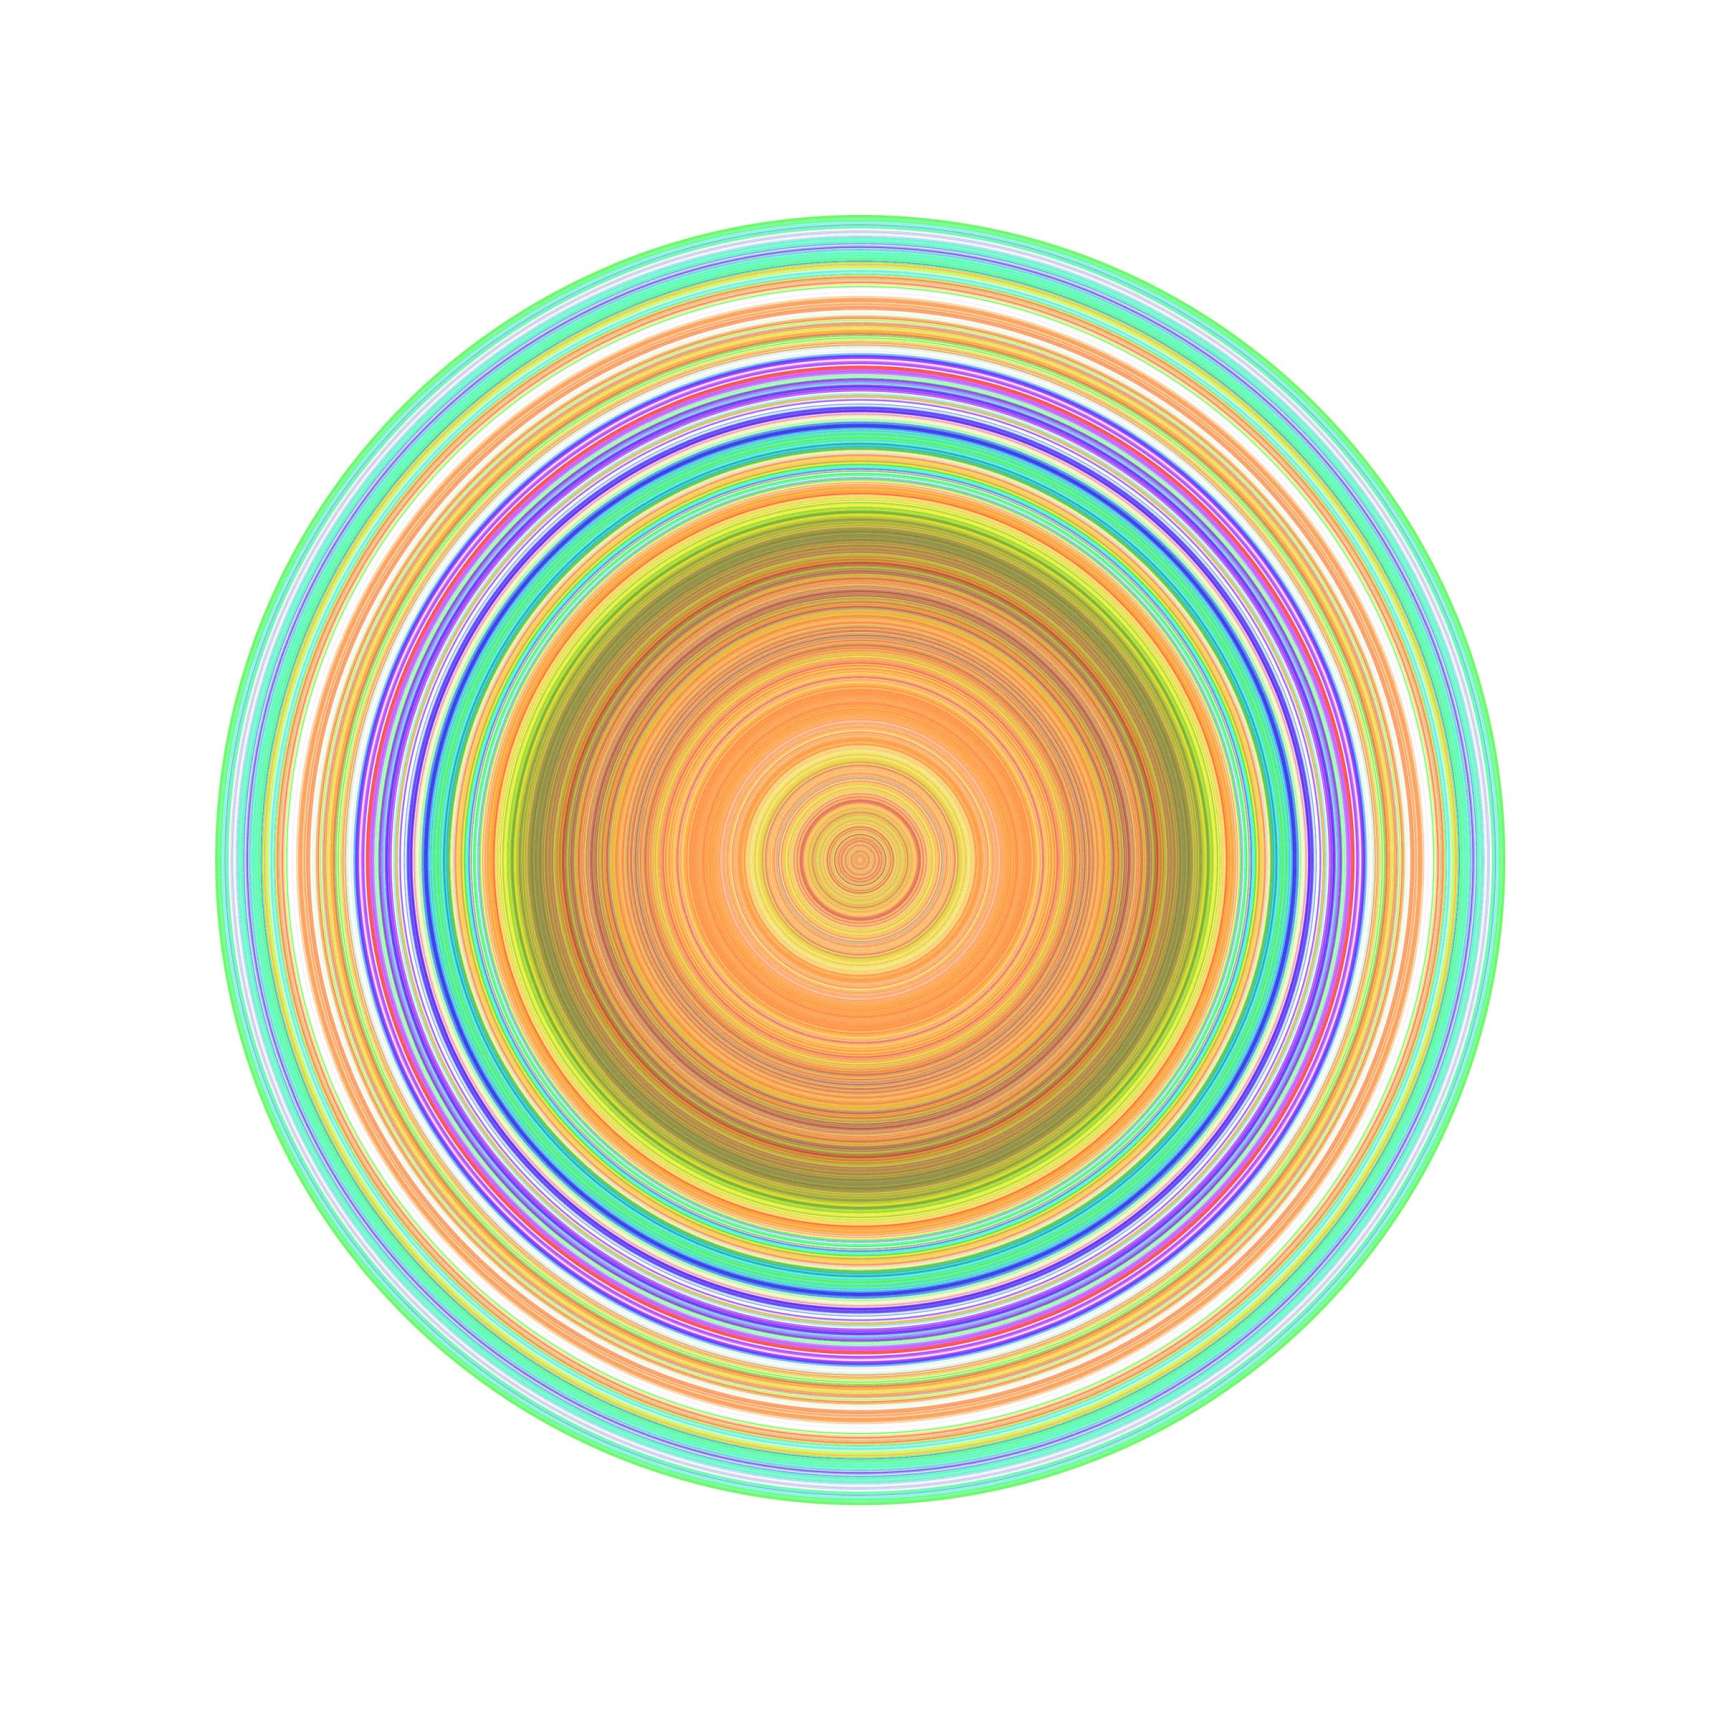
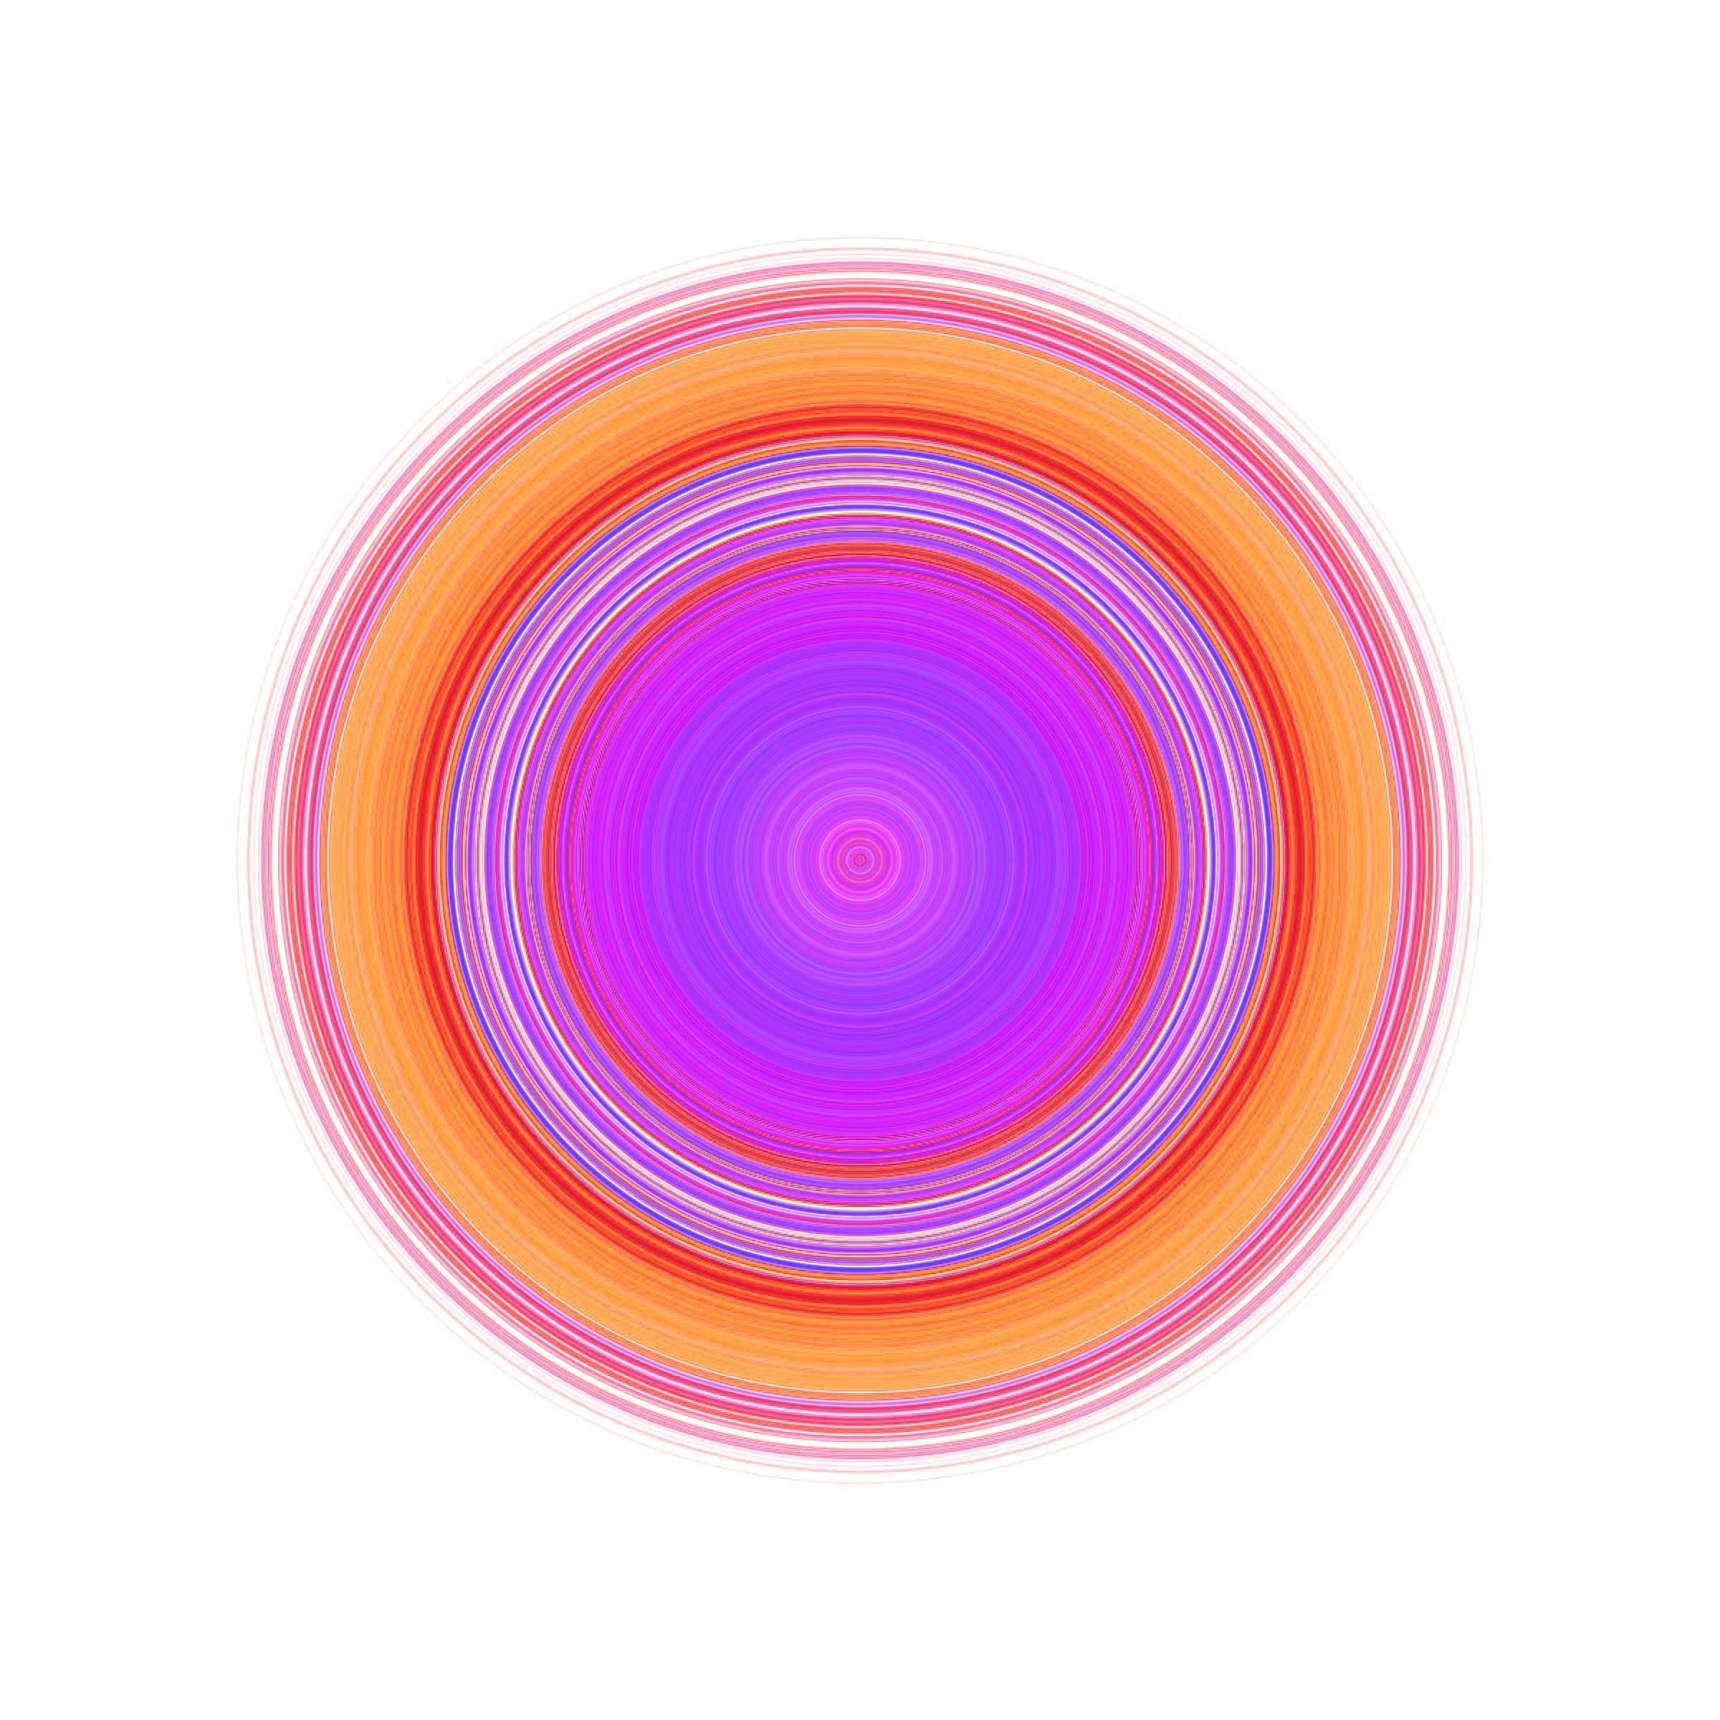
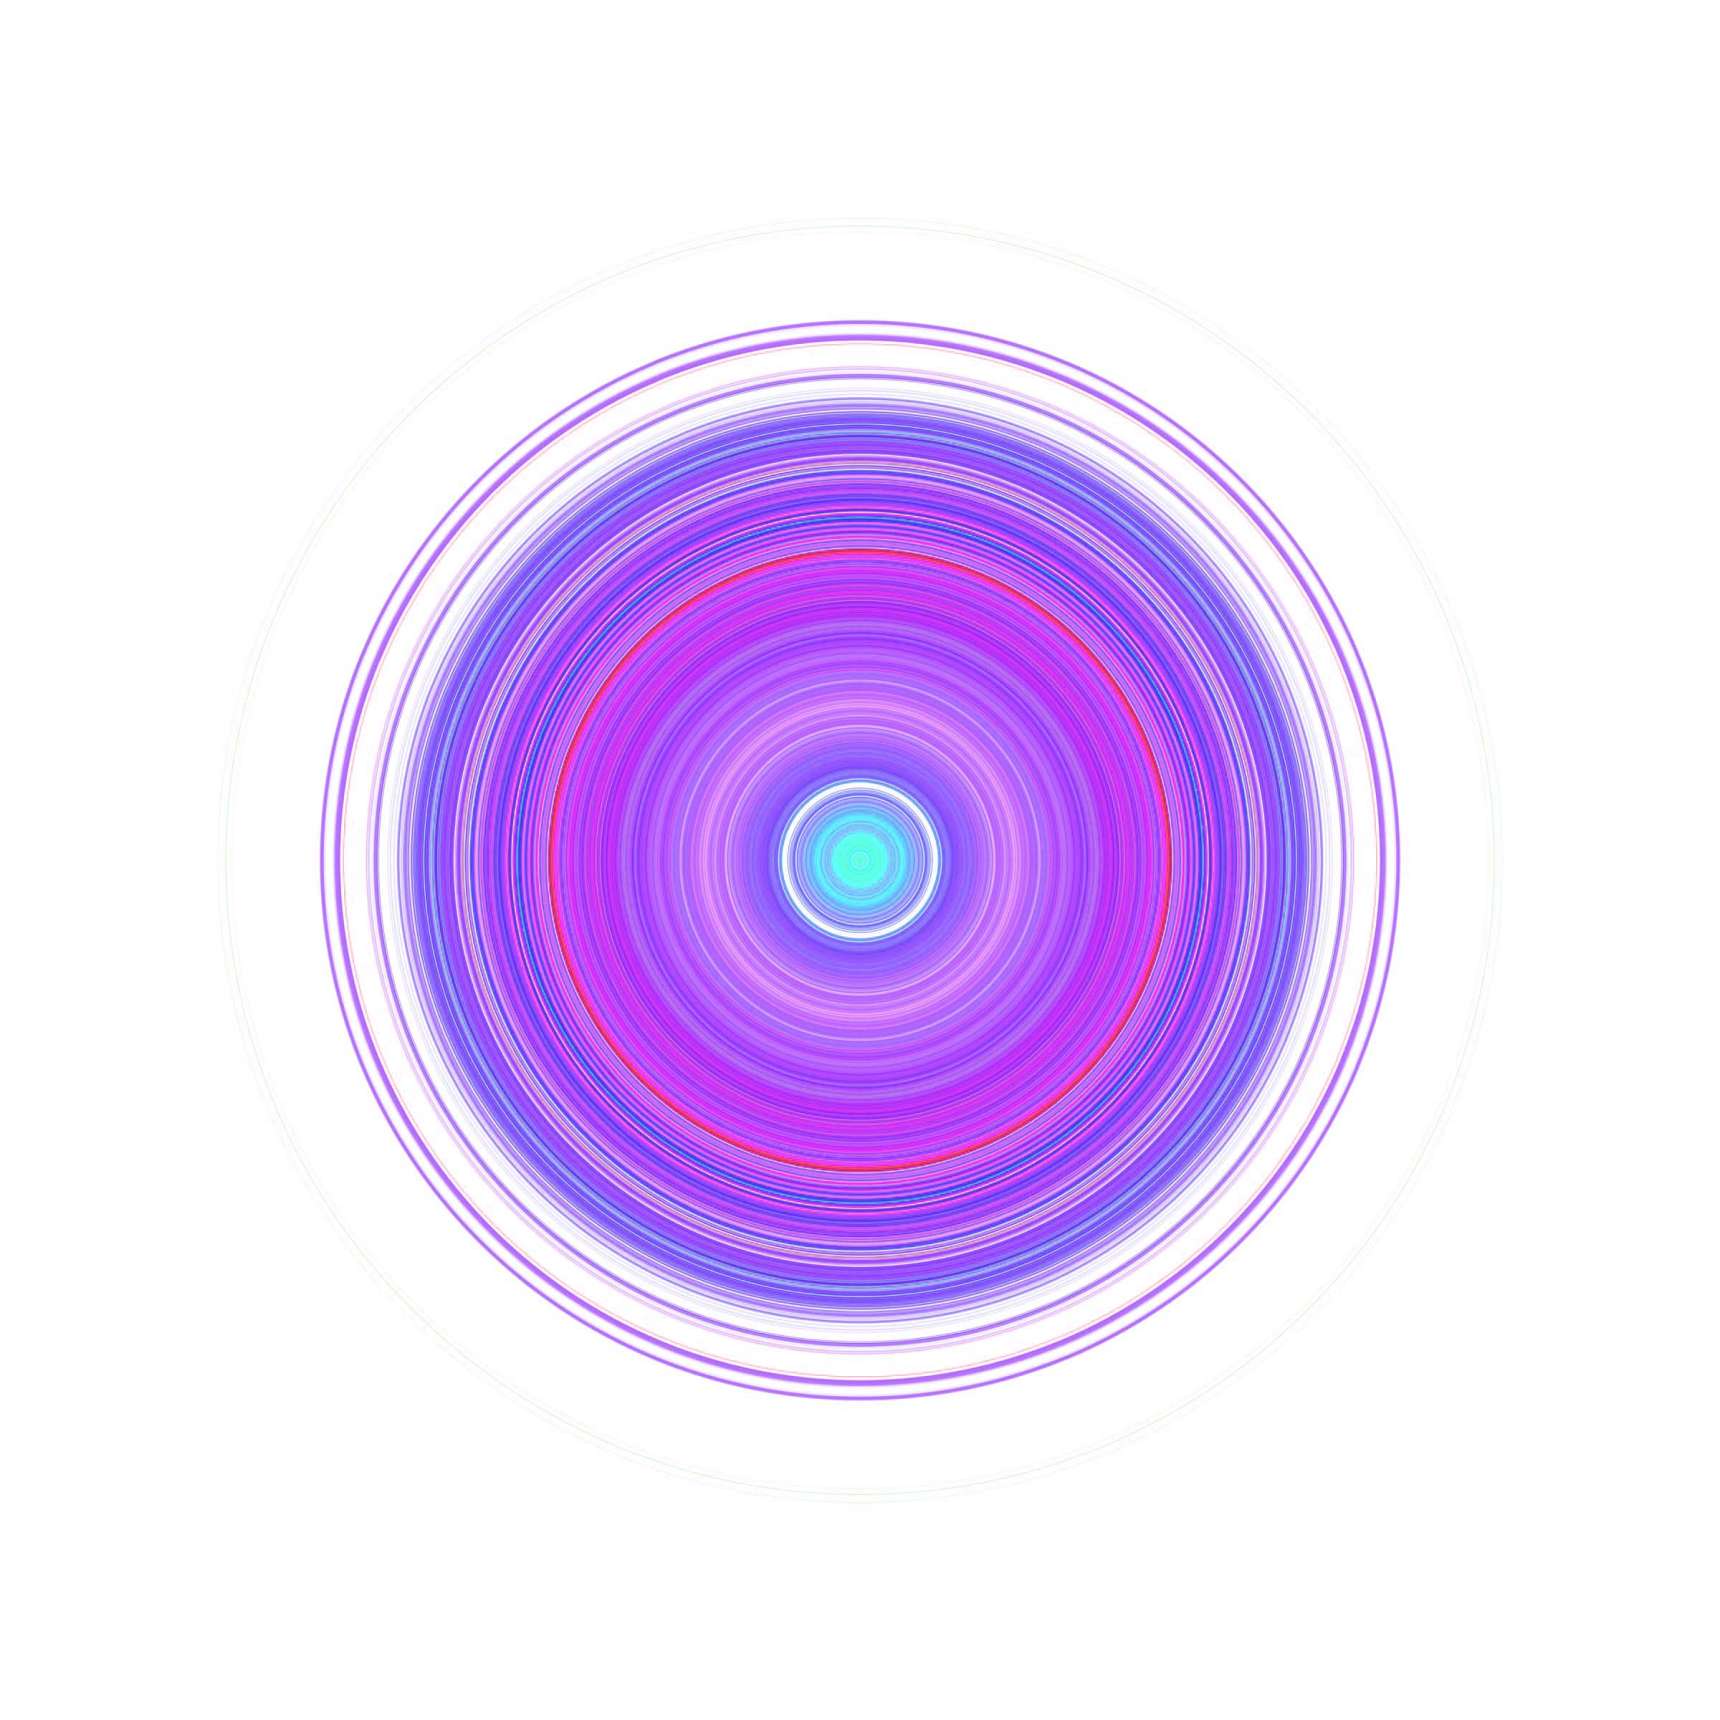
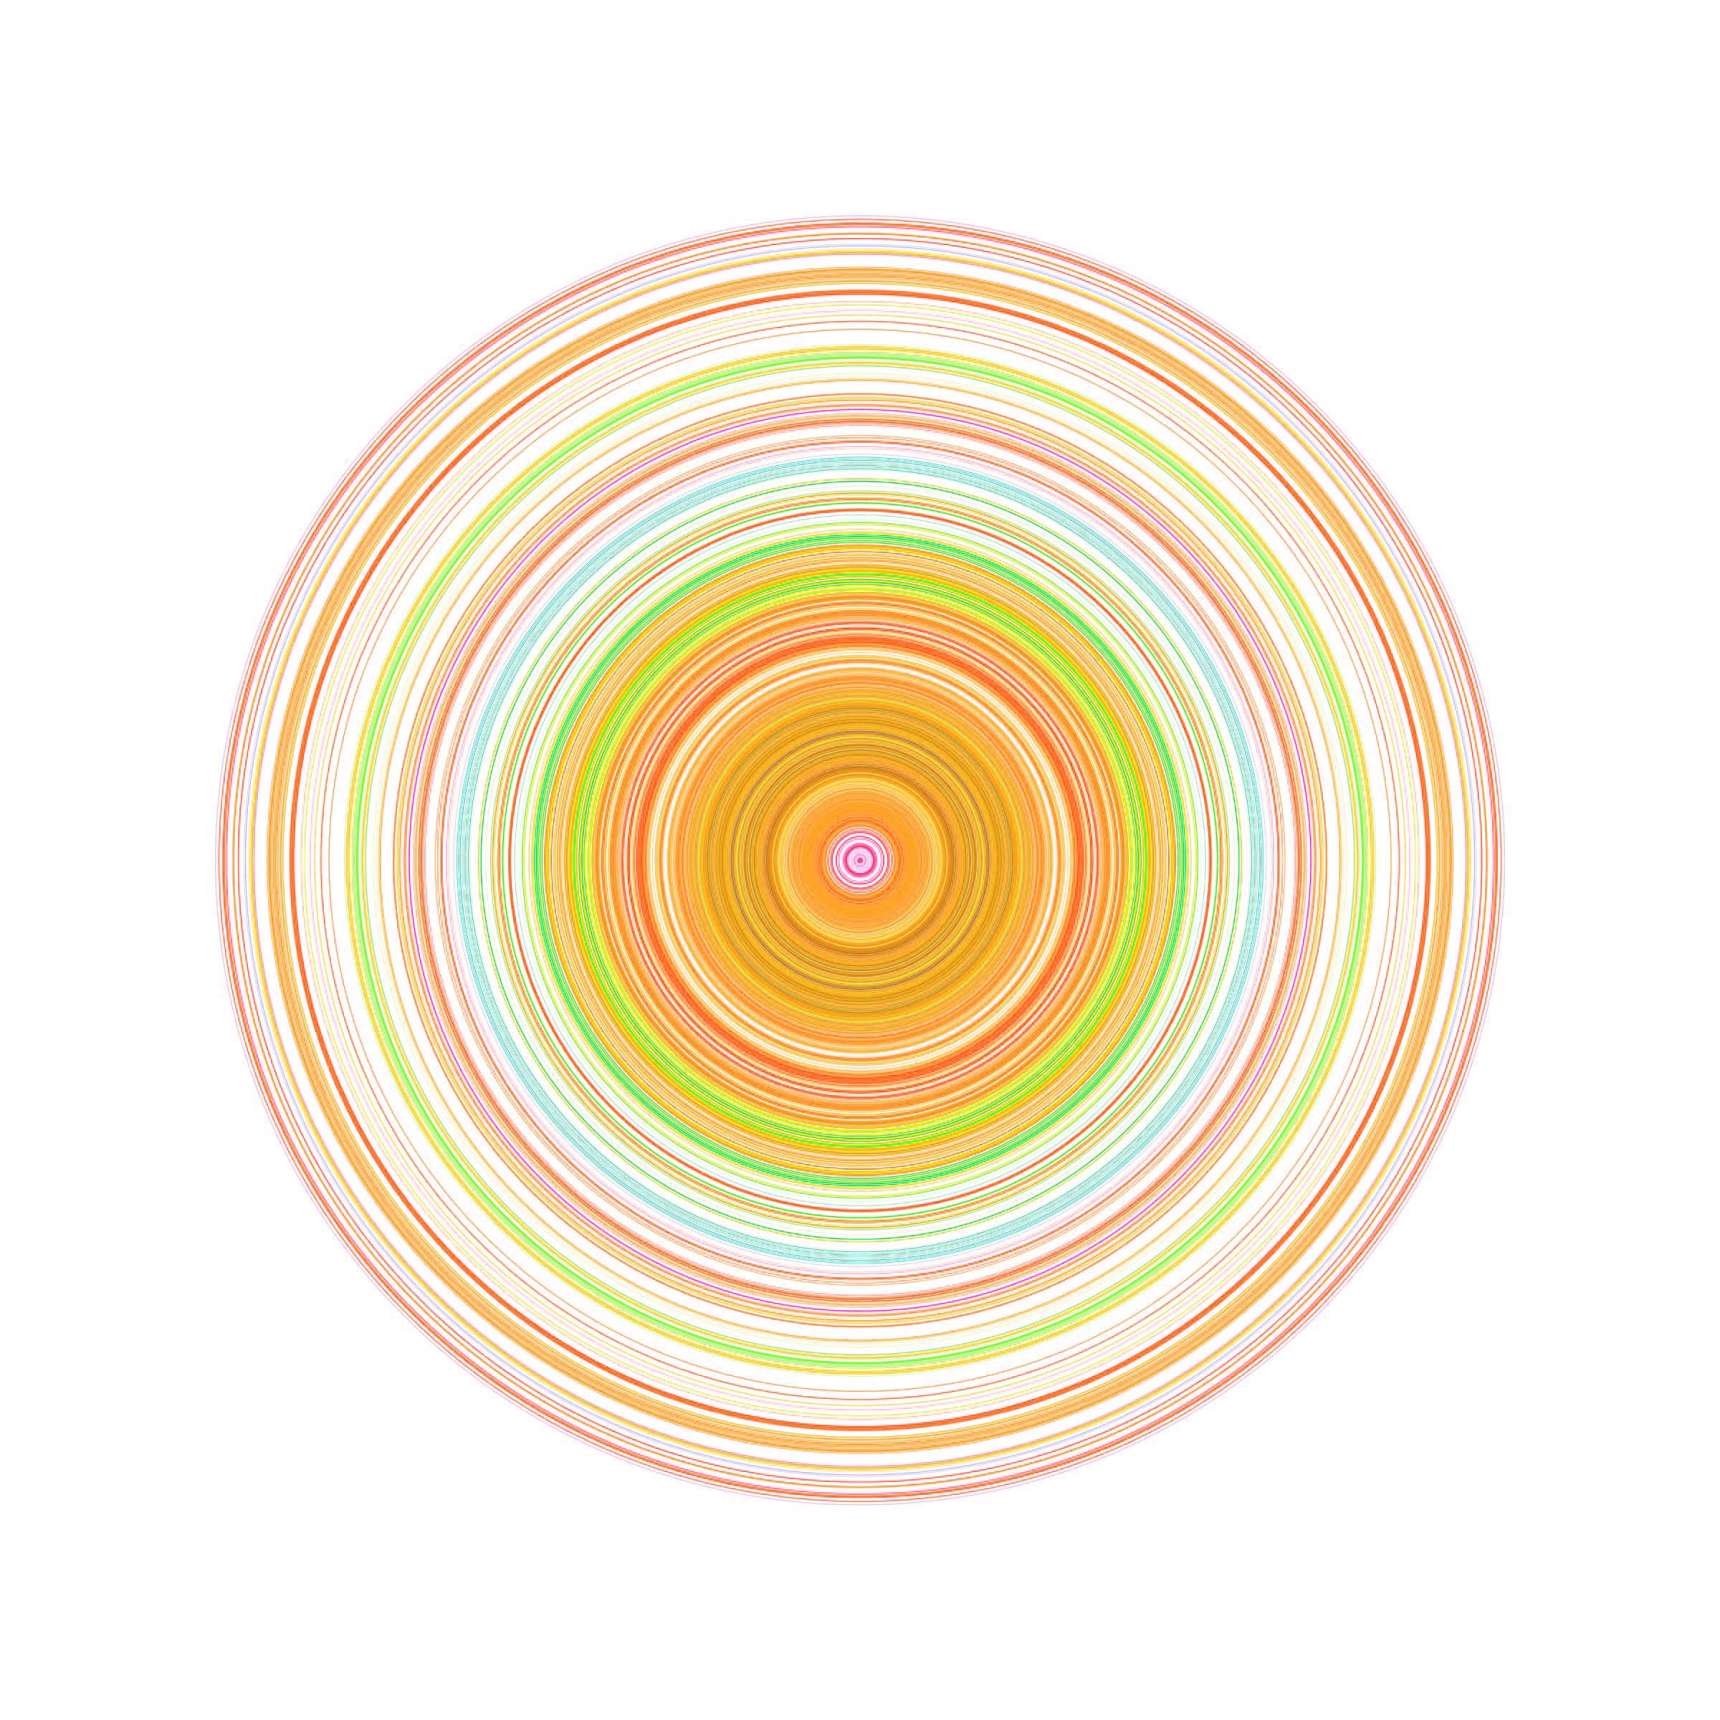
![Winds / October 13, 2010 / Greensboro, North Carolina / Process.2013.01 [ Detail ]](http://www.marknystrom.com/devmns/sites/default/files/styles/drimage_1720_0/public/2023-04/process_2013_01-2010_10_13-greensboro-detail.jpg?itok=NX1zZ5ct)
![Winds / August 13, 2013 / Salisbury, Maryland / Process.2013.01 [ Detail ]](http://www.marknystrom.com/devmns/sites/default/files/styles/drimage_1720_0/public/2023-04/process_2013_01-2013_8_13-salisbury-detail.jpg?itok=zZnH2m0O)
![Winds / December 4, 2013 / Cary, North Carolina / Process.2013.01 [ Detail ]](http://www.marknystrom.com/devmns/sites/default/files/styles/drimage_1720_0/public/2023-04/process_2013_01-2013_12_4-cary-detail.jpg?itok=PKnymtmI)
![Winds / September 30, 2022 / Boone, North Carolina / Process.2013.01 [ Detail ]](http://www.marknystrom.com/devmns/sites/default/files/styles/drimage_1720_0/public/2023-04/process_2013_01-2022_9_30-boone-detail.jpg?itok=Do-uP6H4)