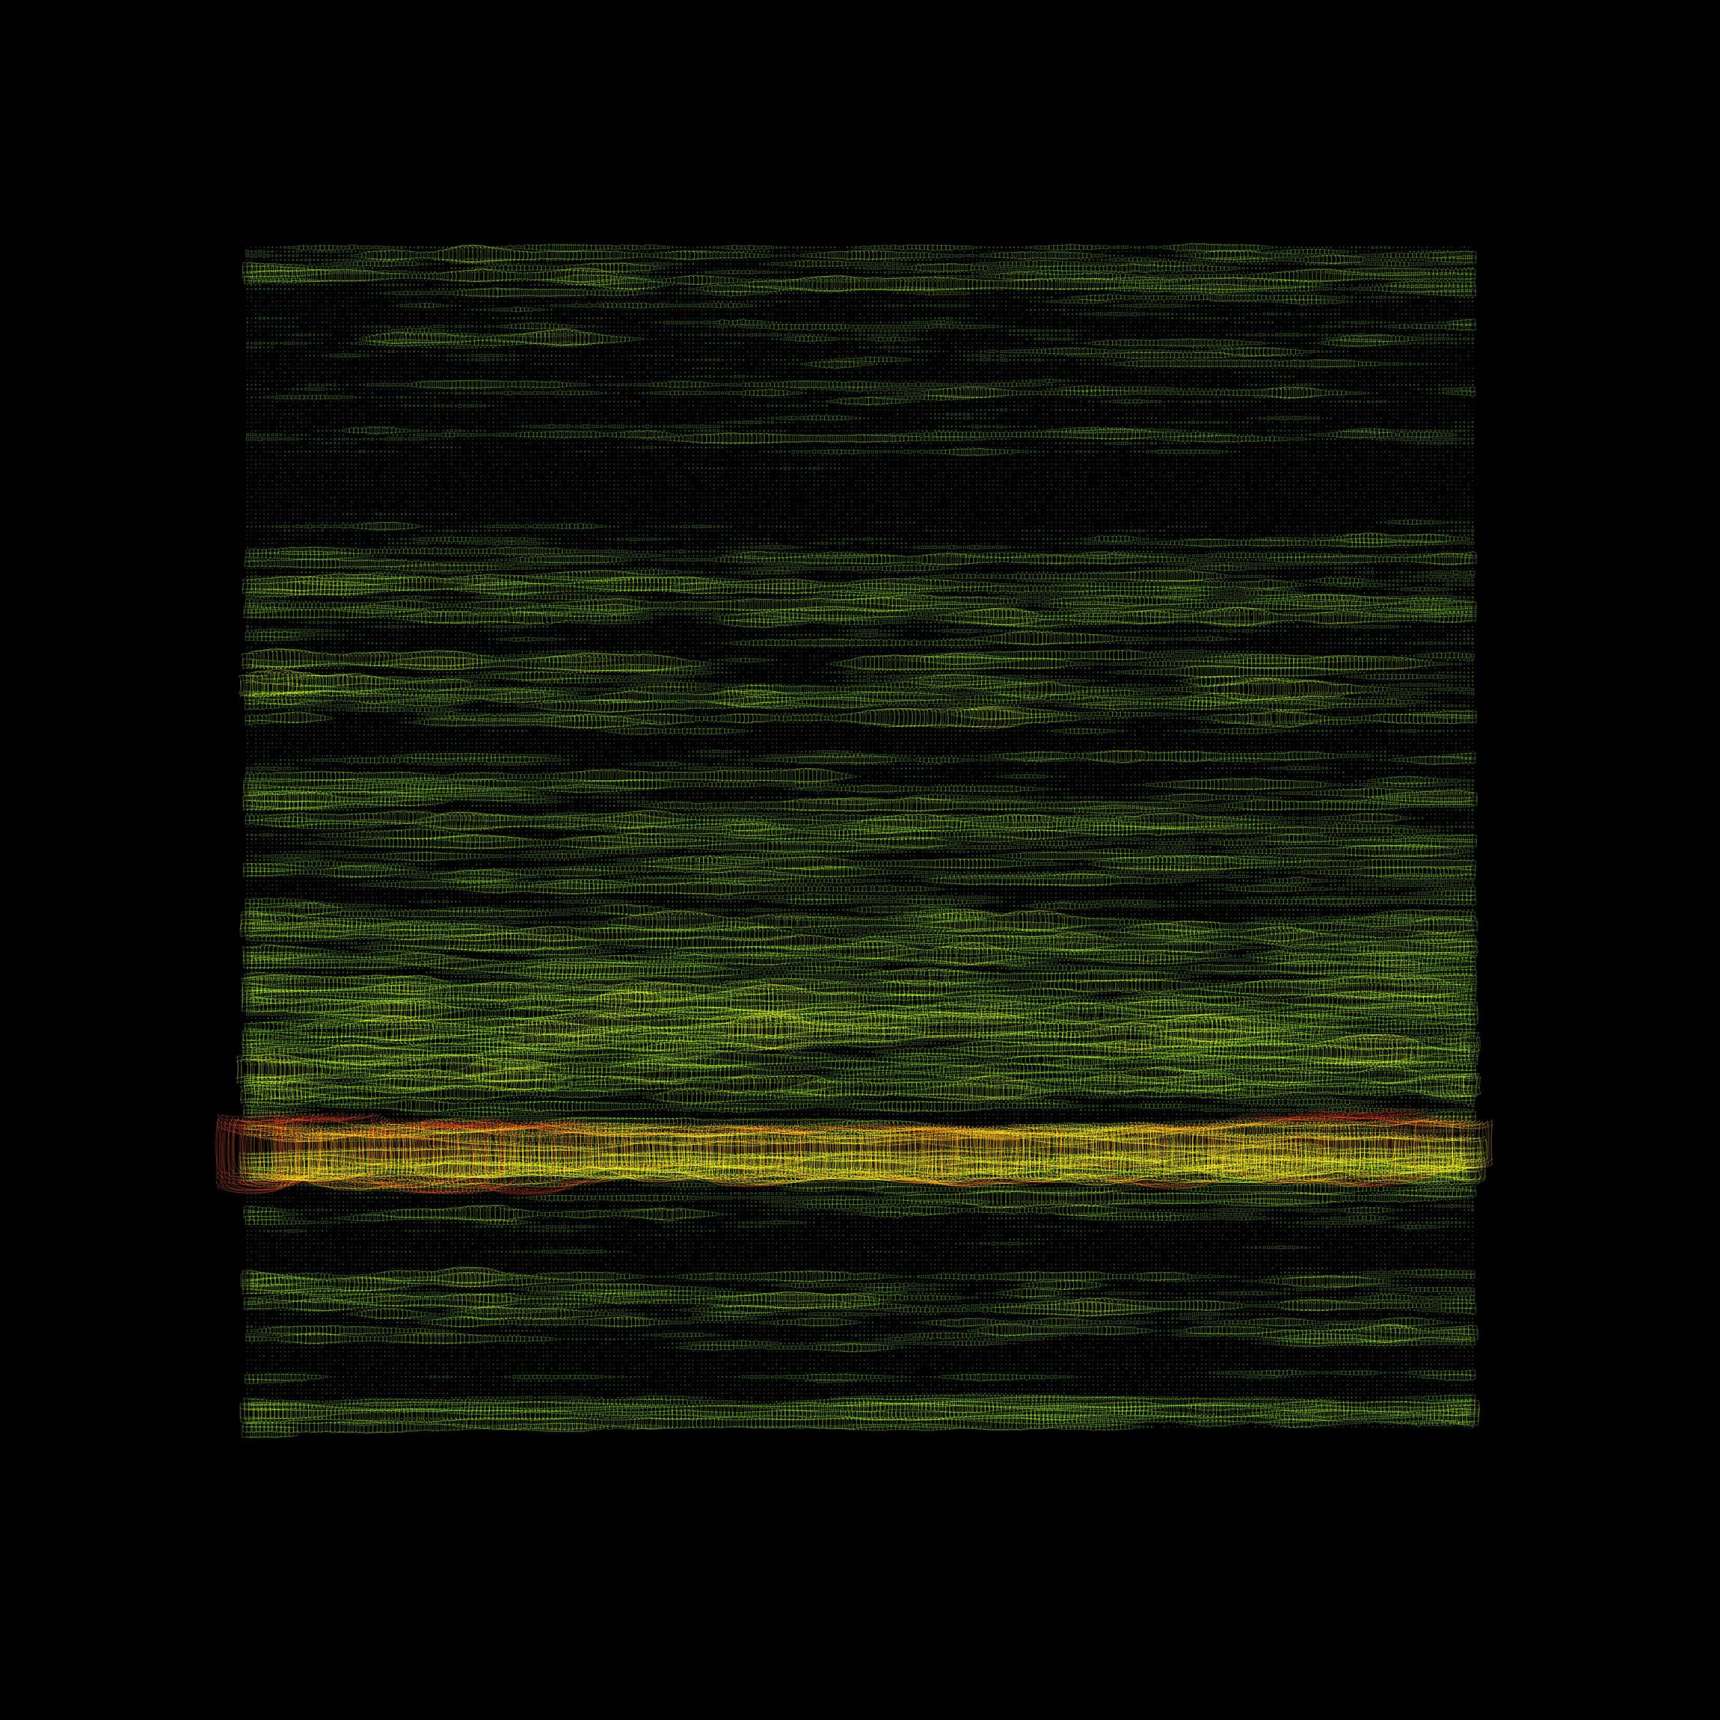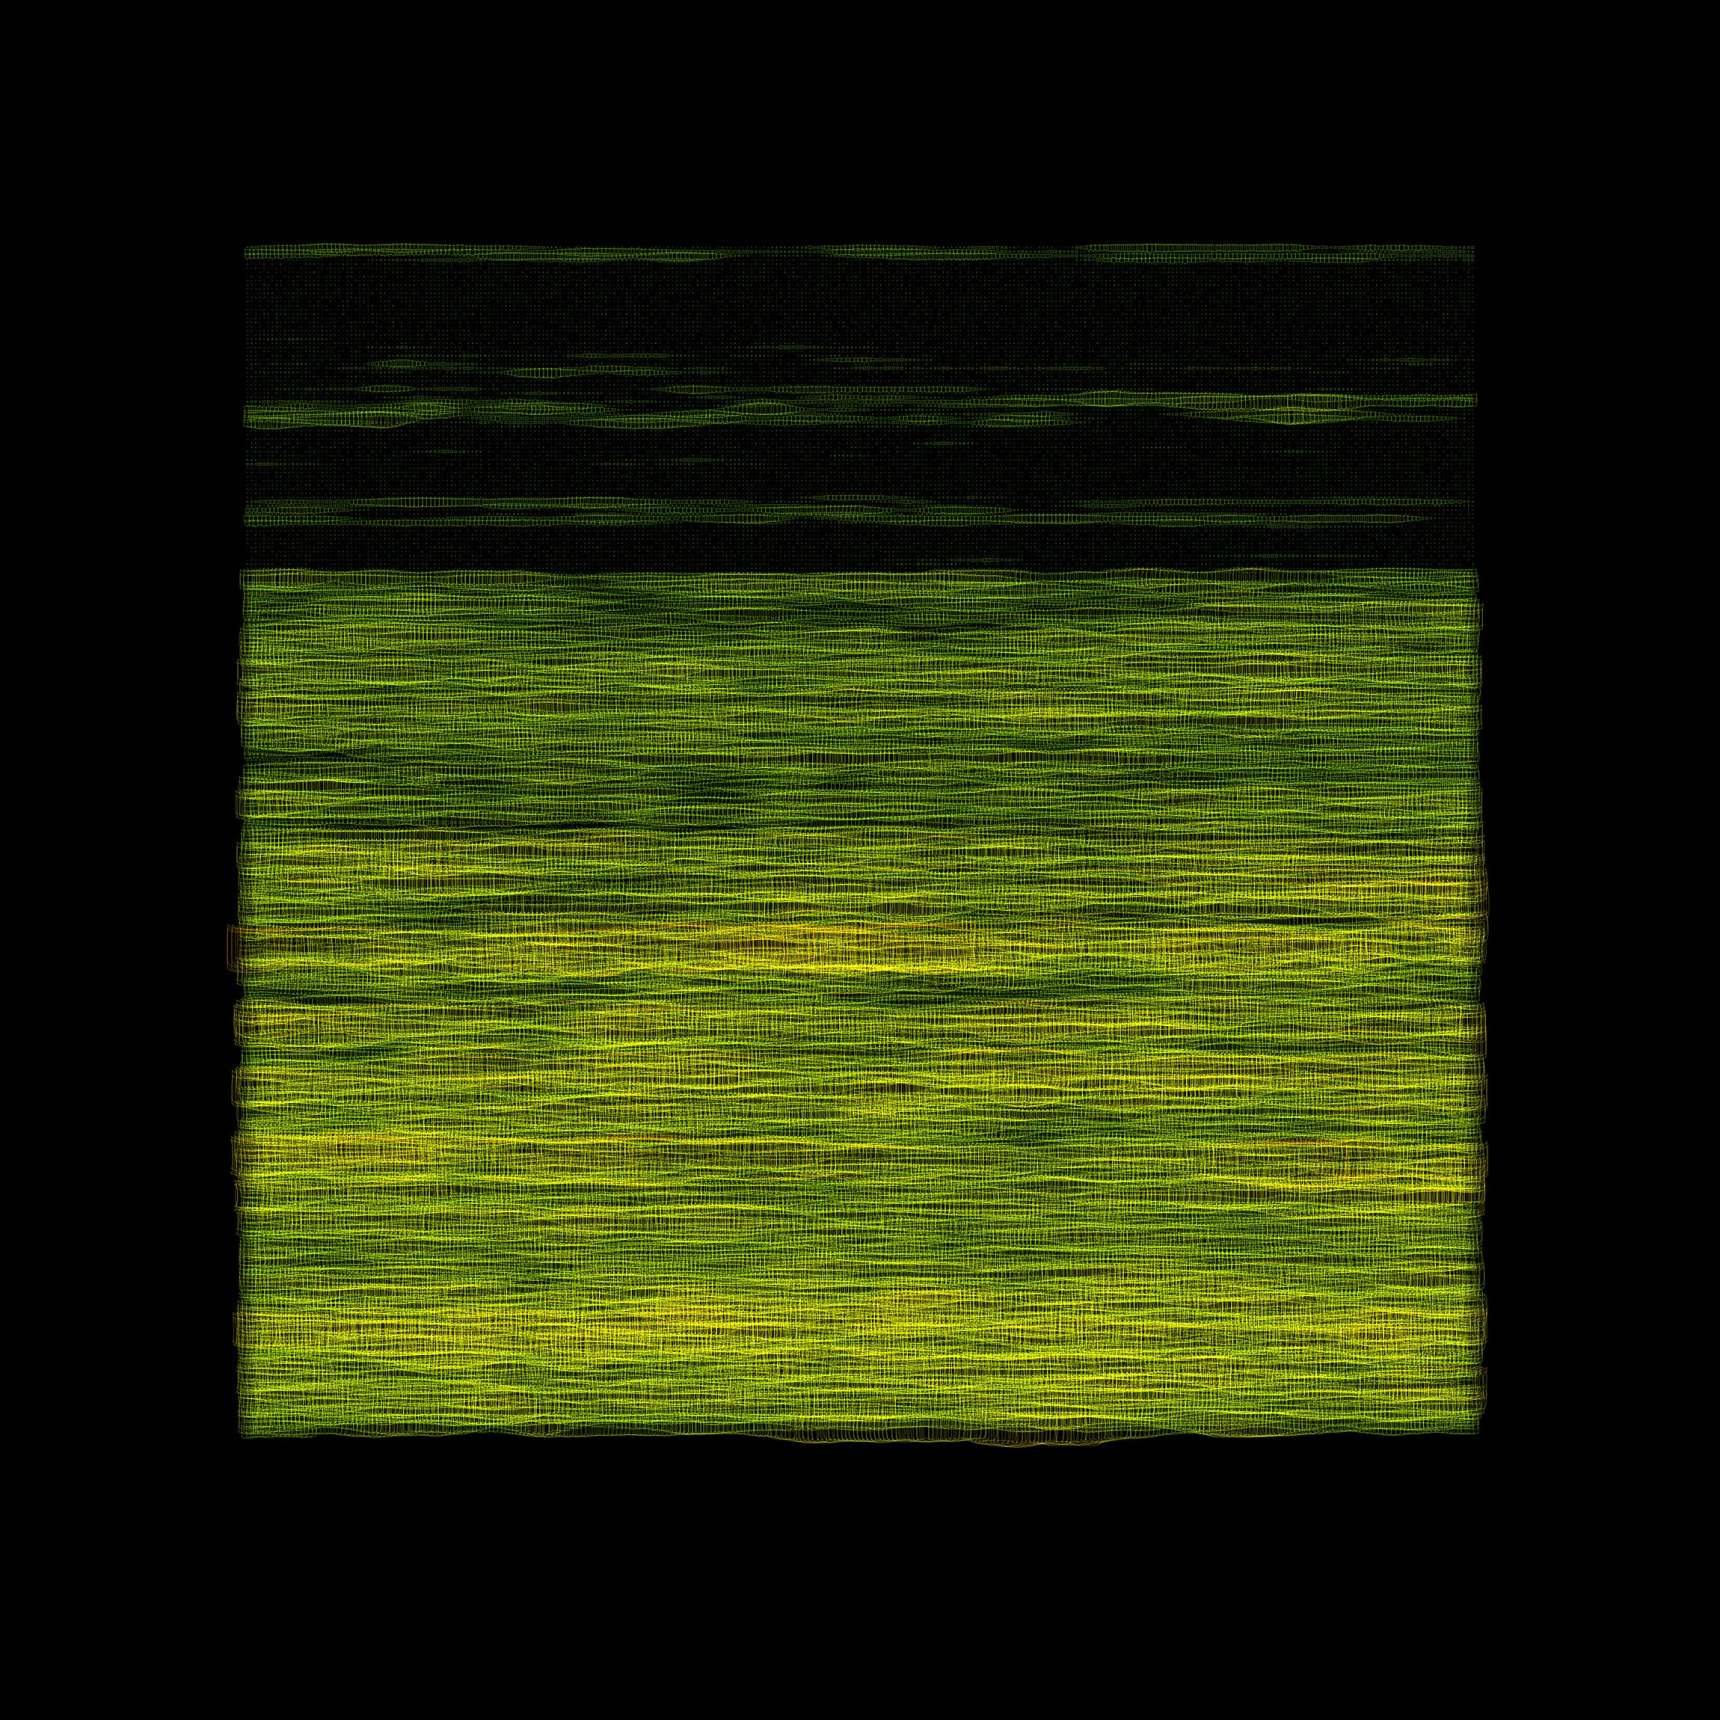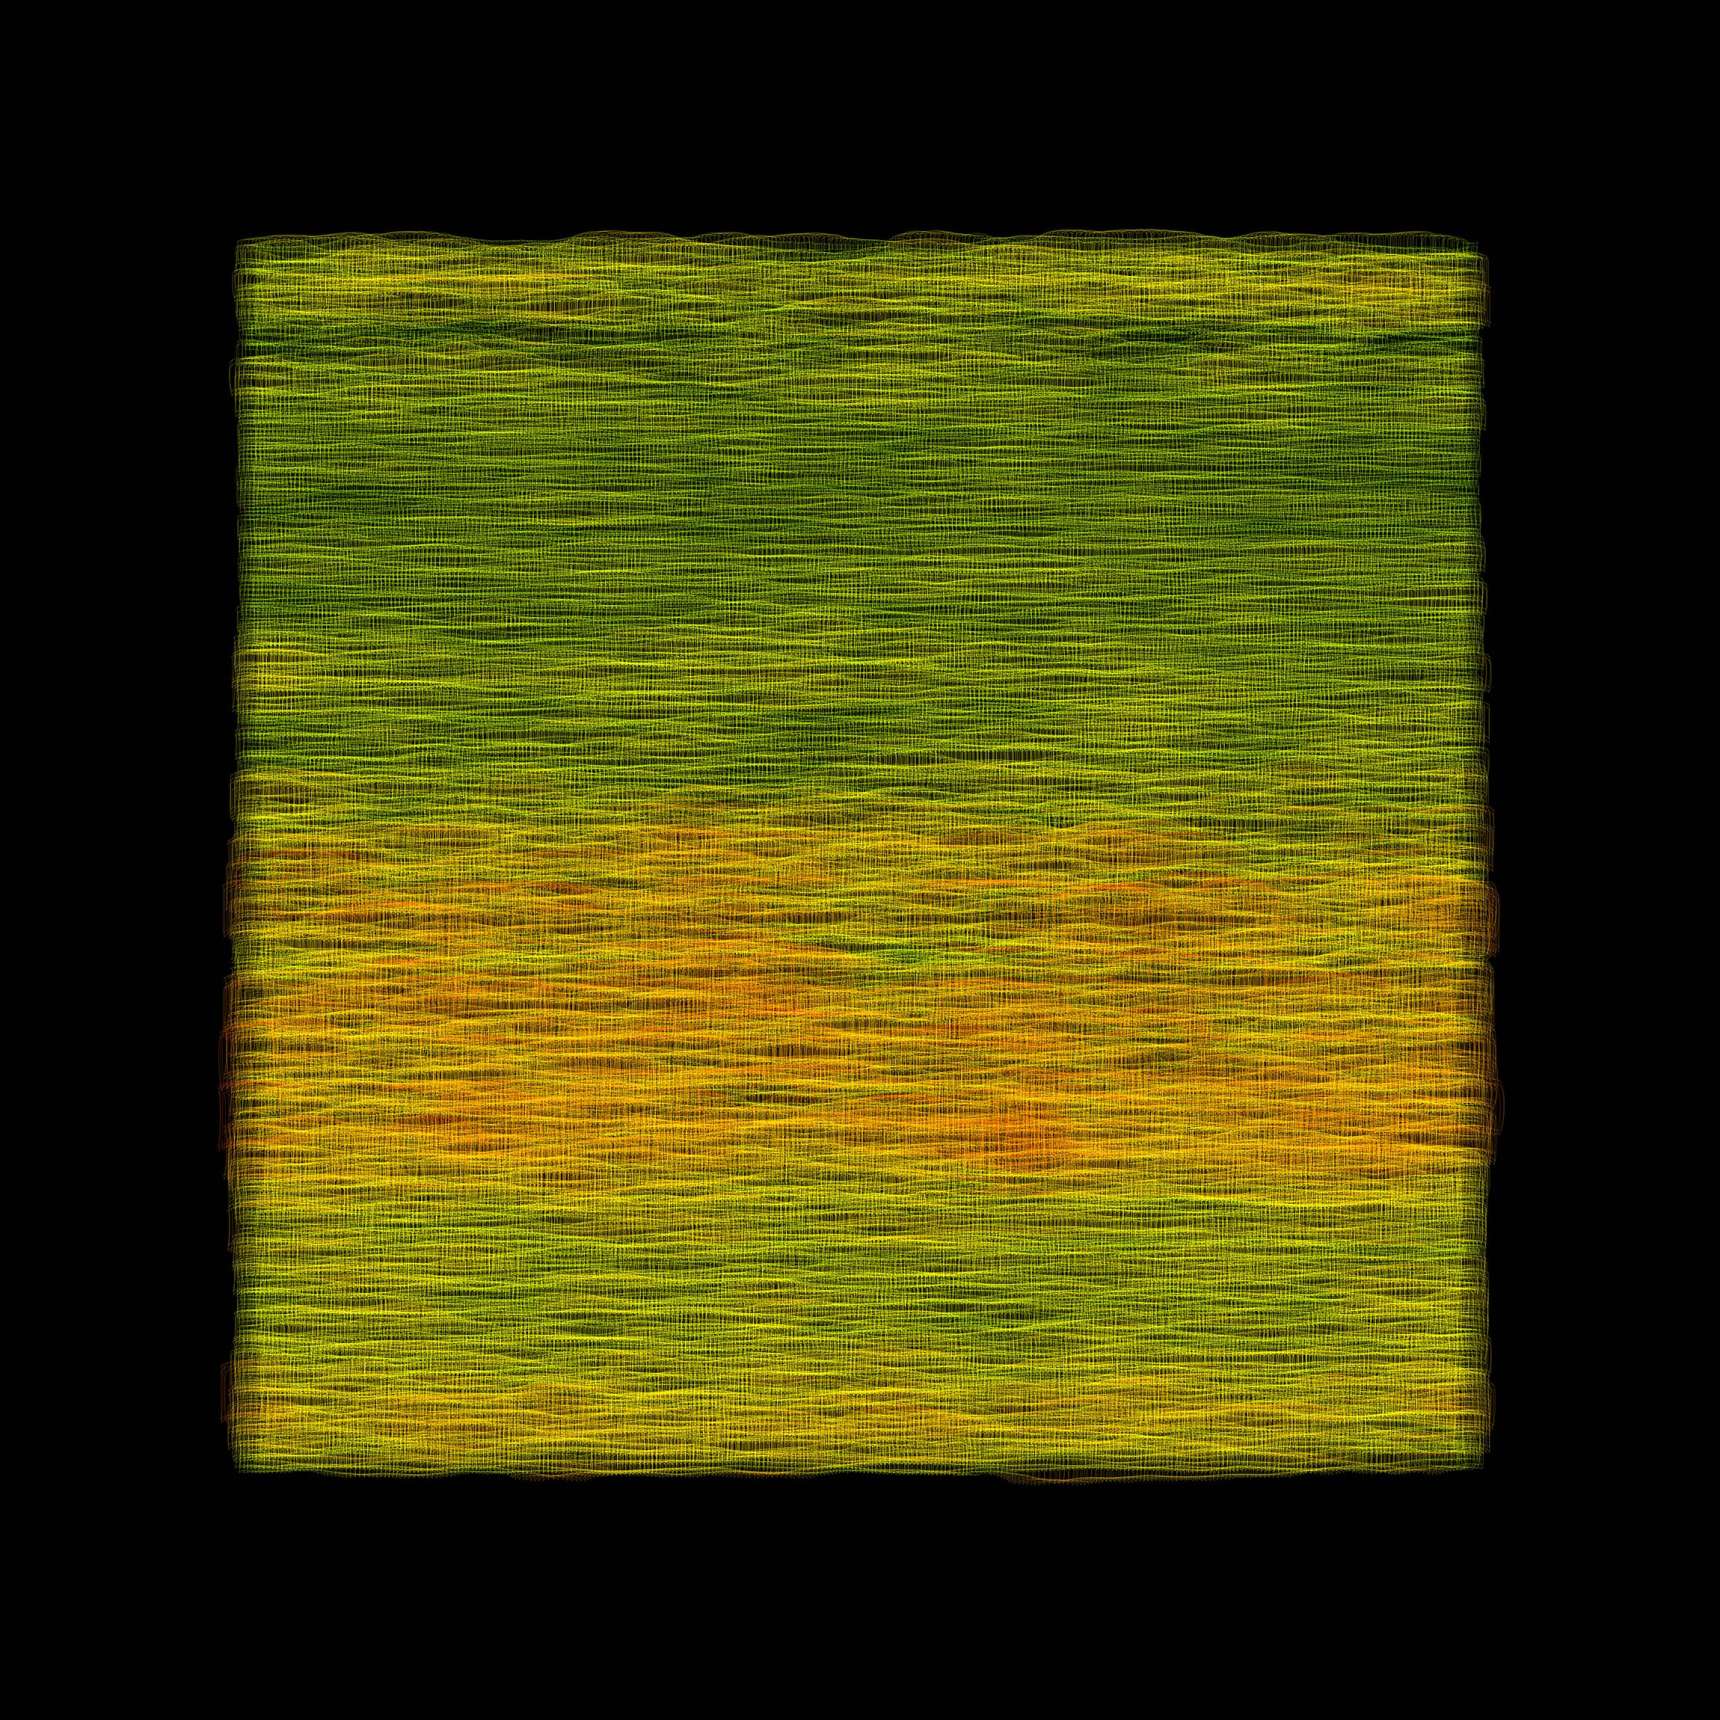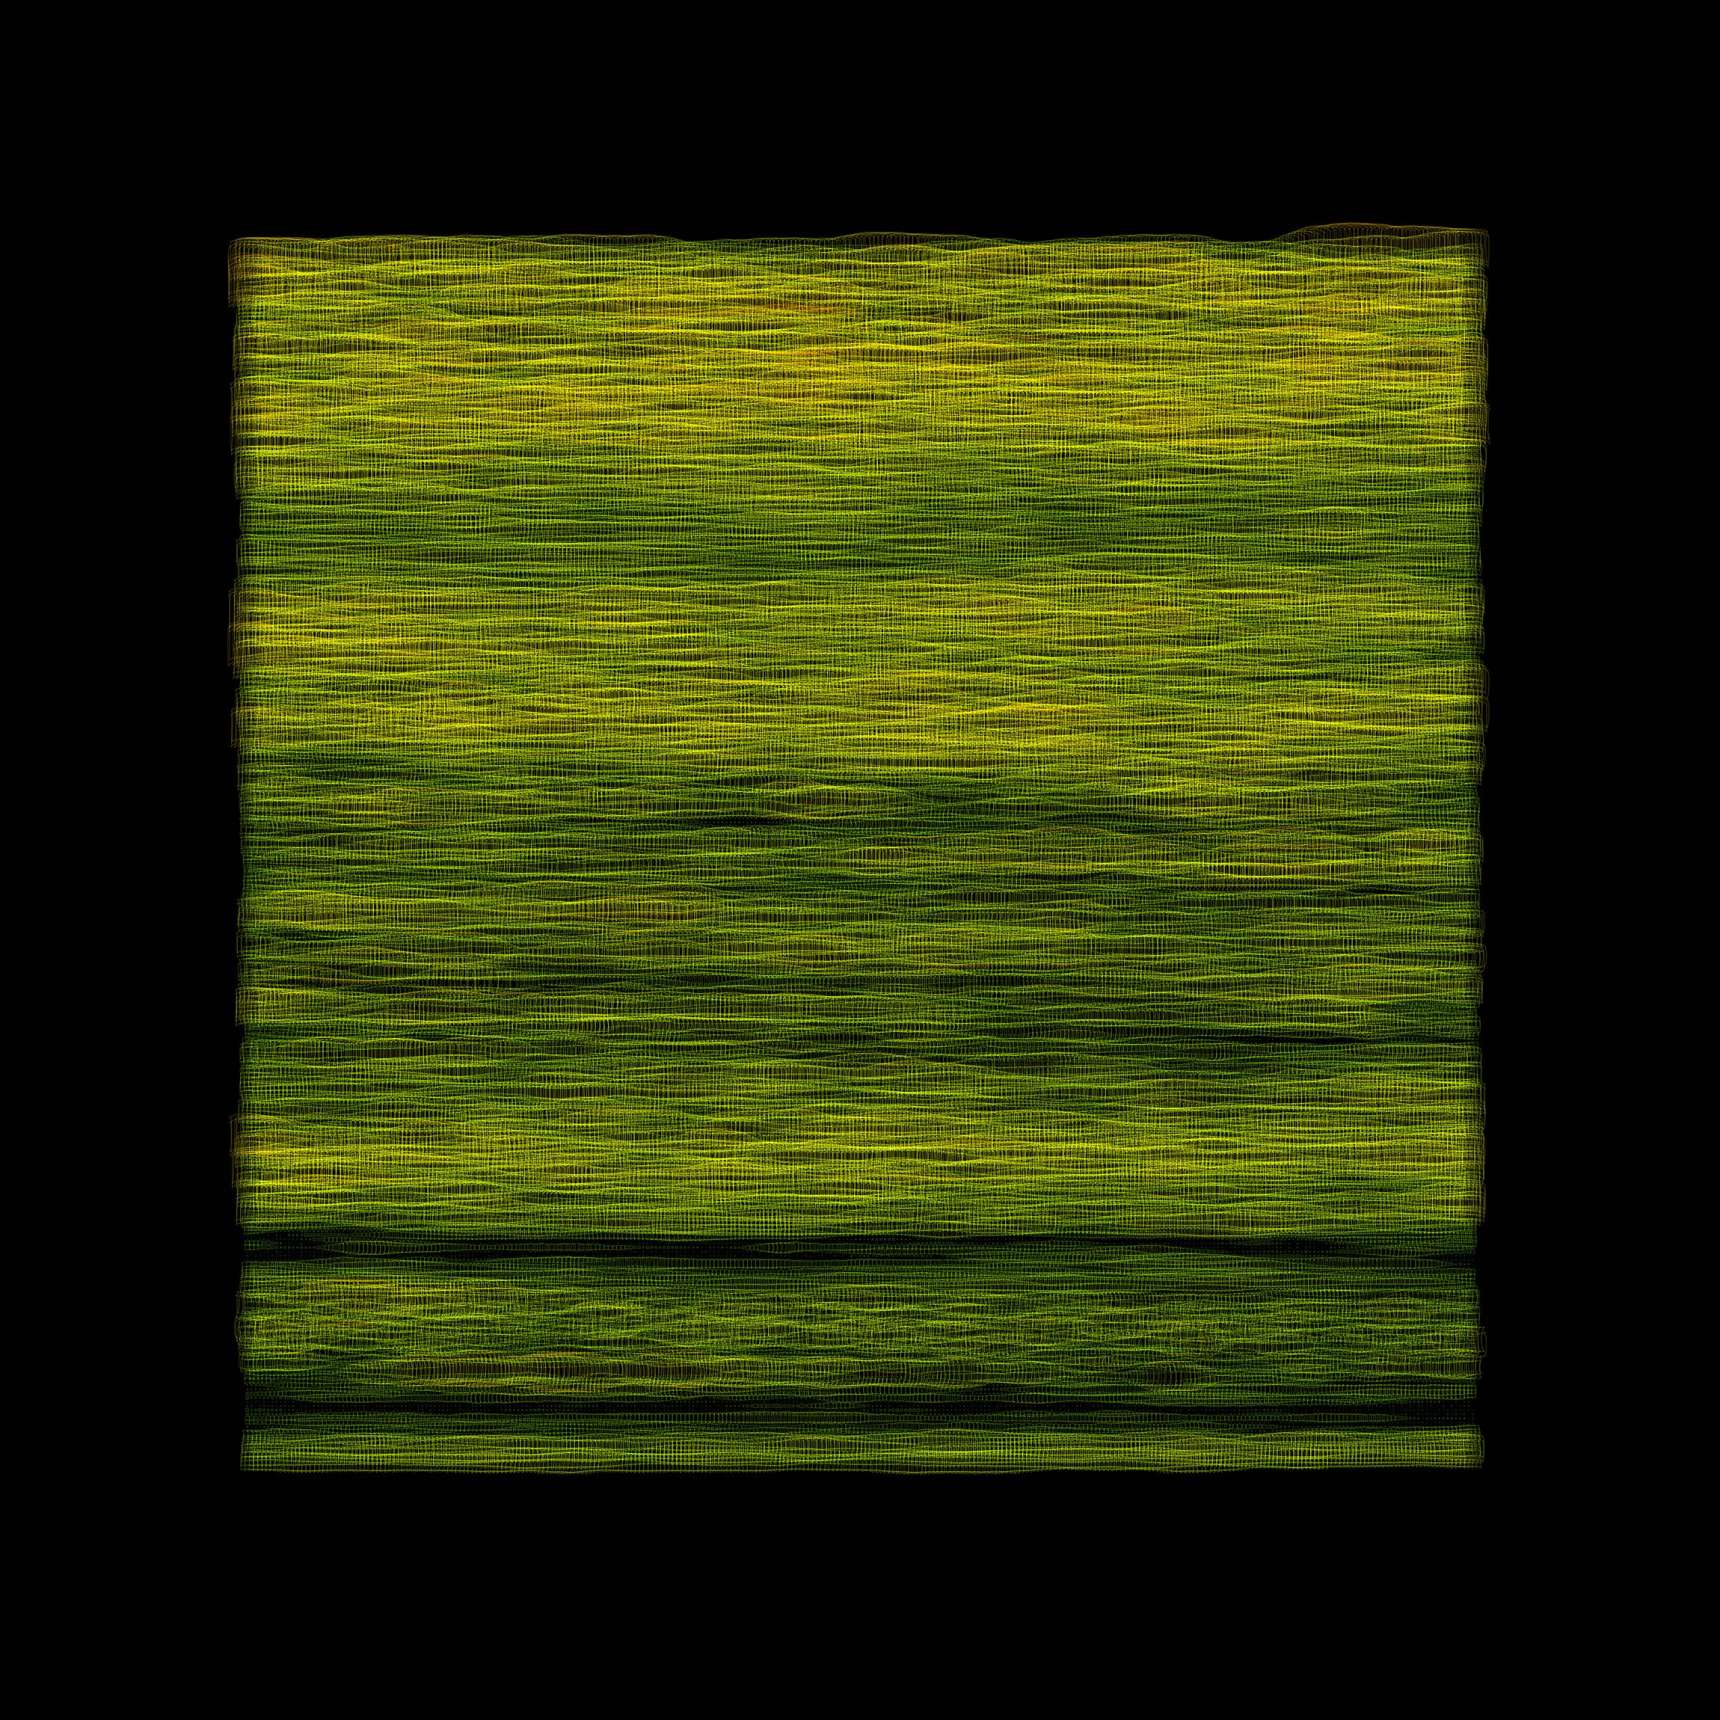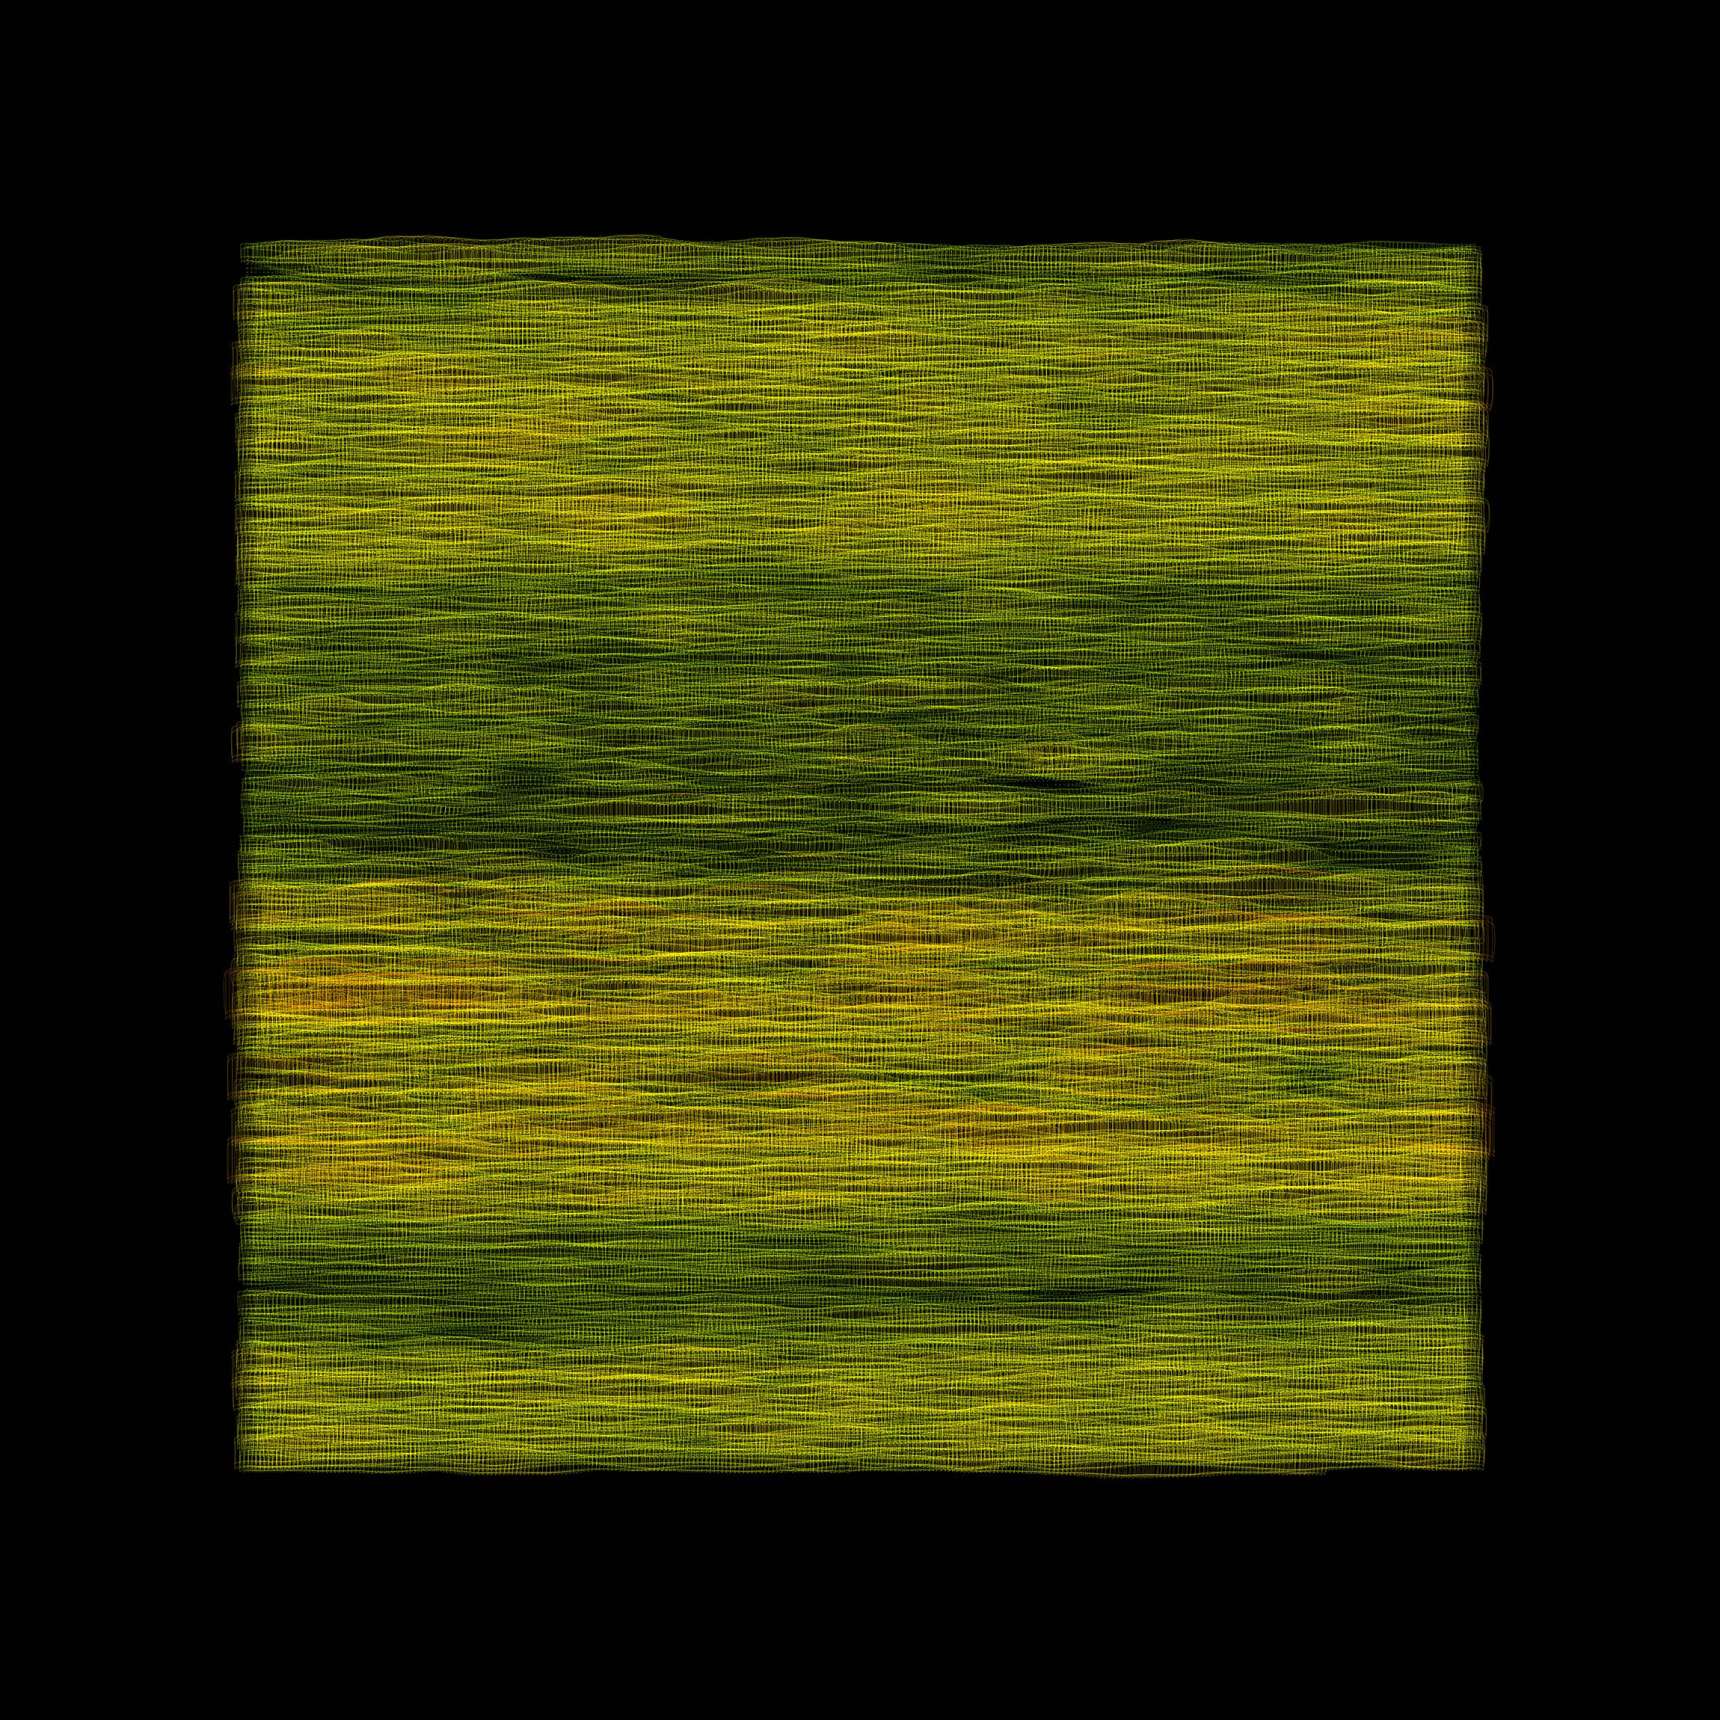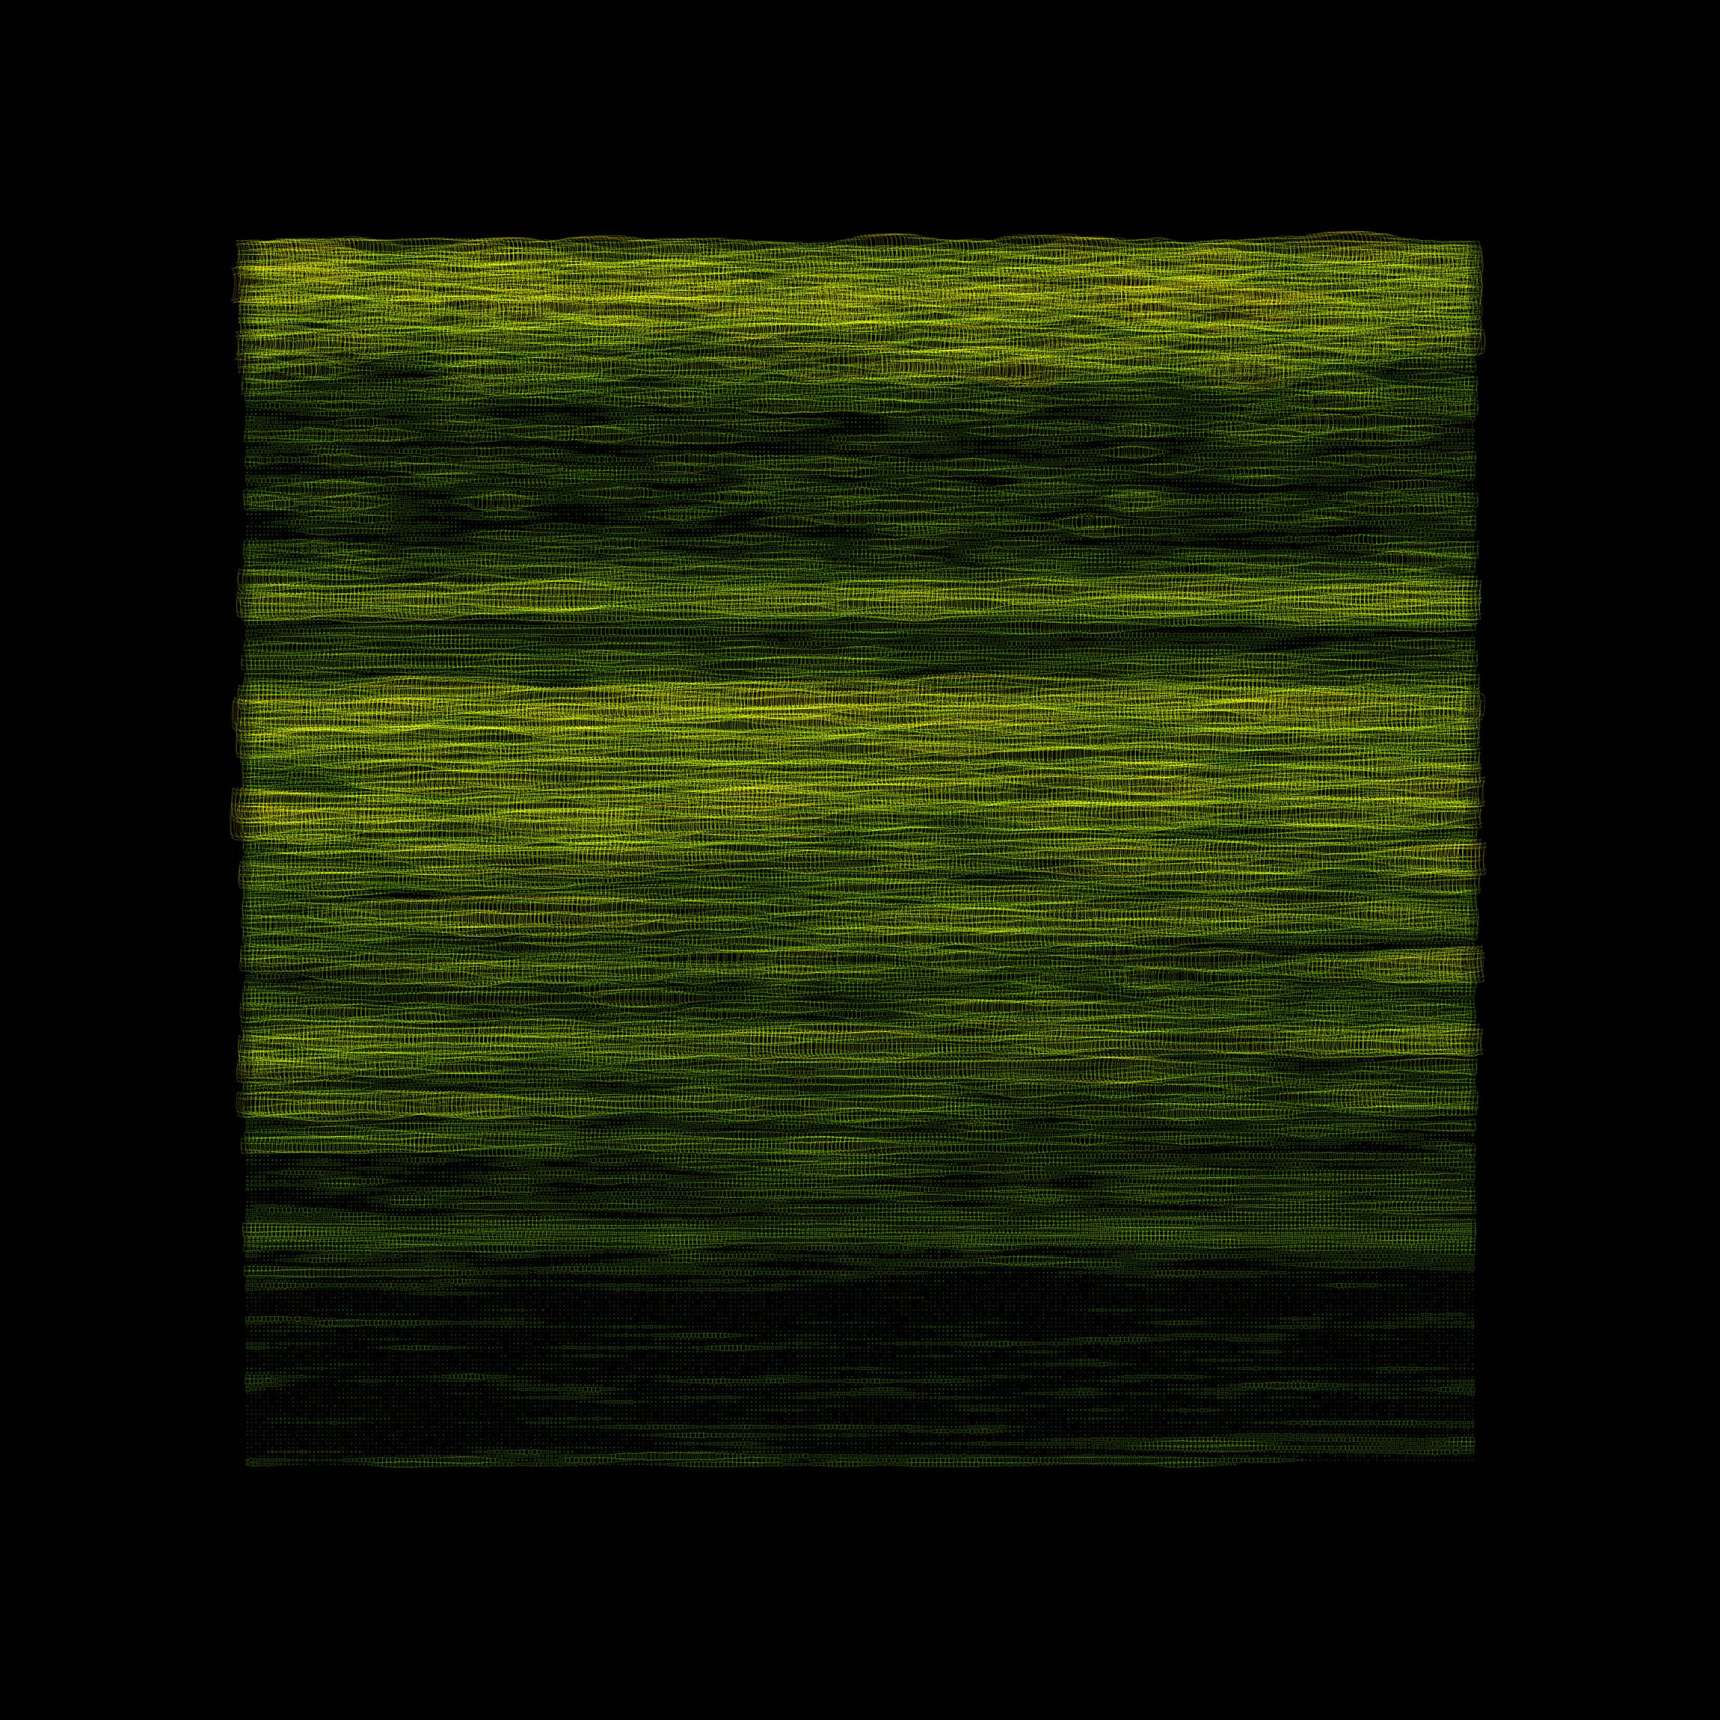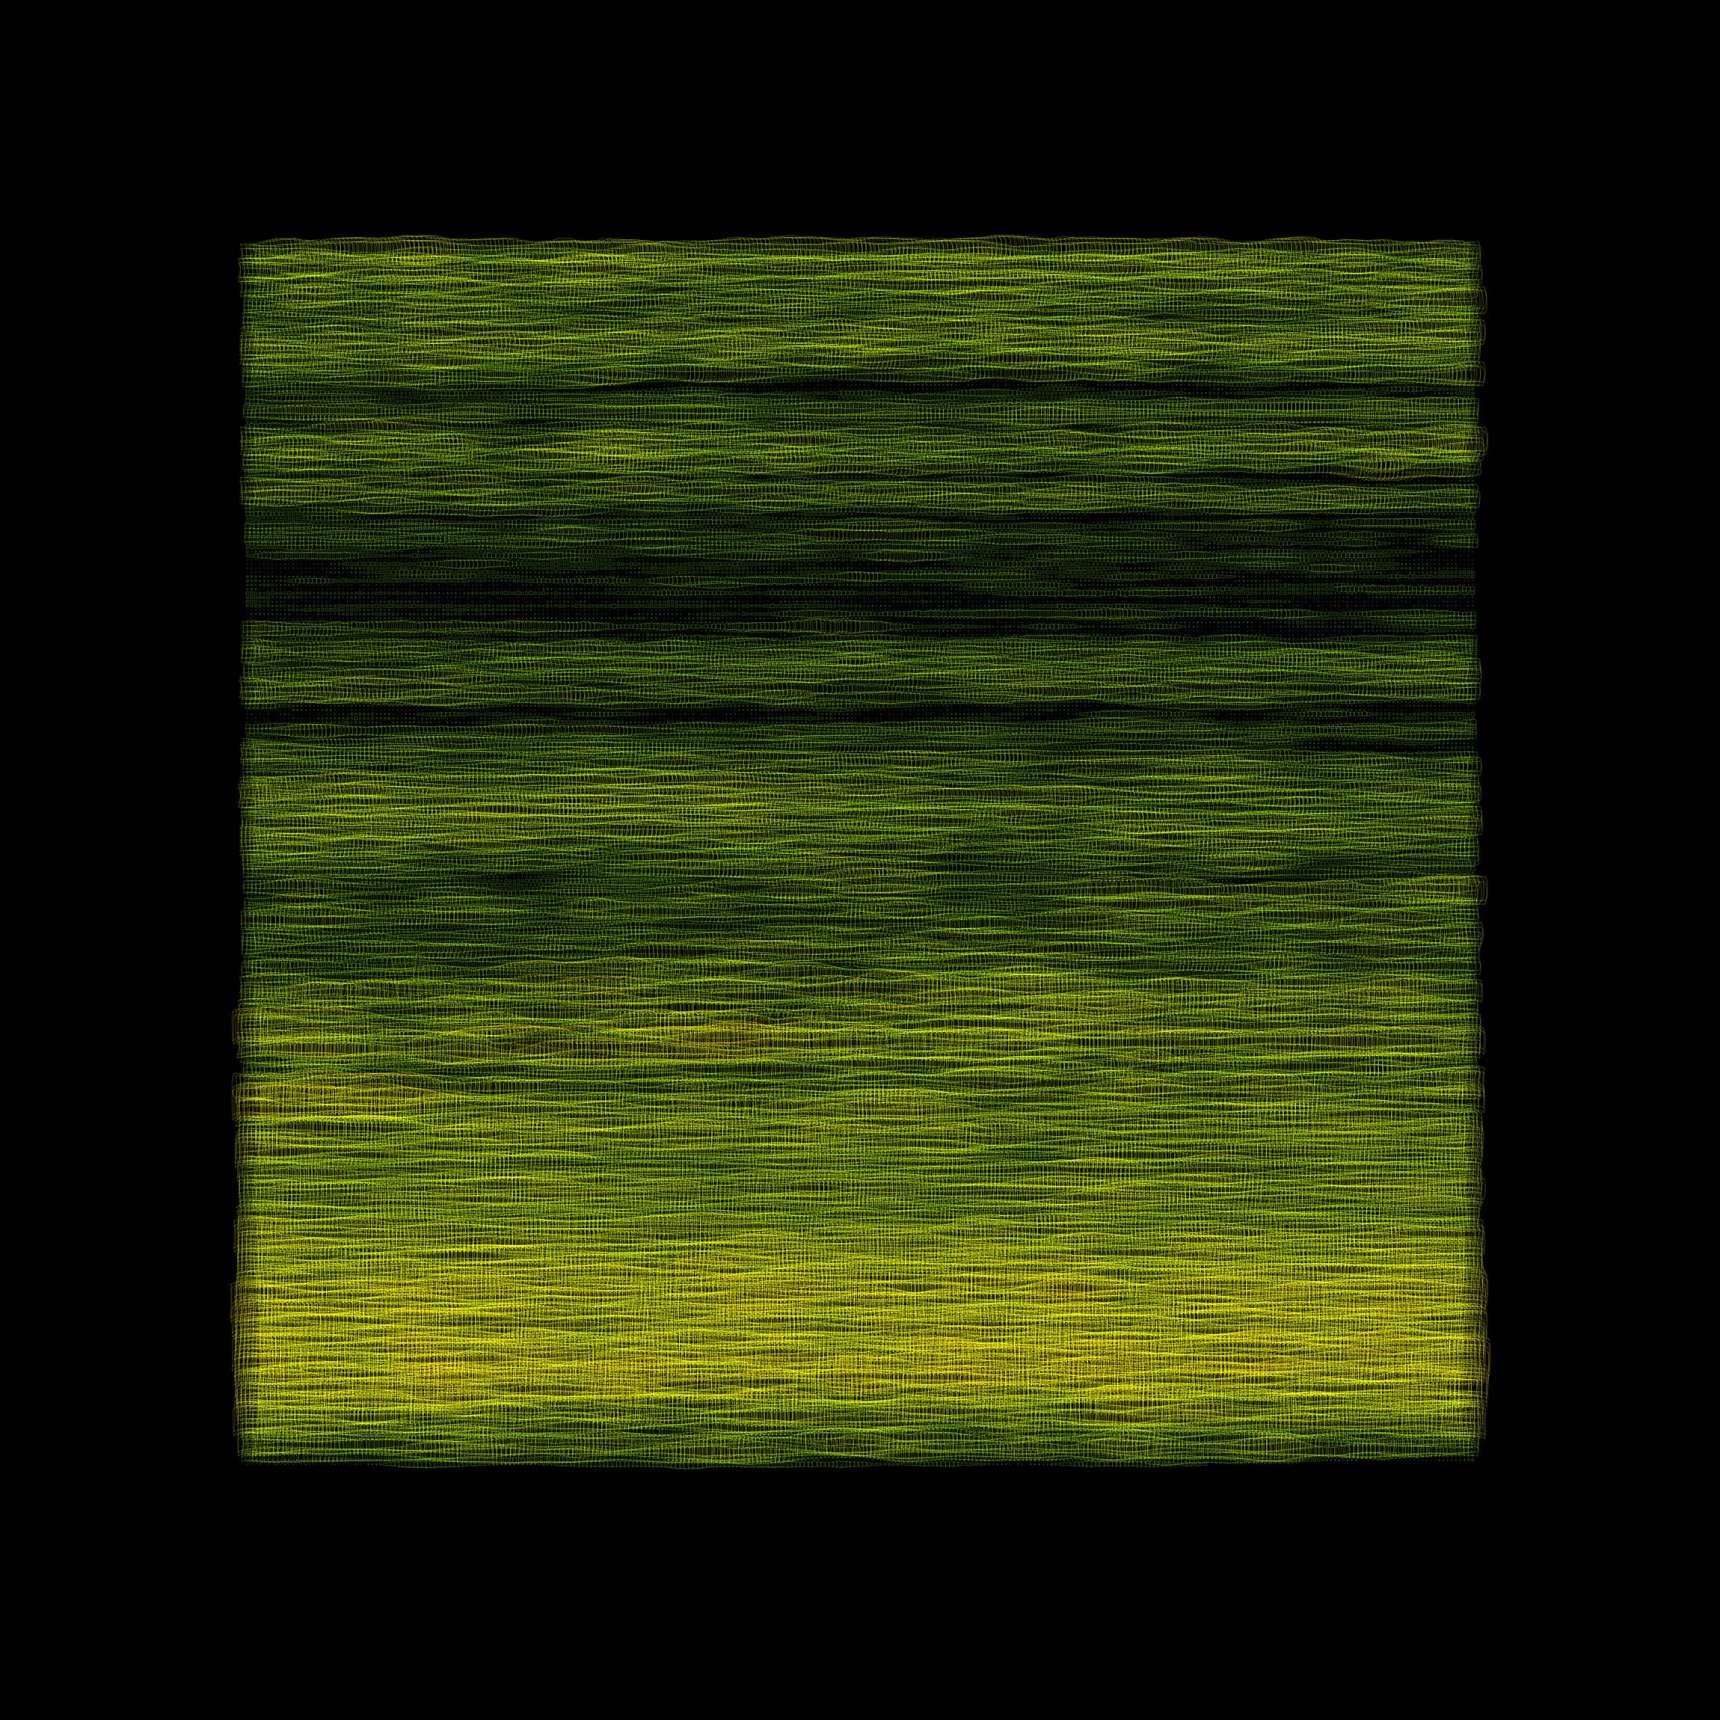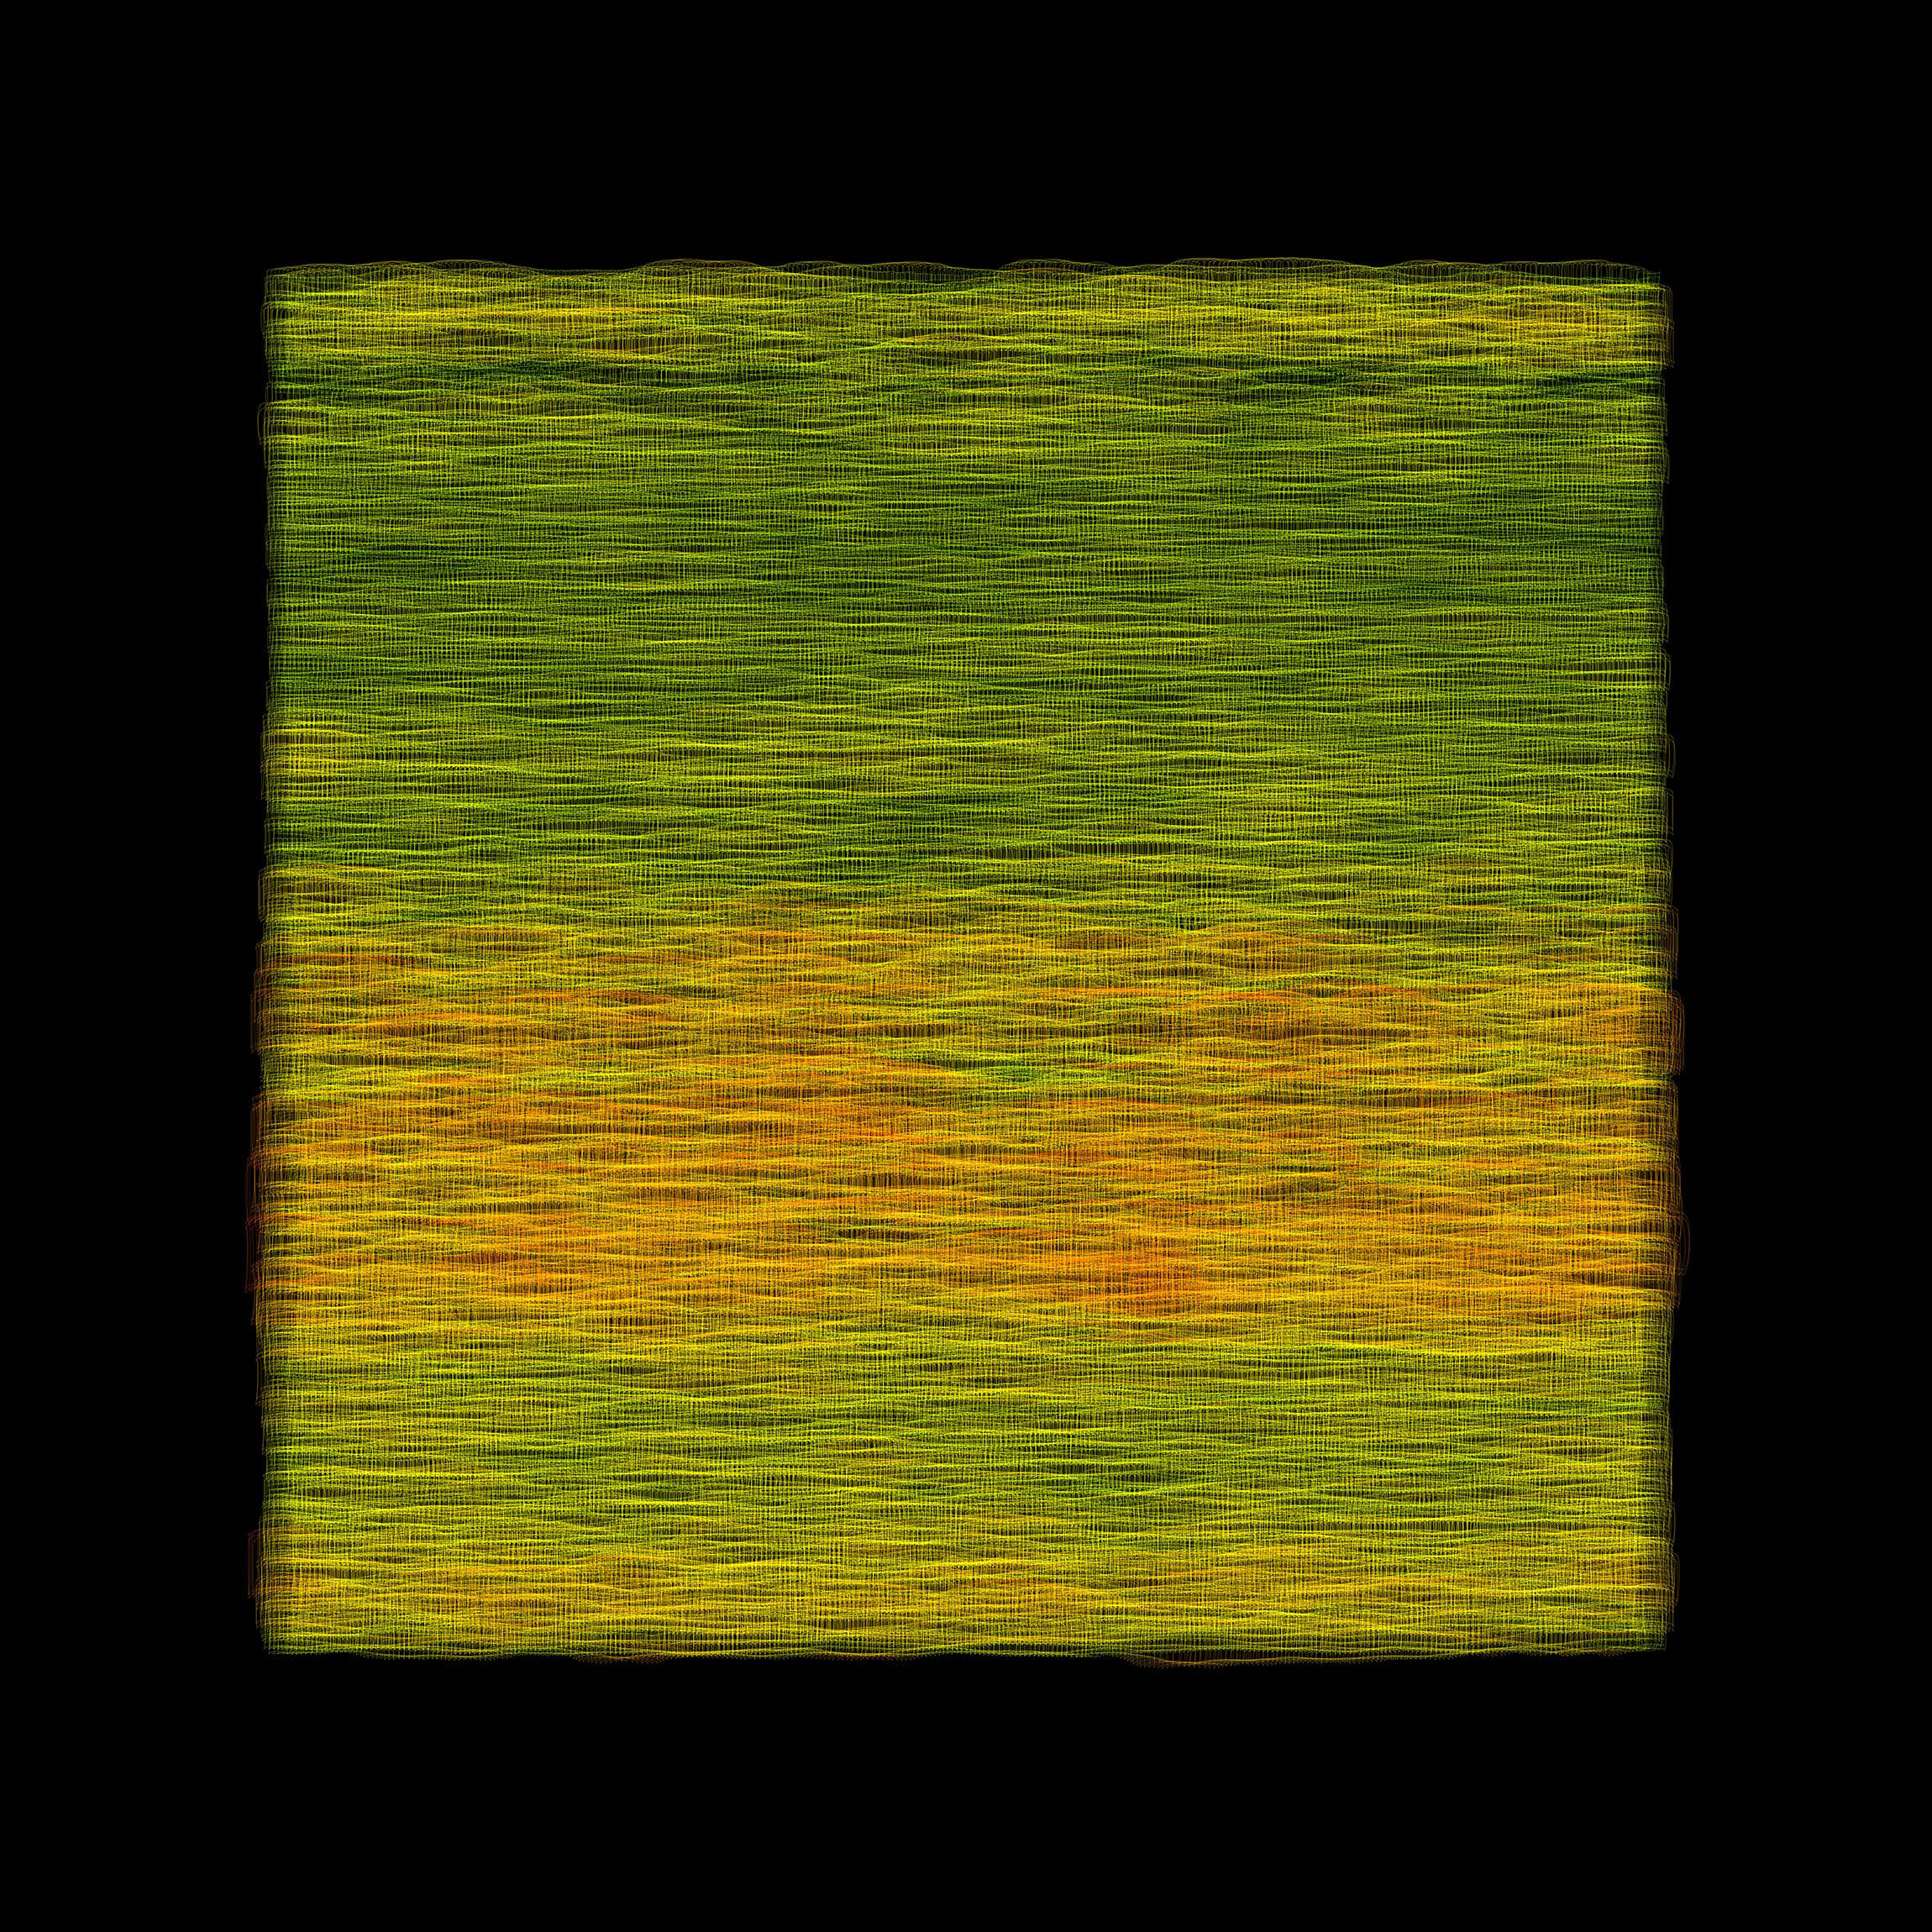
Winds.Process.2012.05
In this series of wind drawings, a small square is placed representing wind conditions each second of a day. Faster wind speeds make larger squares and wind direction shifts its shape as if the wind were blowing on it. The first data point is plotted on the top-left, the next on the right and so on until the end of the row. The next row’s data is plotted from right to left. Marks proceed from side to side and continue down the drawing until all of the day’s data has been processed.