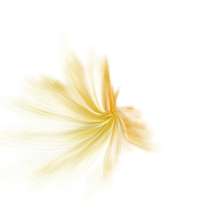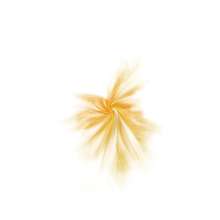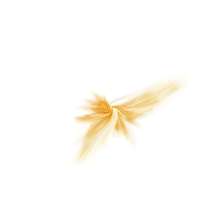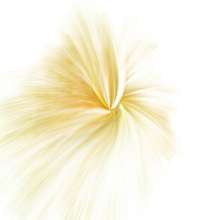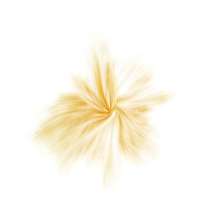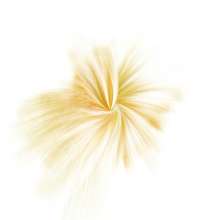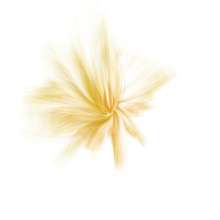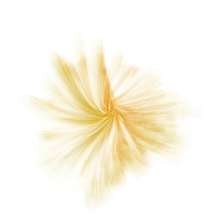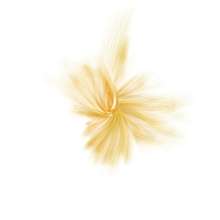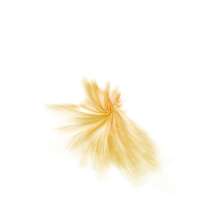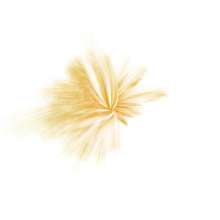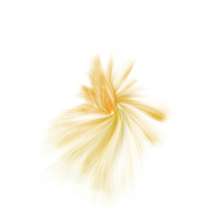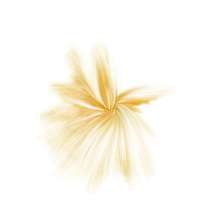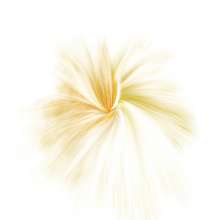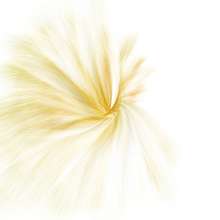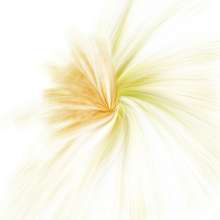
Winds.Process.2012.04
This drawing process represents wind data like the arms of a 24-hour clock. For each second of day, a line is drawn from the center to a specific angle relating to time. Lines representing data collected at midnight are drawn from the center to a point near the top and, as time progresses, lines are placed clockwise around the center. The end points of lines based on data from 6:00 a.m. appear where a three is on a clock, data from noon at a clock’s six and data from 6:00 p.m. at a clock’s nine. Faster wind speeds make longer lines and create a color shift. Wind direction influences the curve of the lines.
