Winds.Process.2012.03
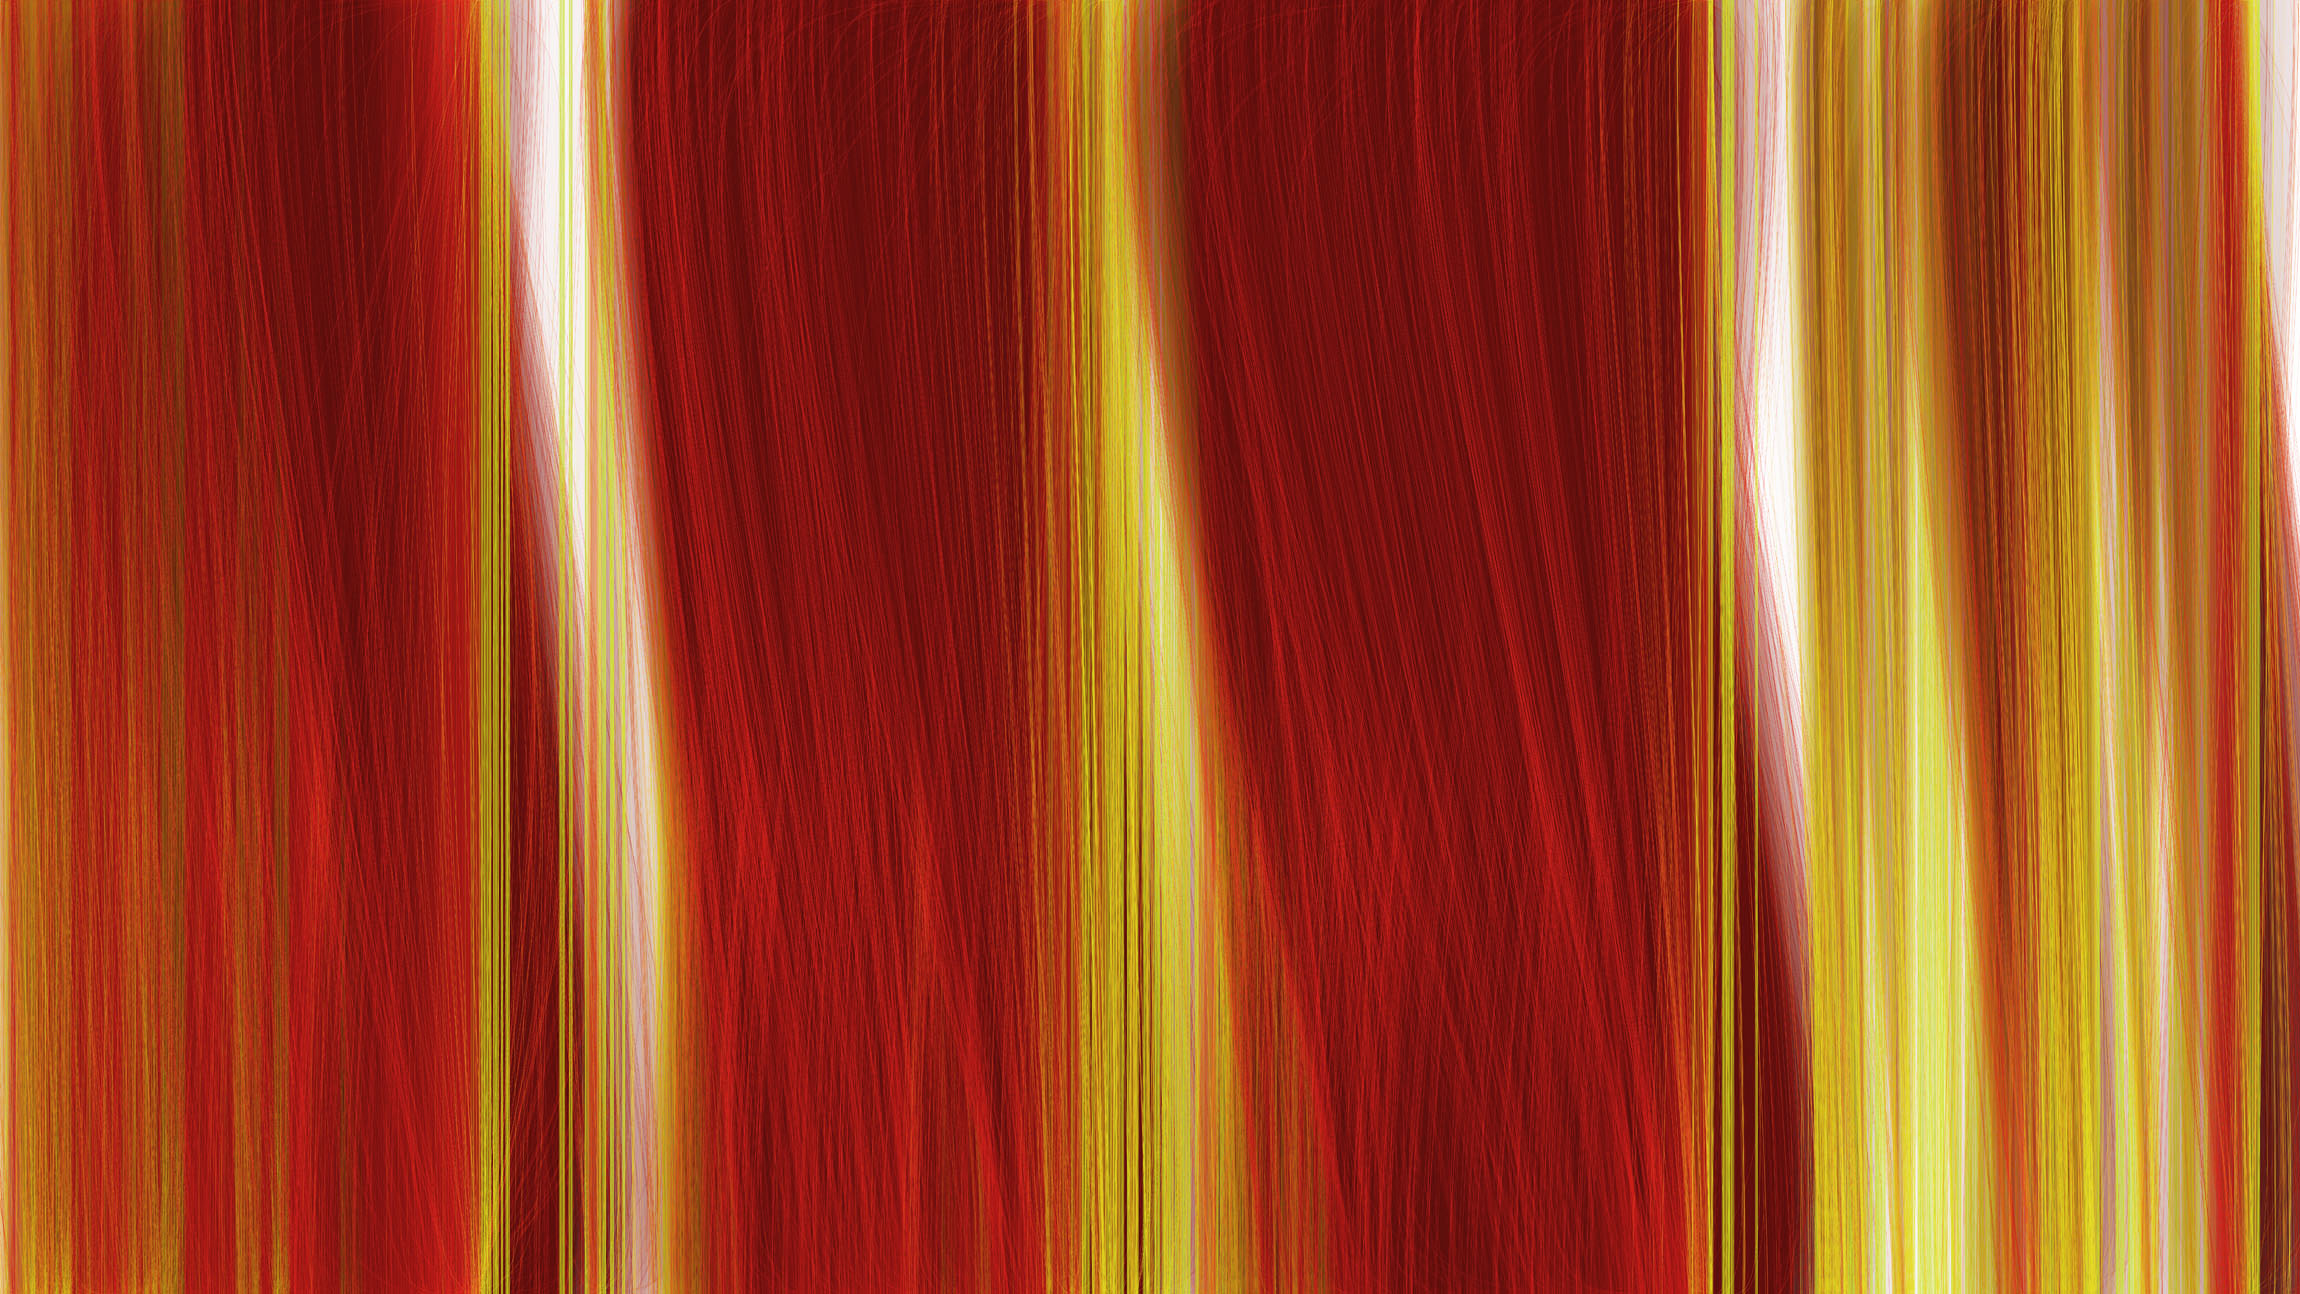
Each drawing made with this process is an interpretation of wind data collected over one day. The vertical lines in these drawings are placed like a timeline with the start of the day on the left, noon in the middle and day’s end on the right. Each line’s shape and color is influenced by wind conditions at the time the datum was collected.
Winds from the east push curves to the left and winds from the west push curves to the right. Wind direction determines the position of each curve’s control point. Drawings with more curves at the top mean winds were from the north or northeast. Bulges in the middle mean winds were from southerly directions and ones at the bottom were caused by winds from the west or northwest. Faster winds set curved line control points farther away from the line’s end points. Wind speed also causes shifts in color.