Winds.Process2012.01
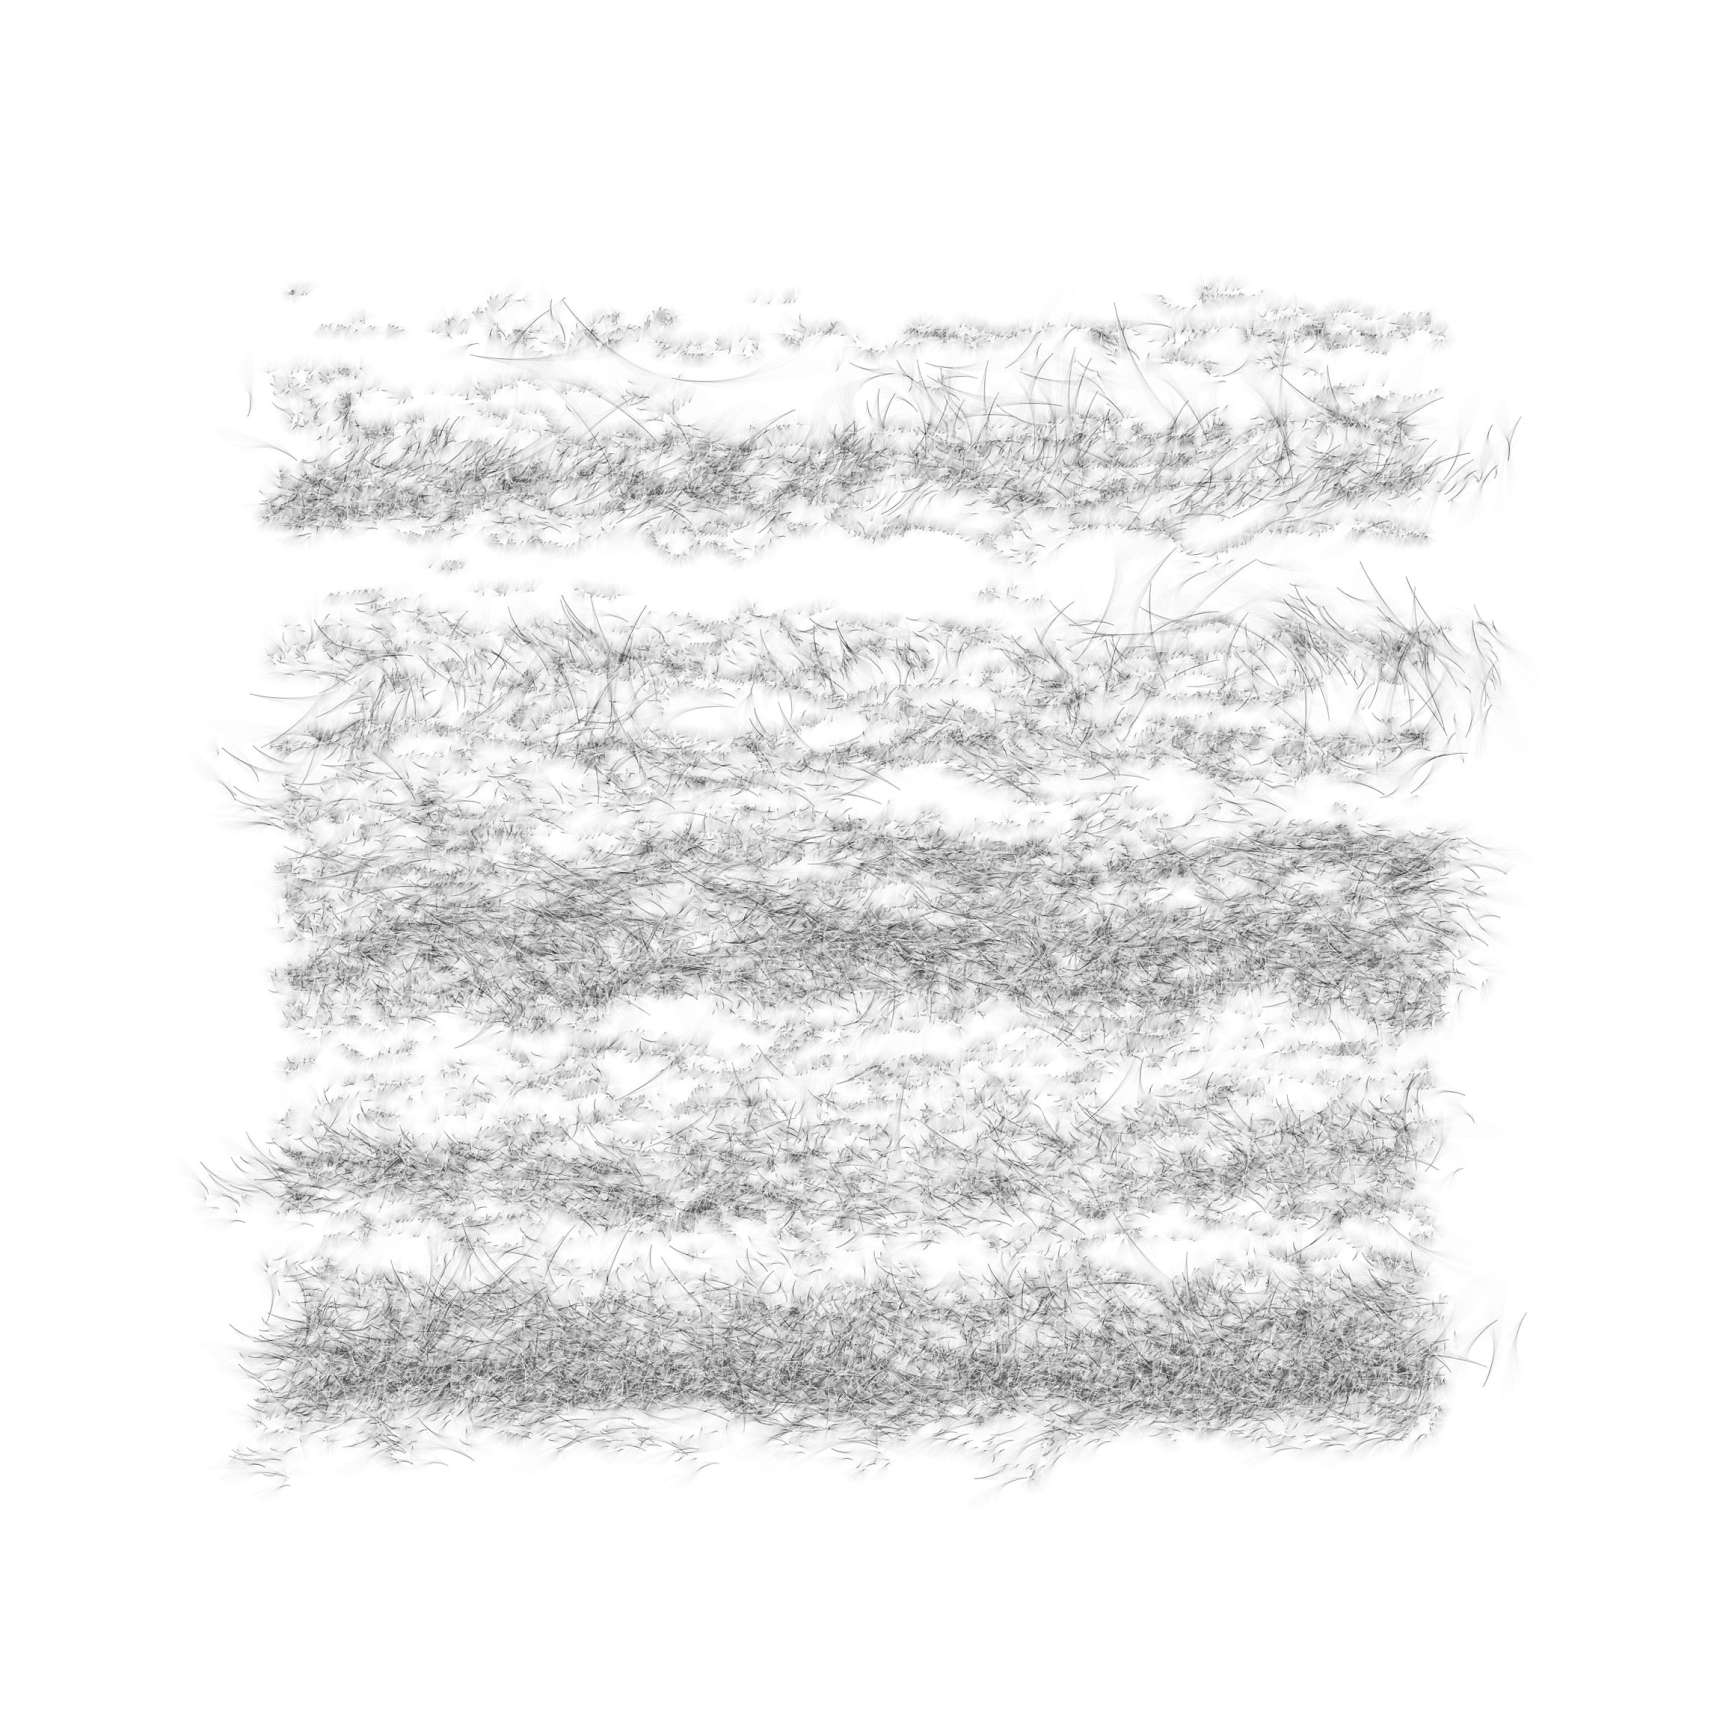
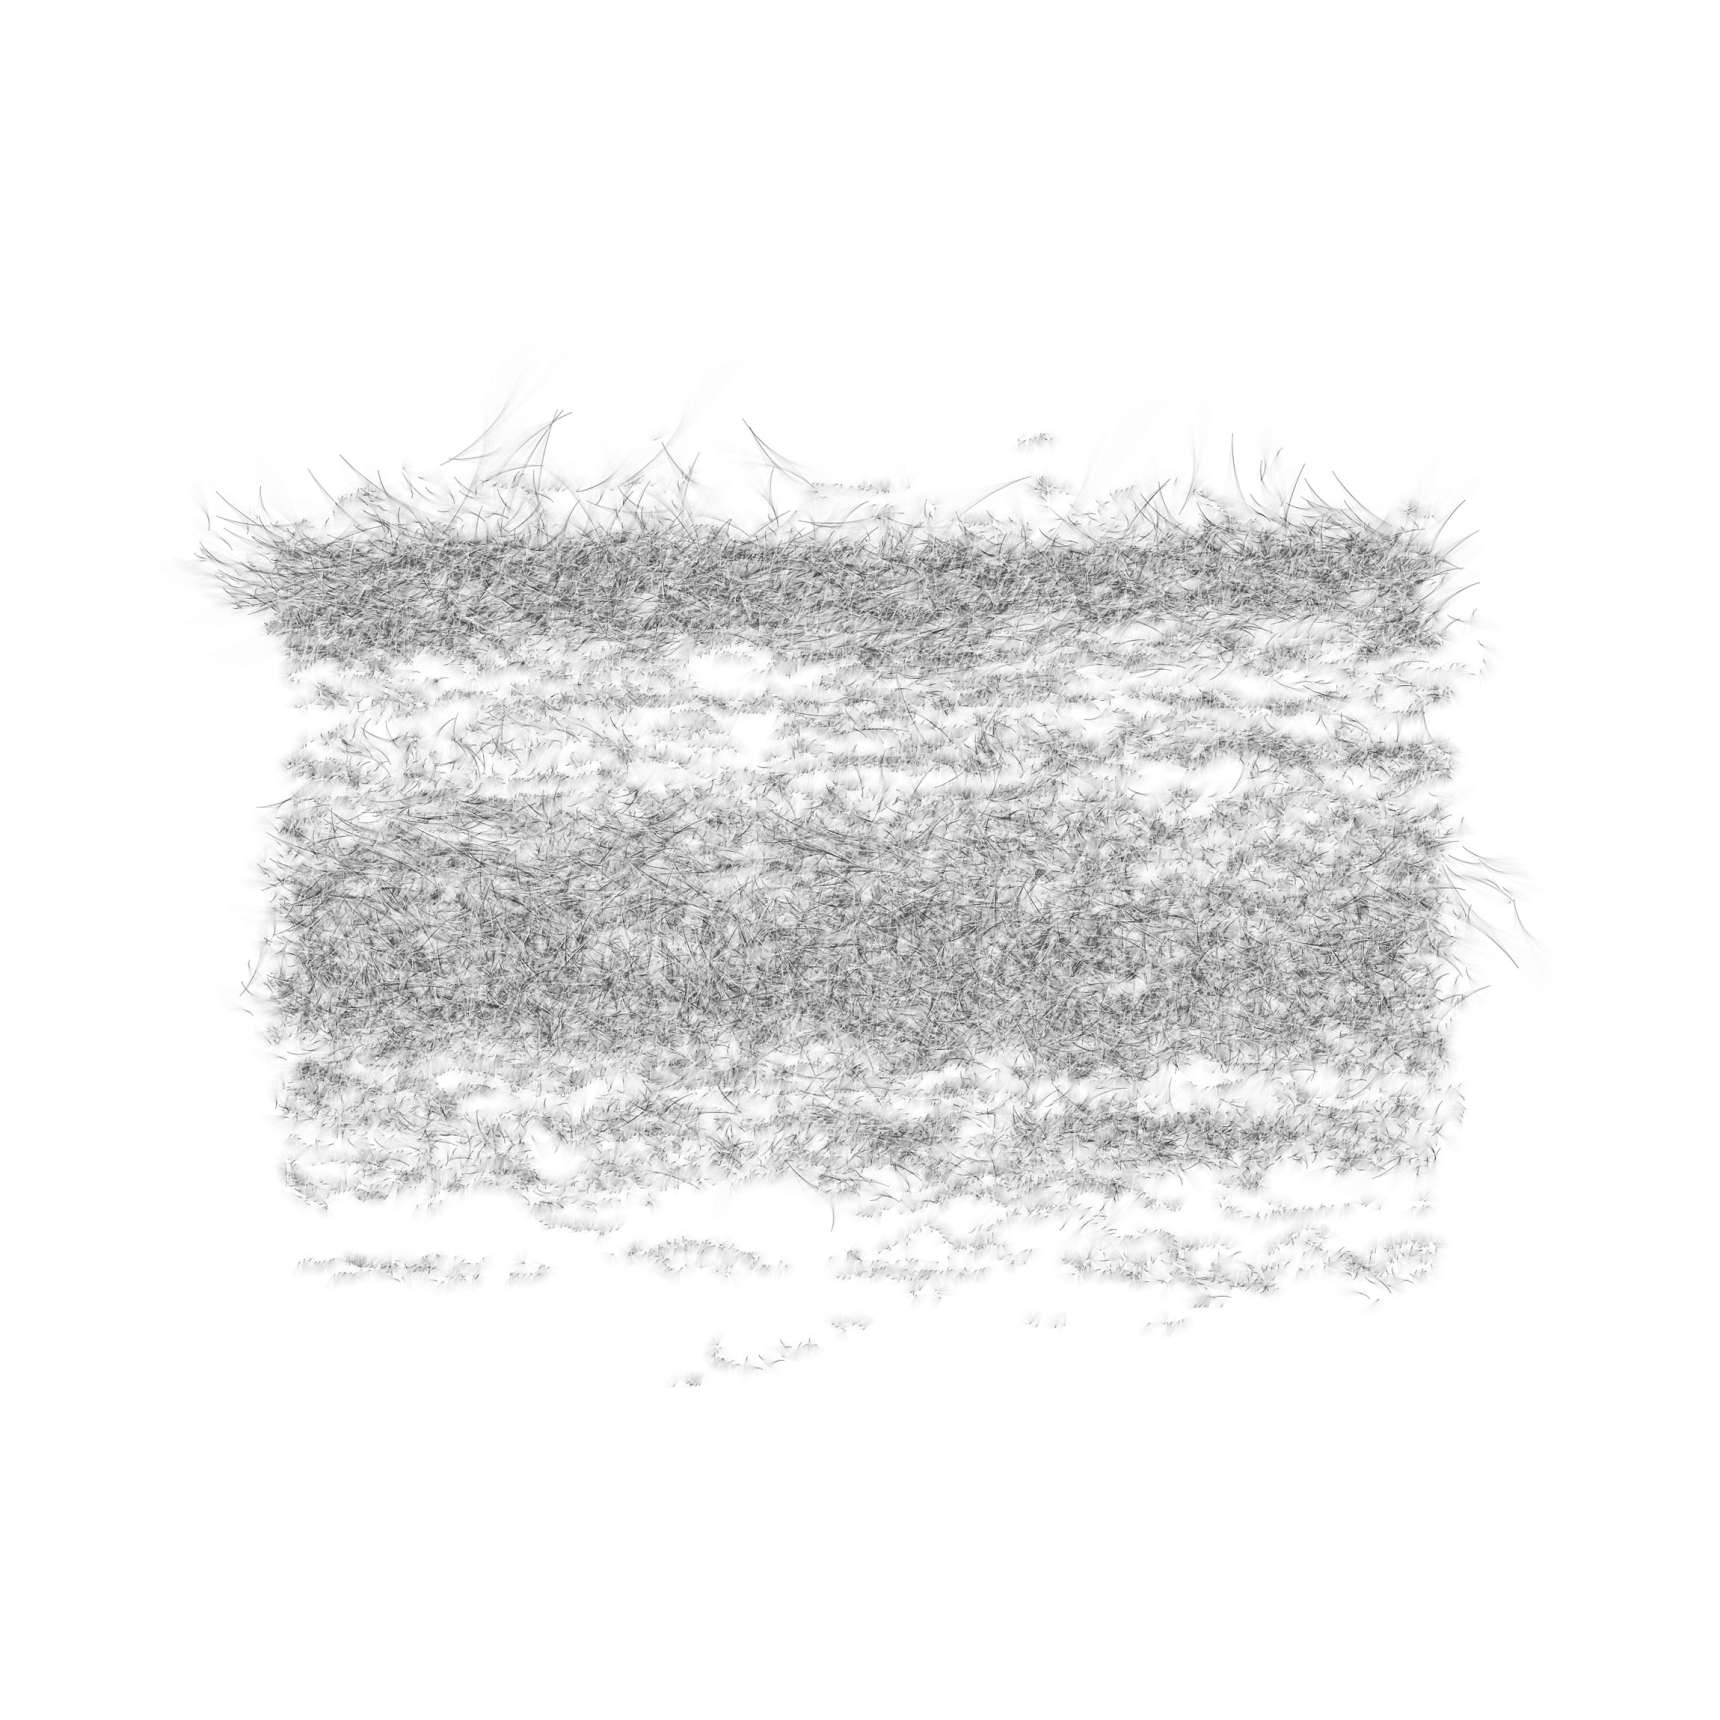
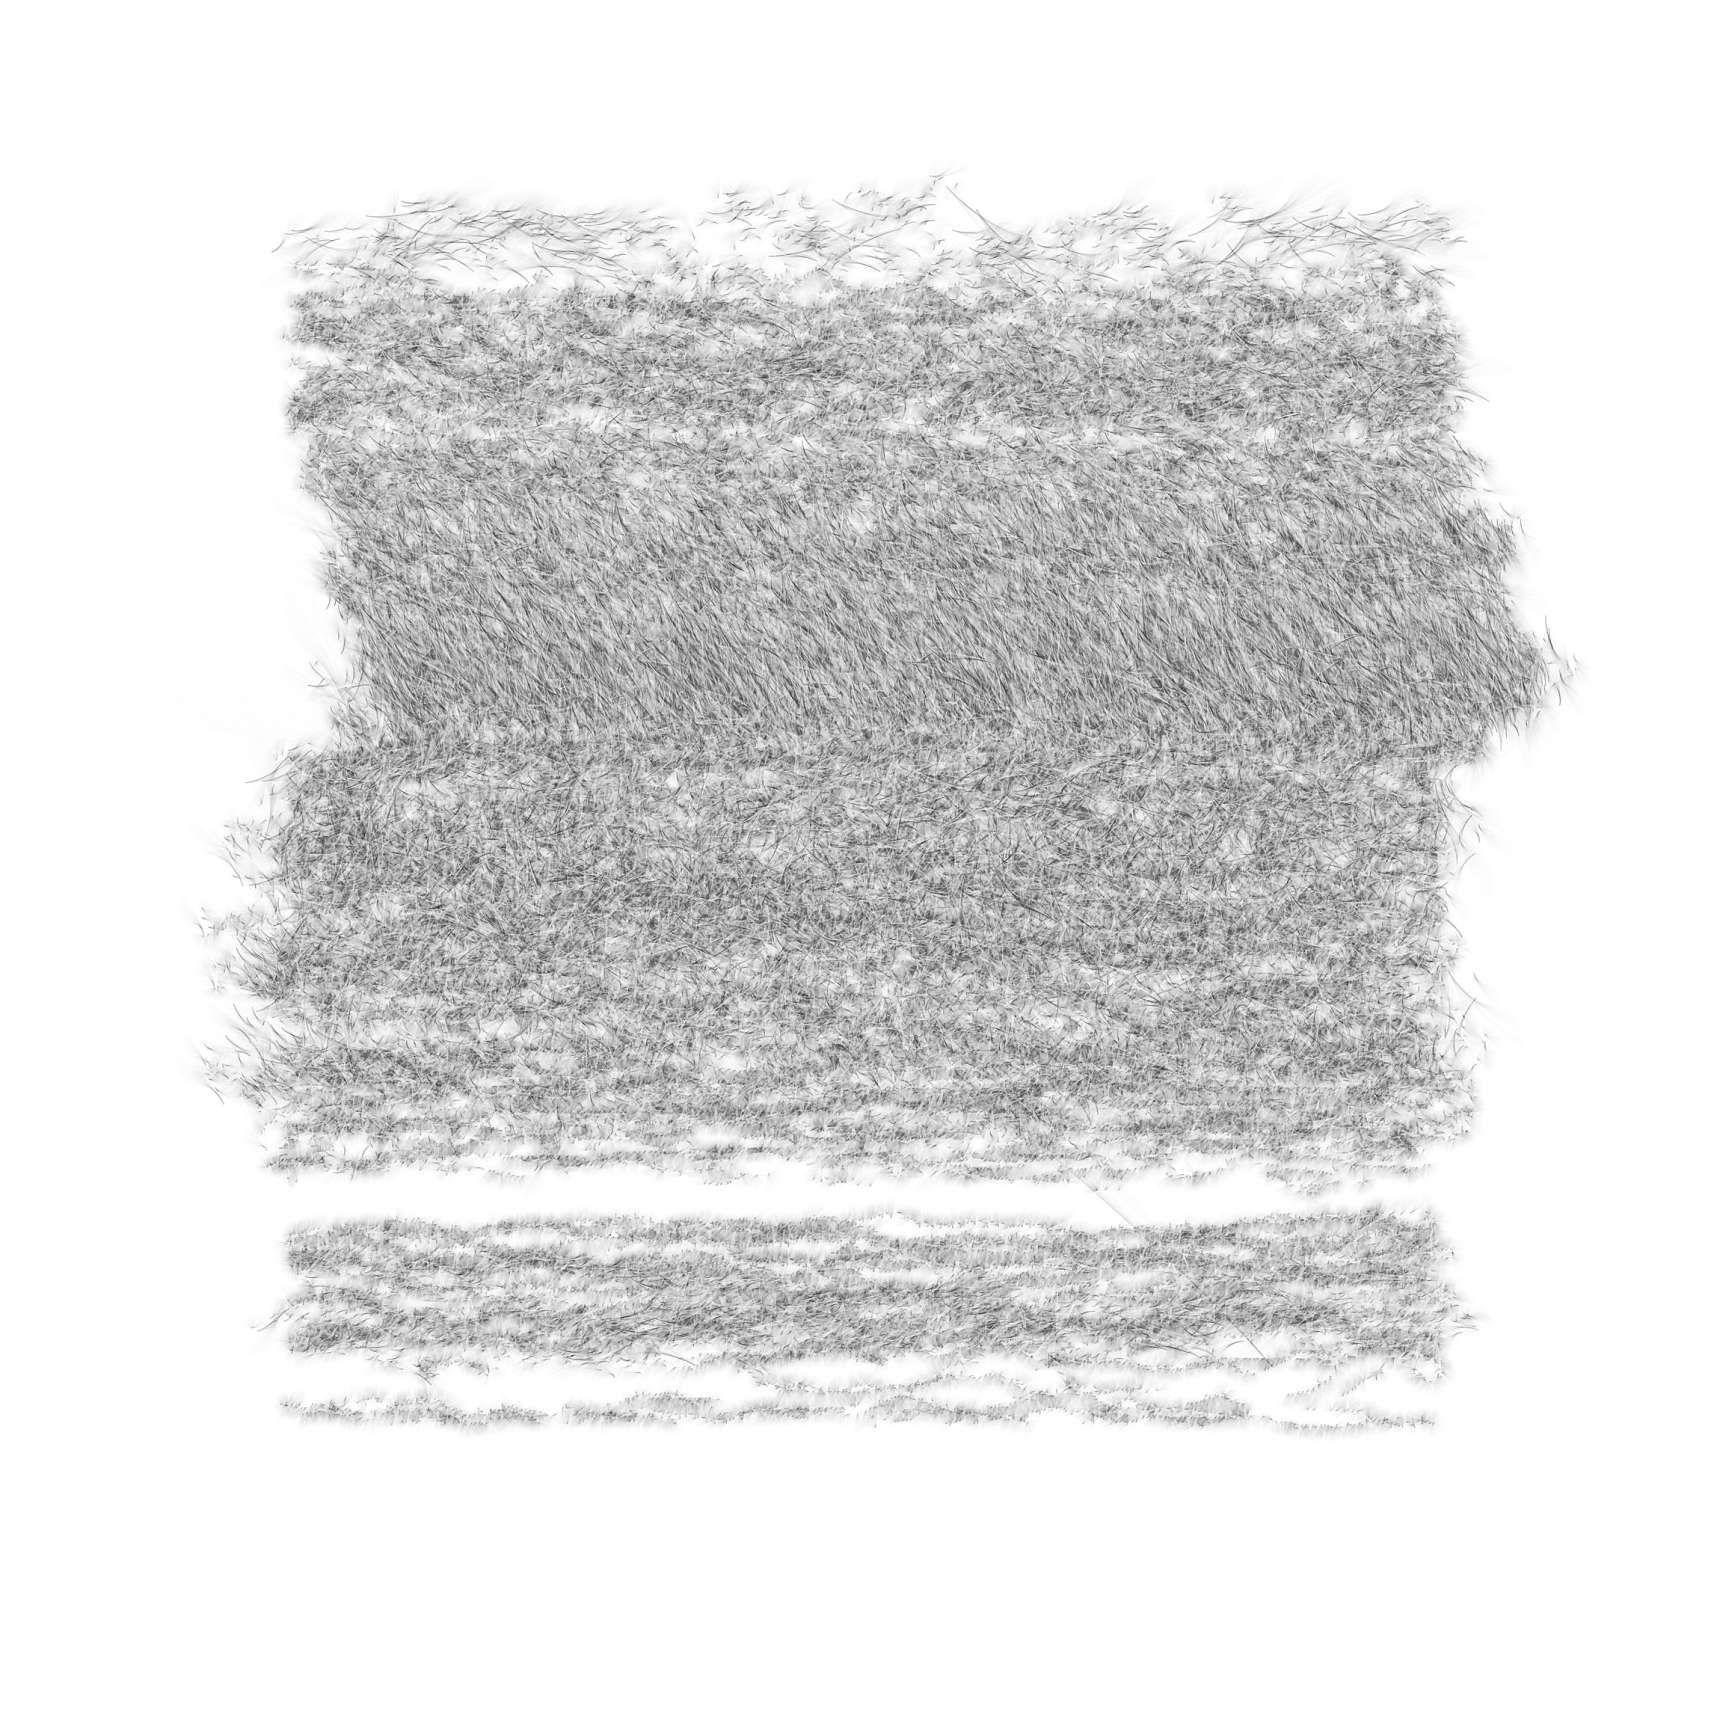
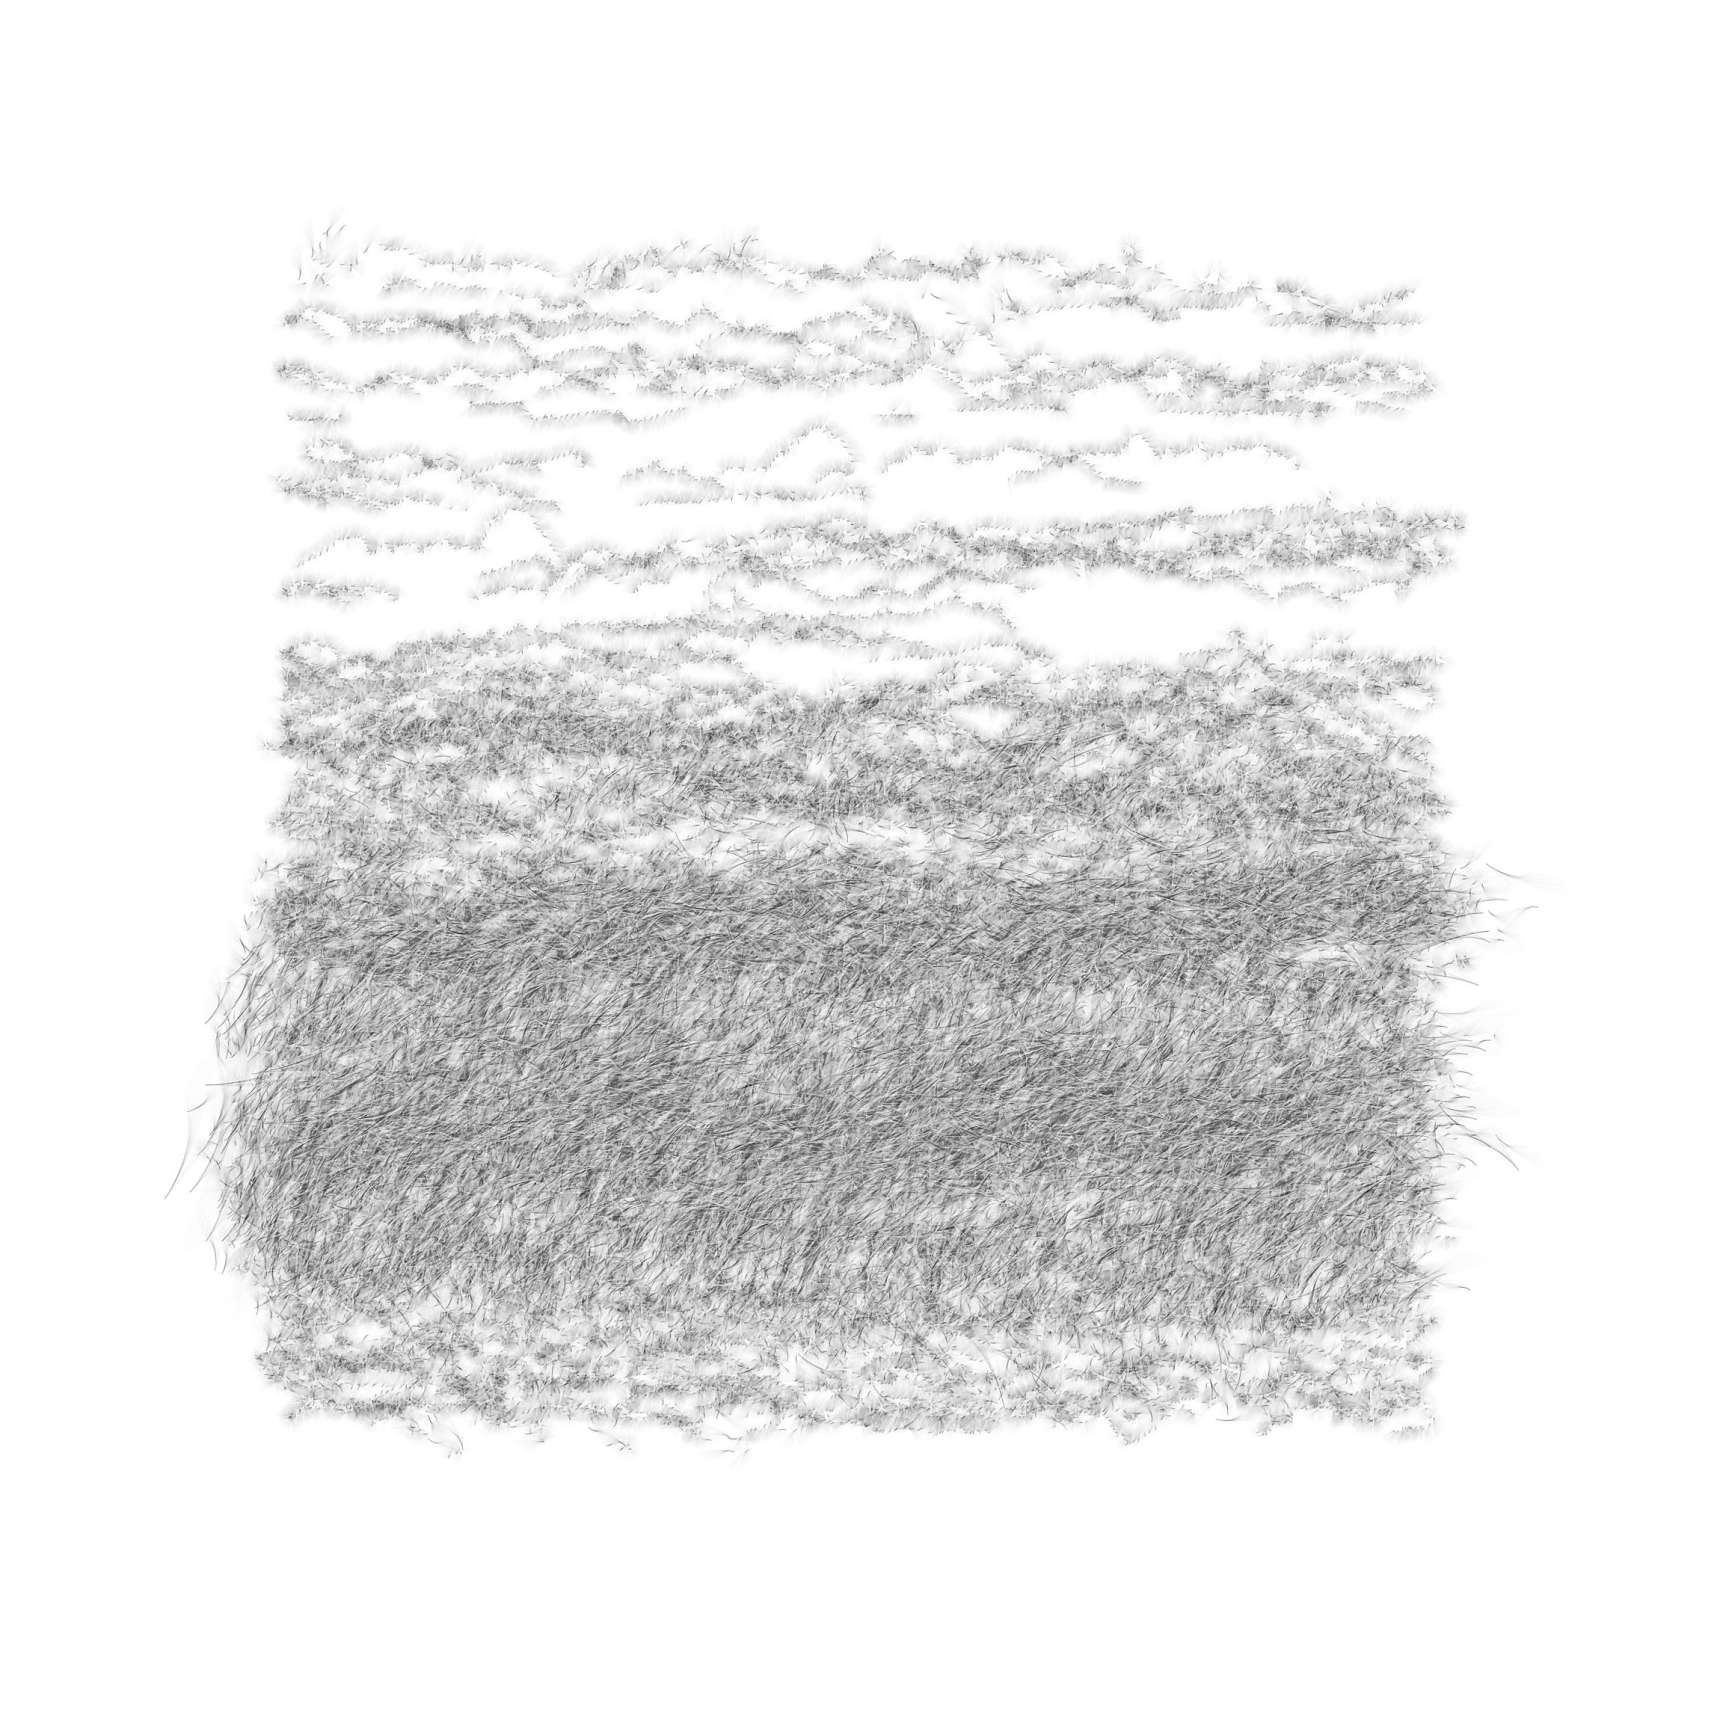
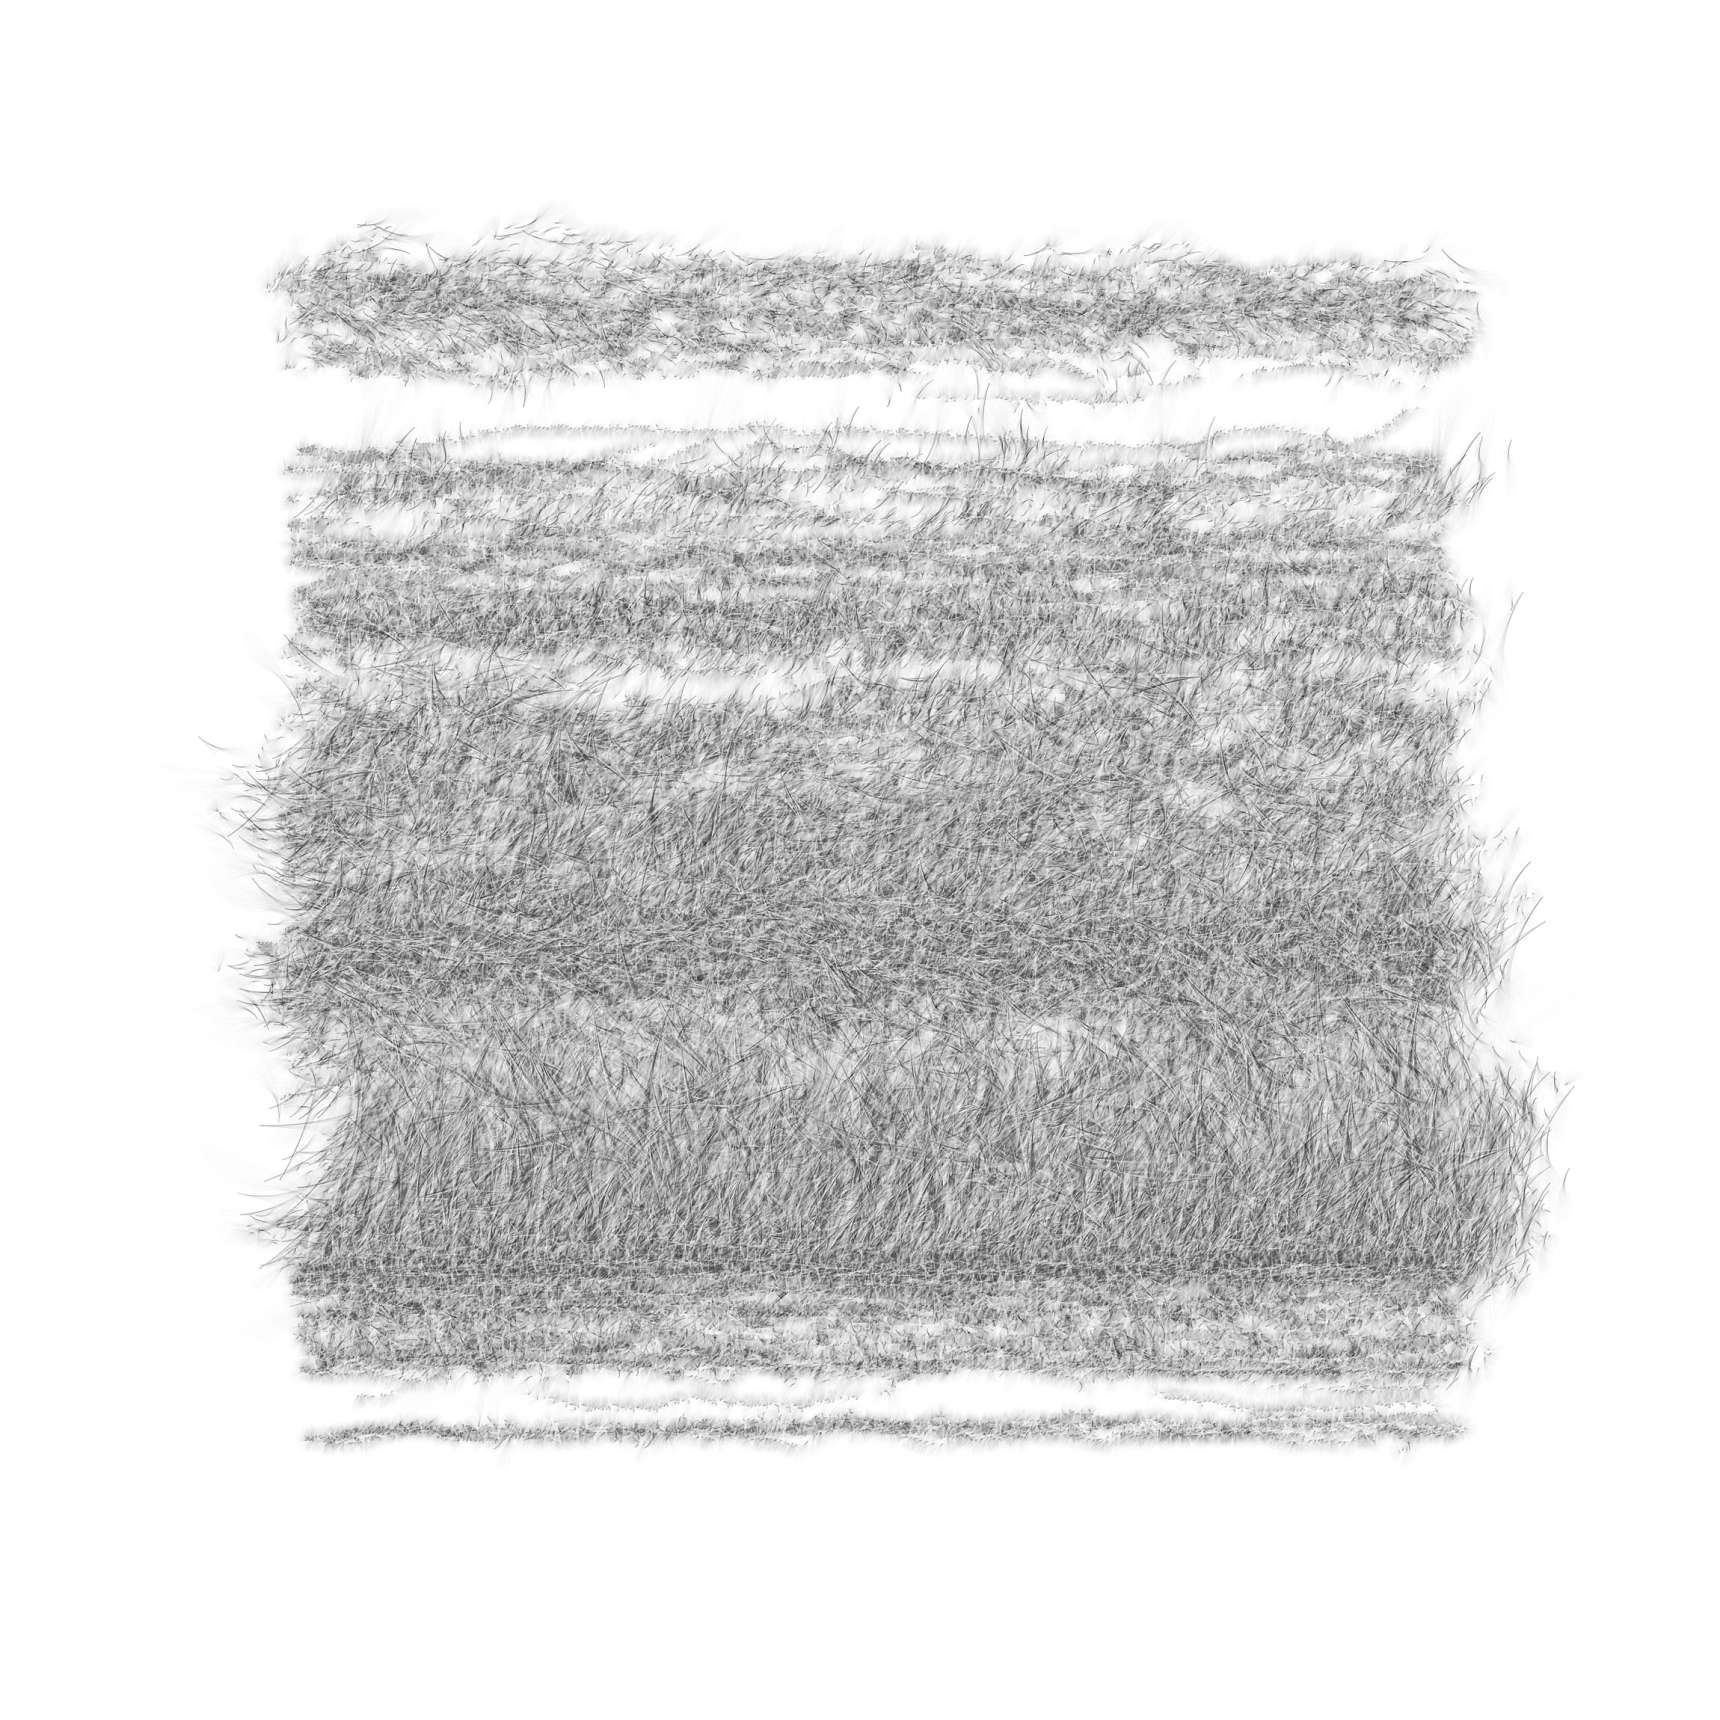
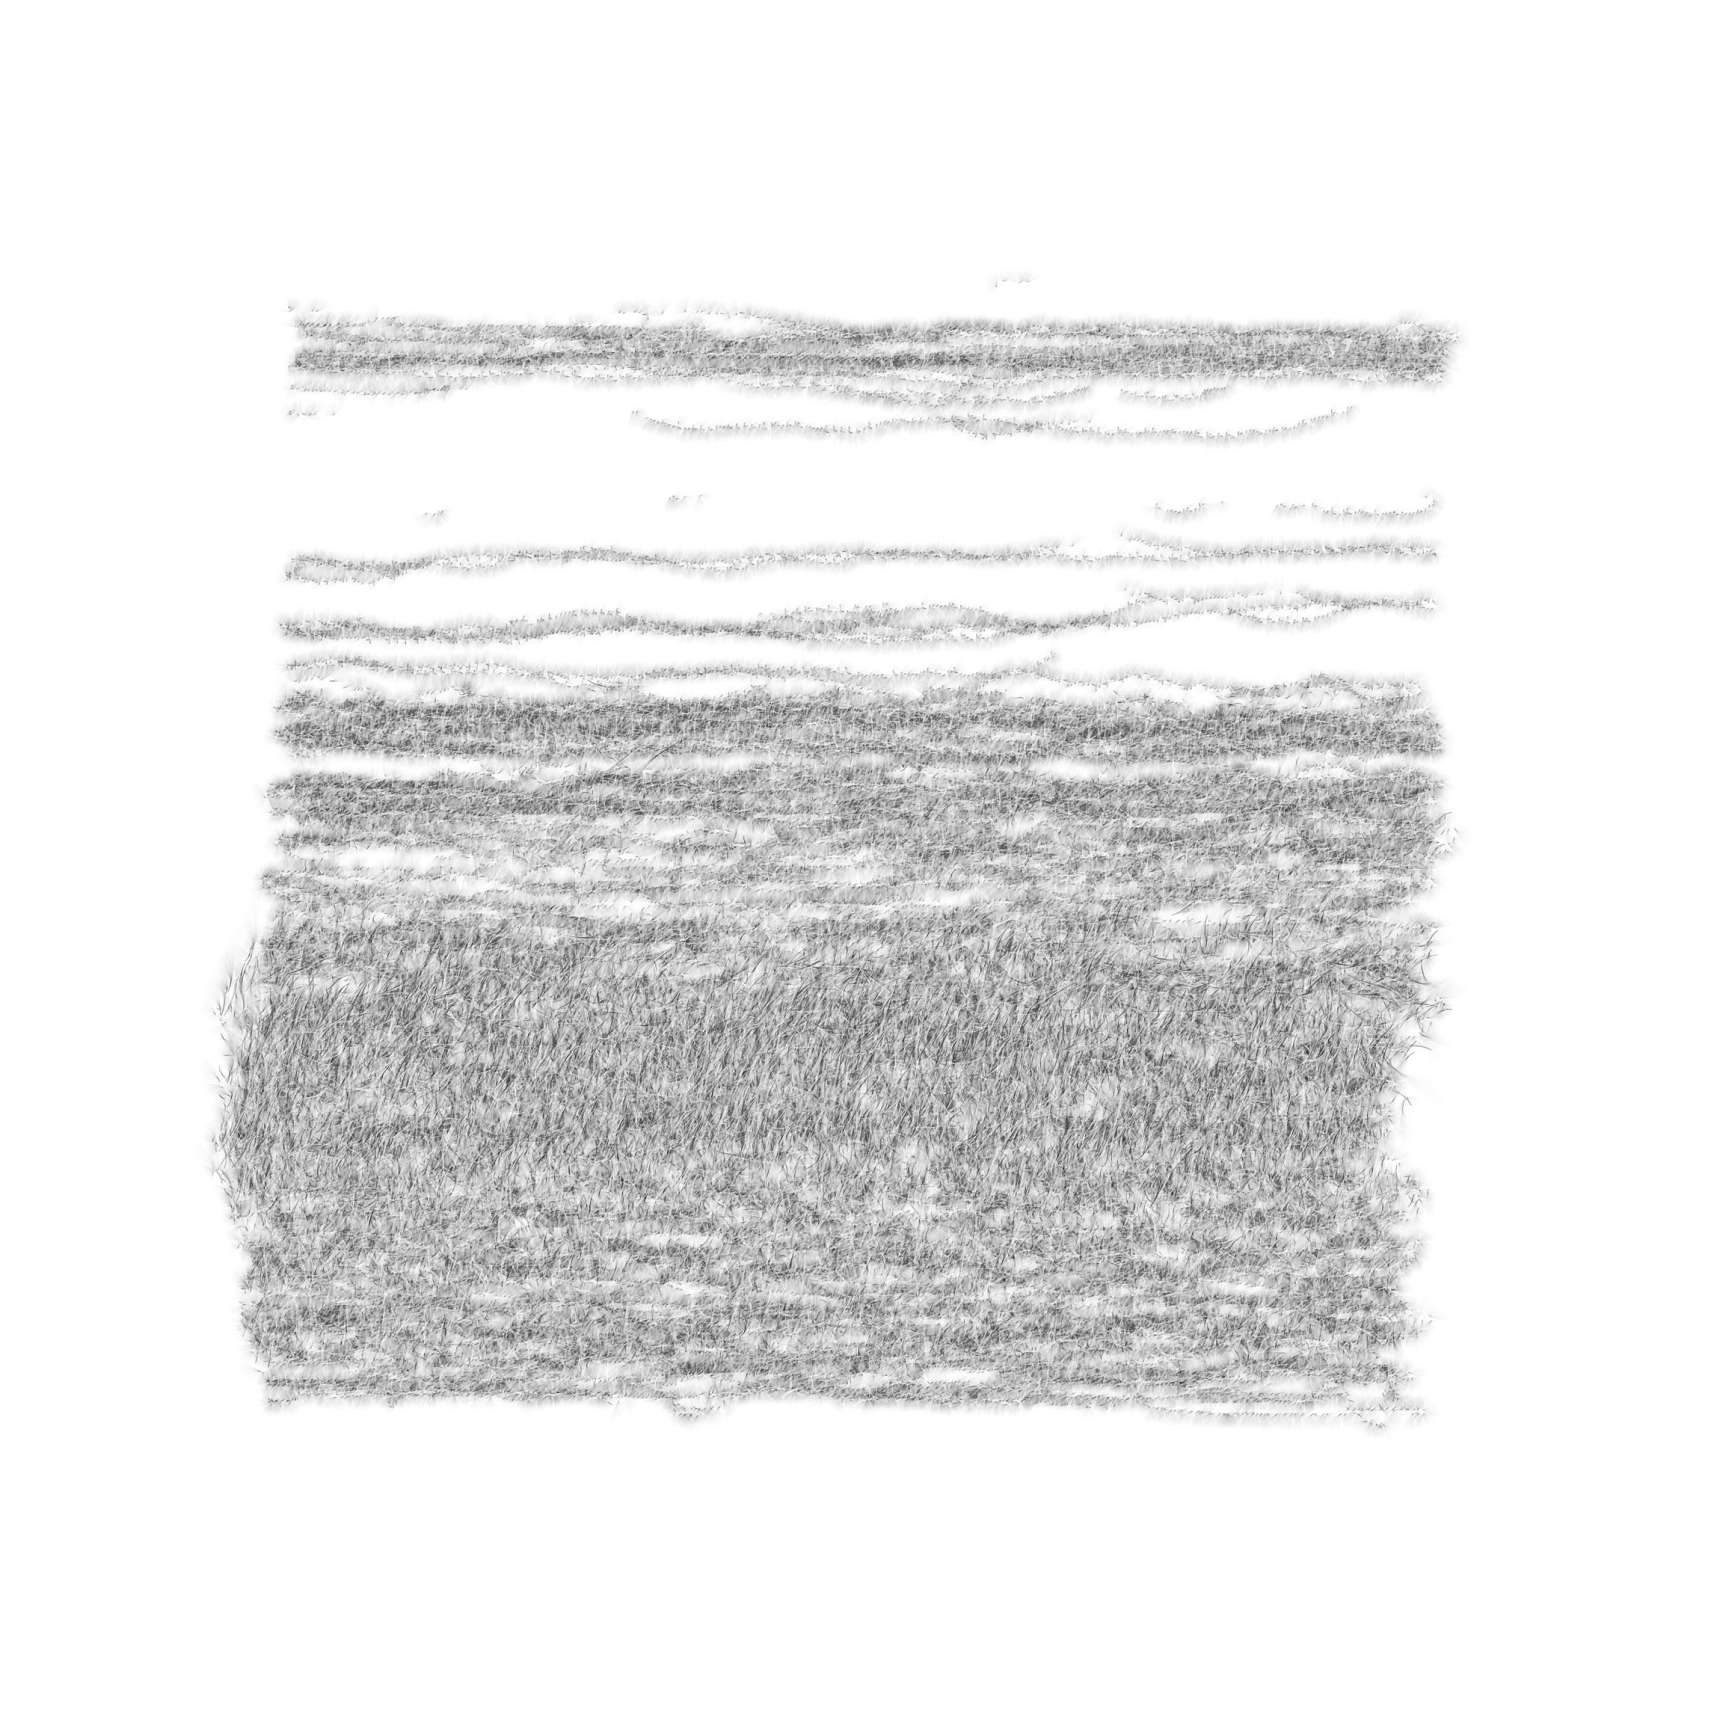
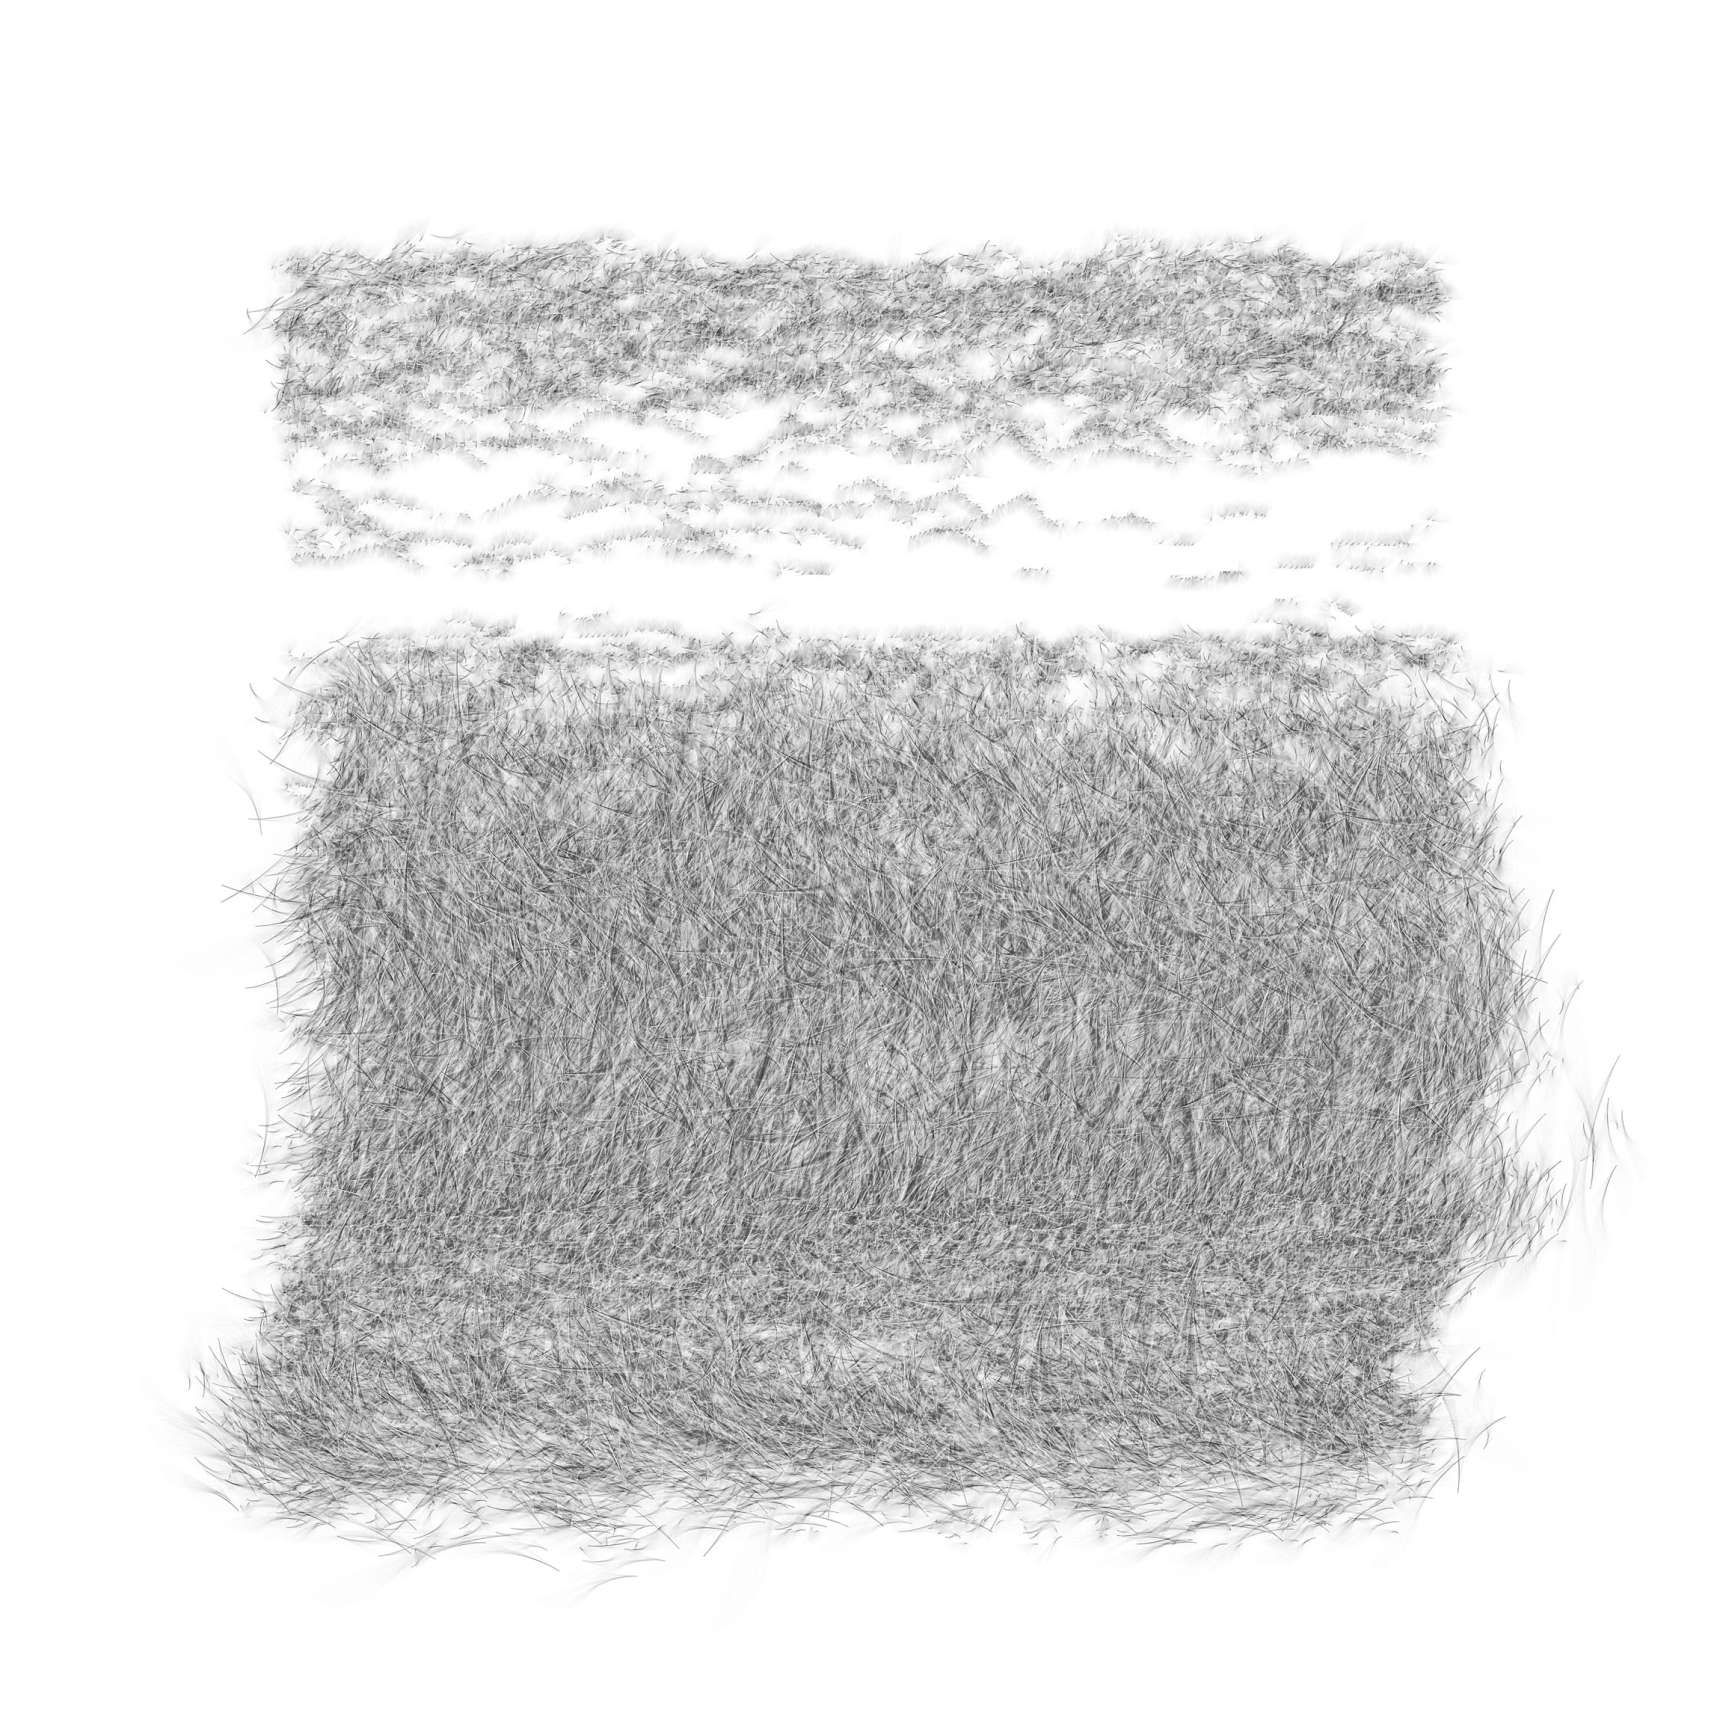
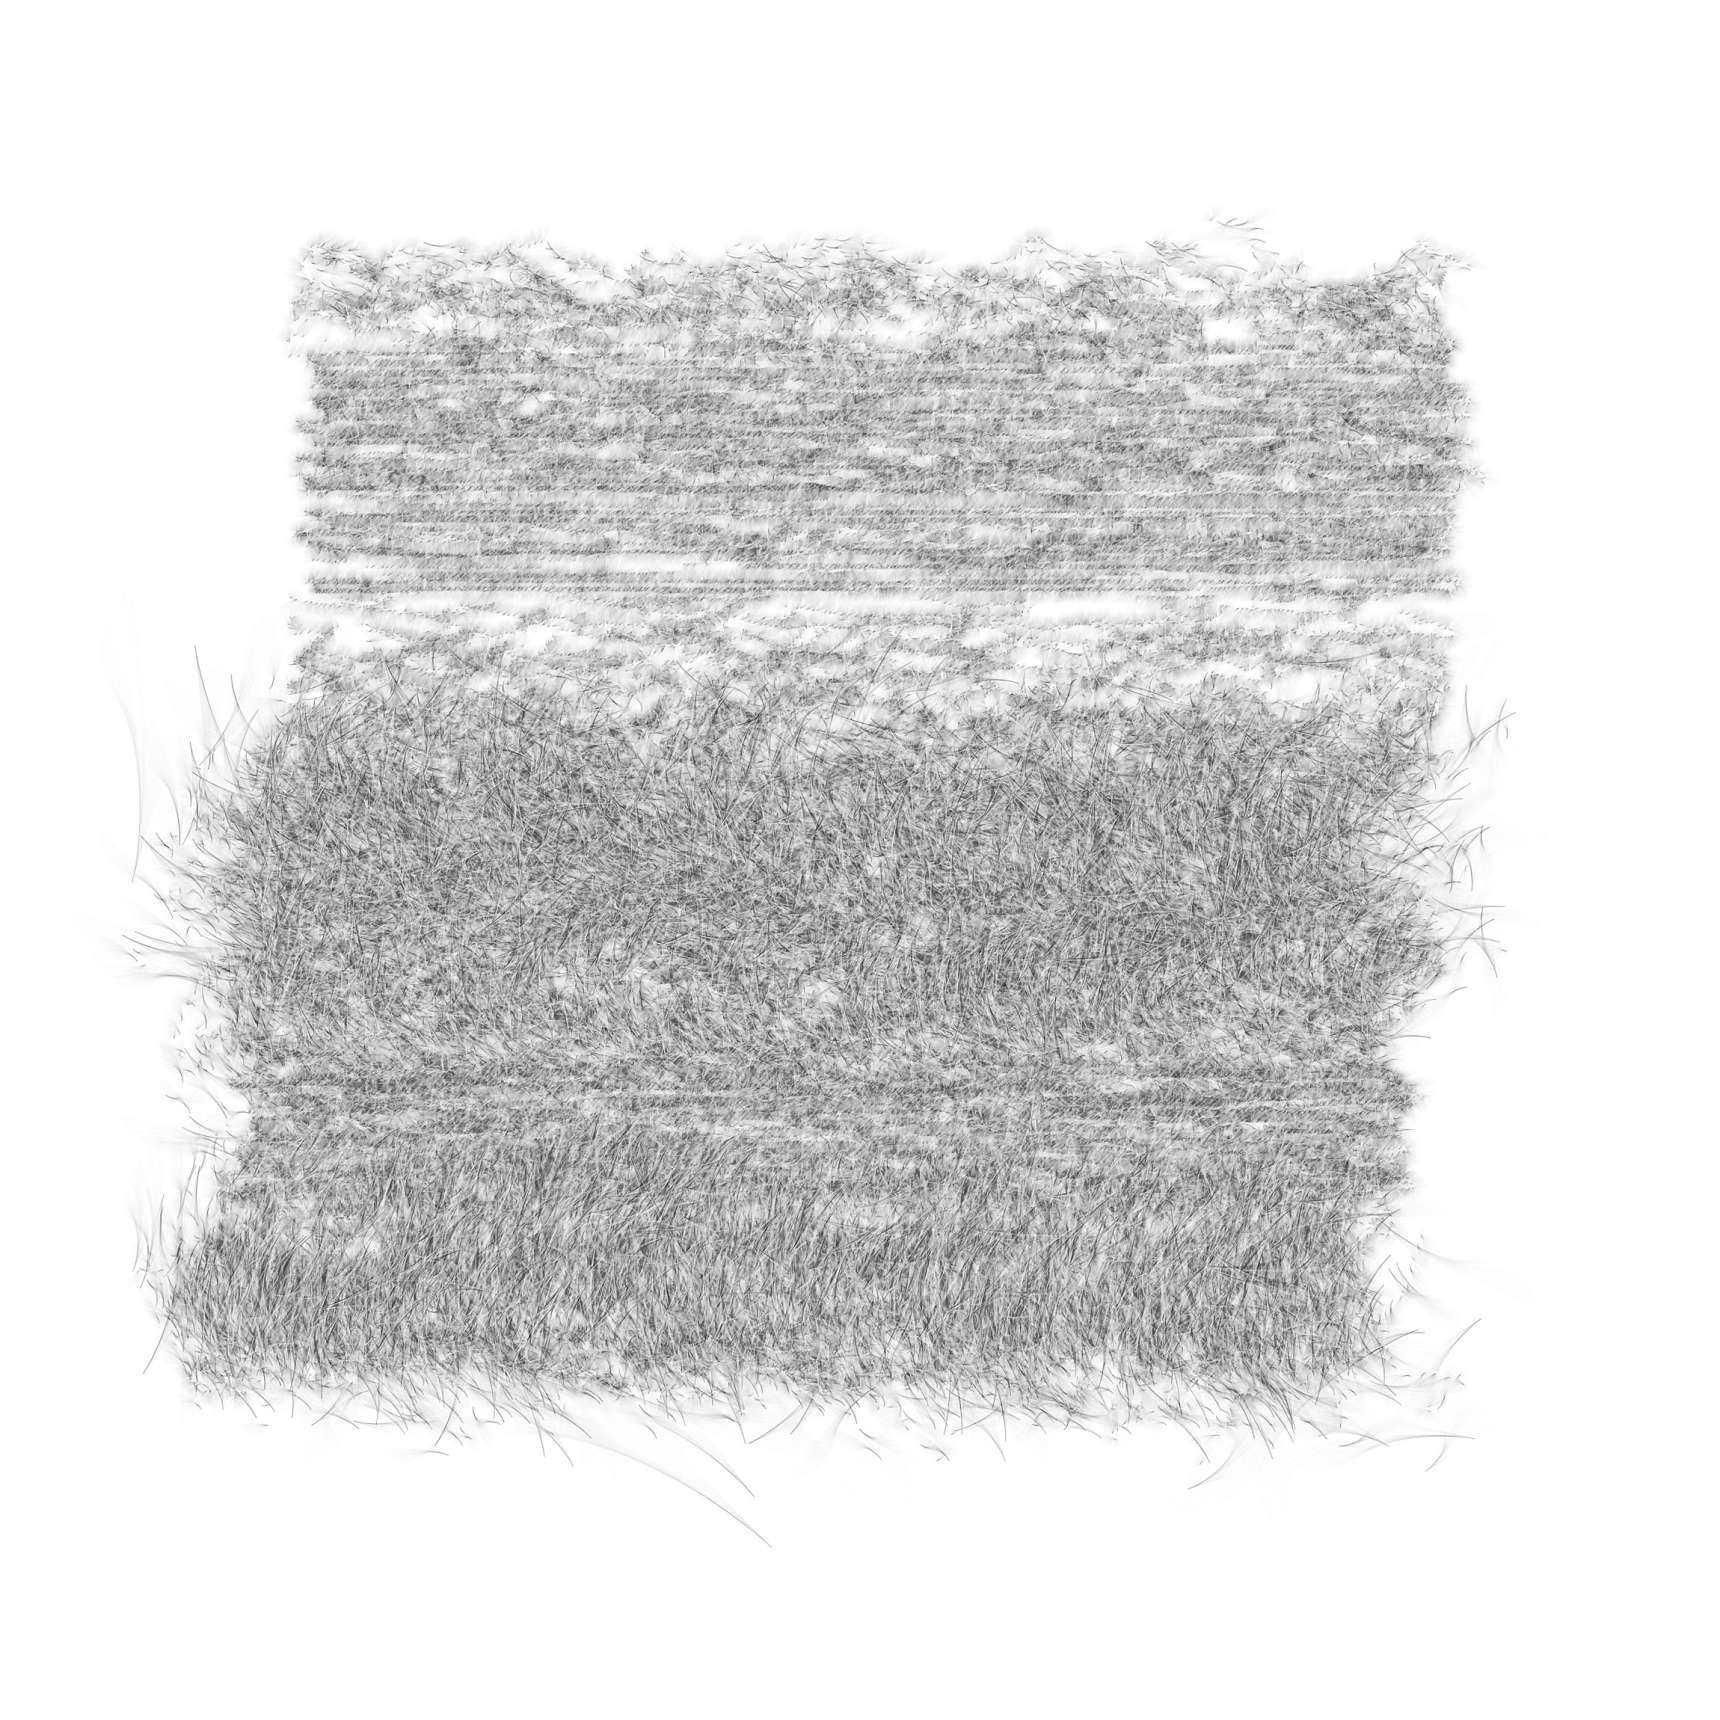
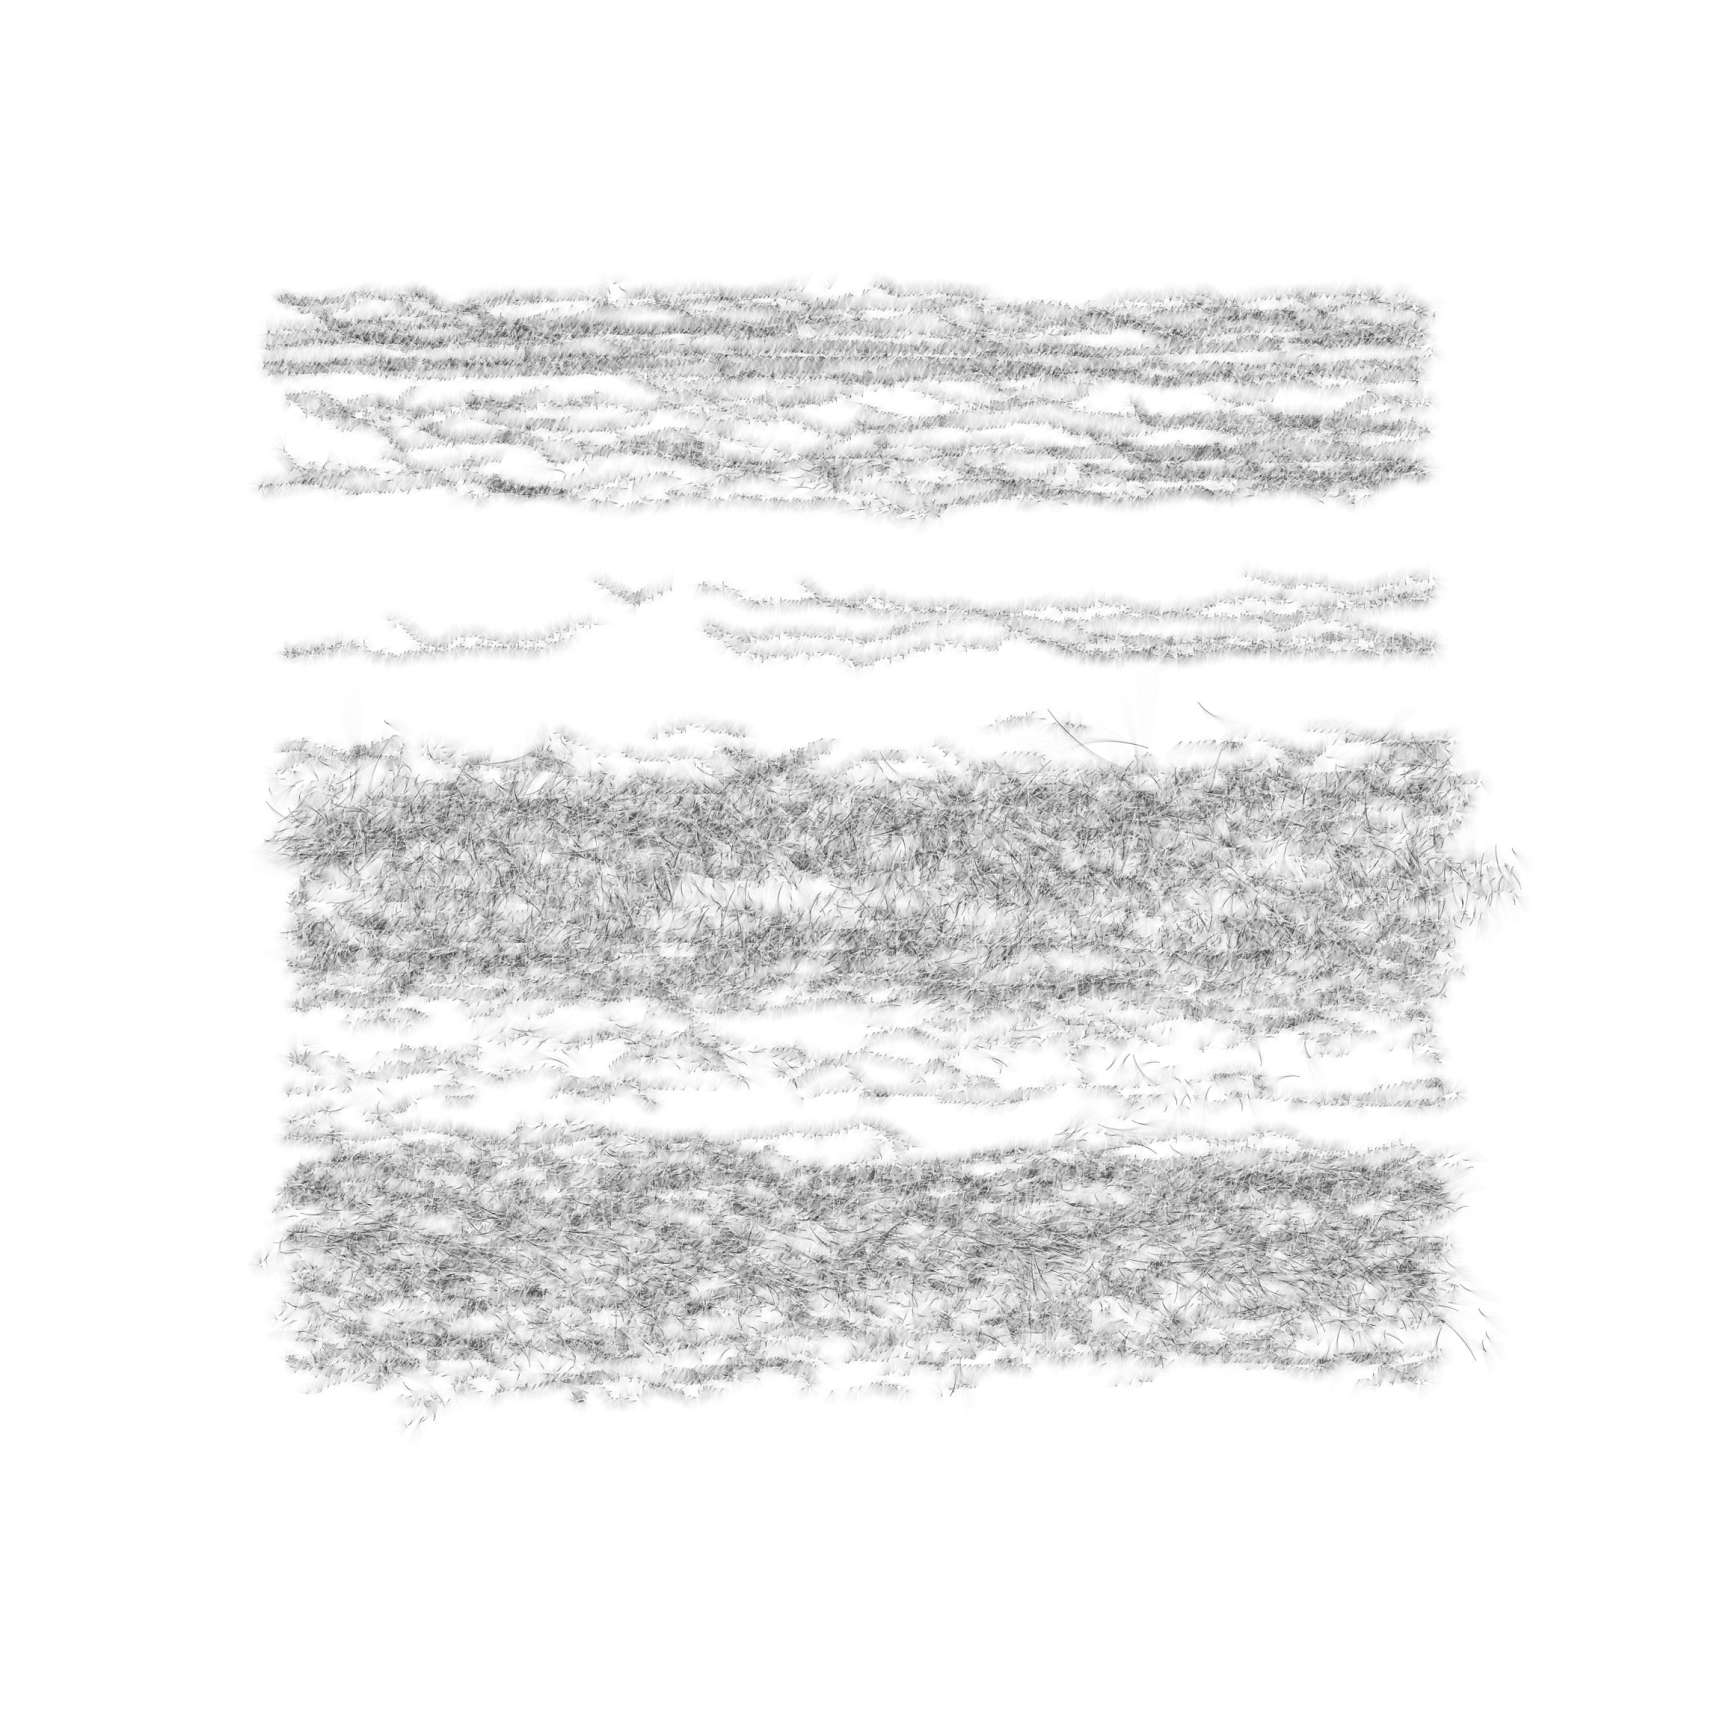
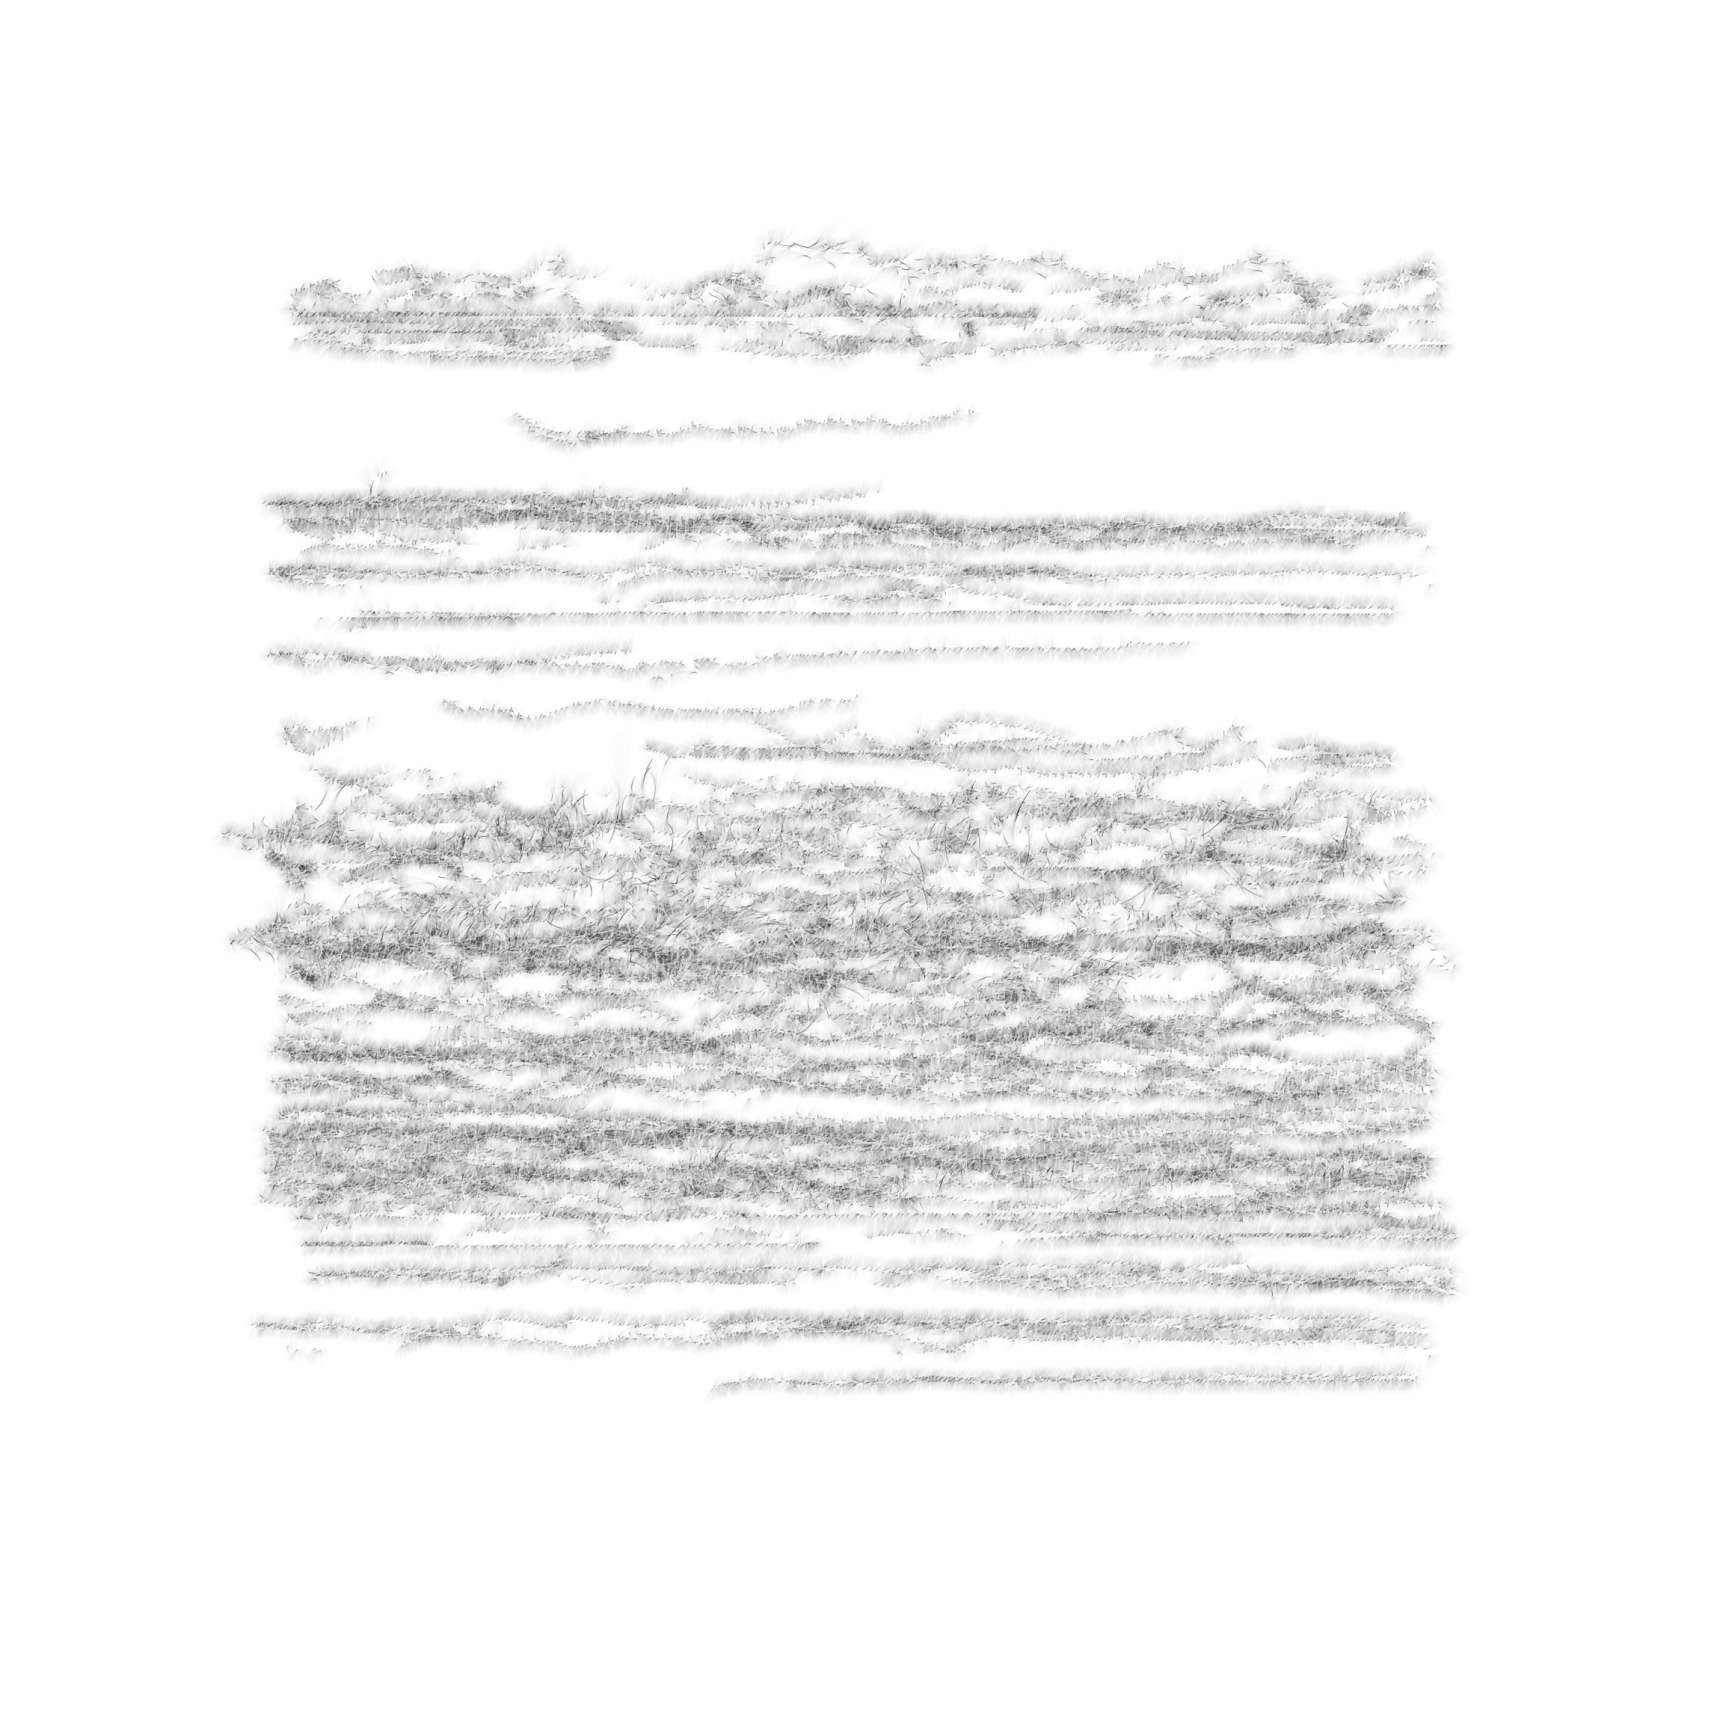
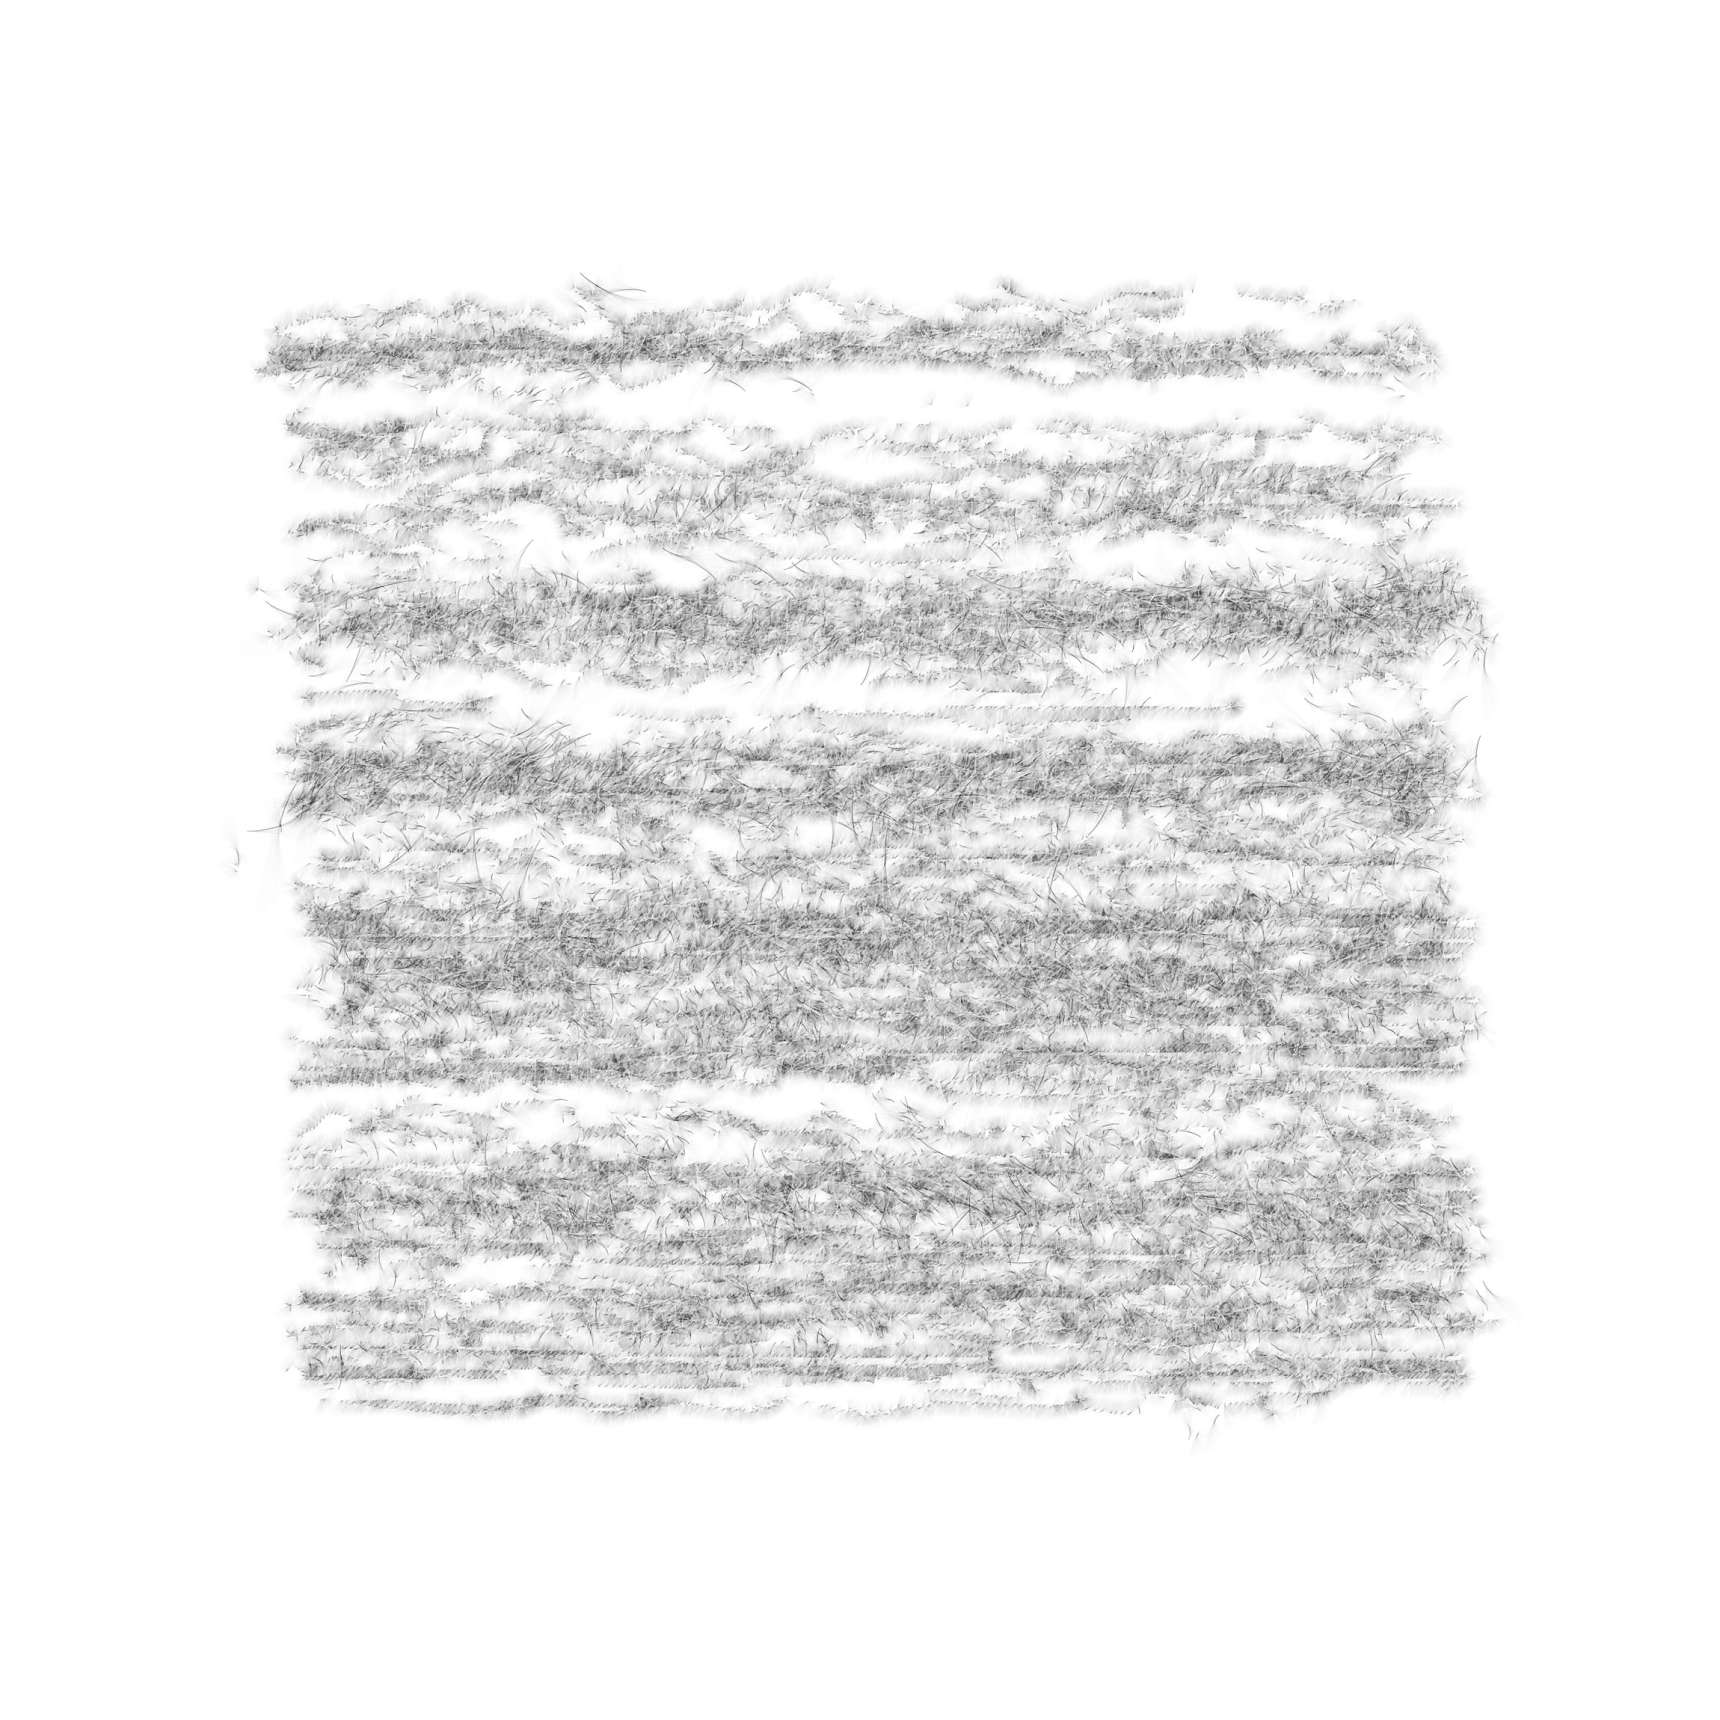
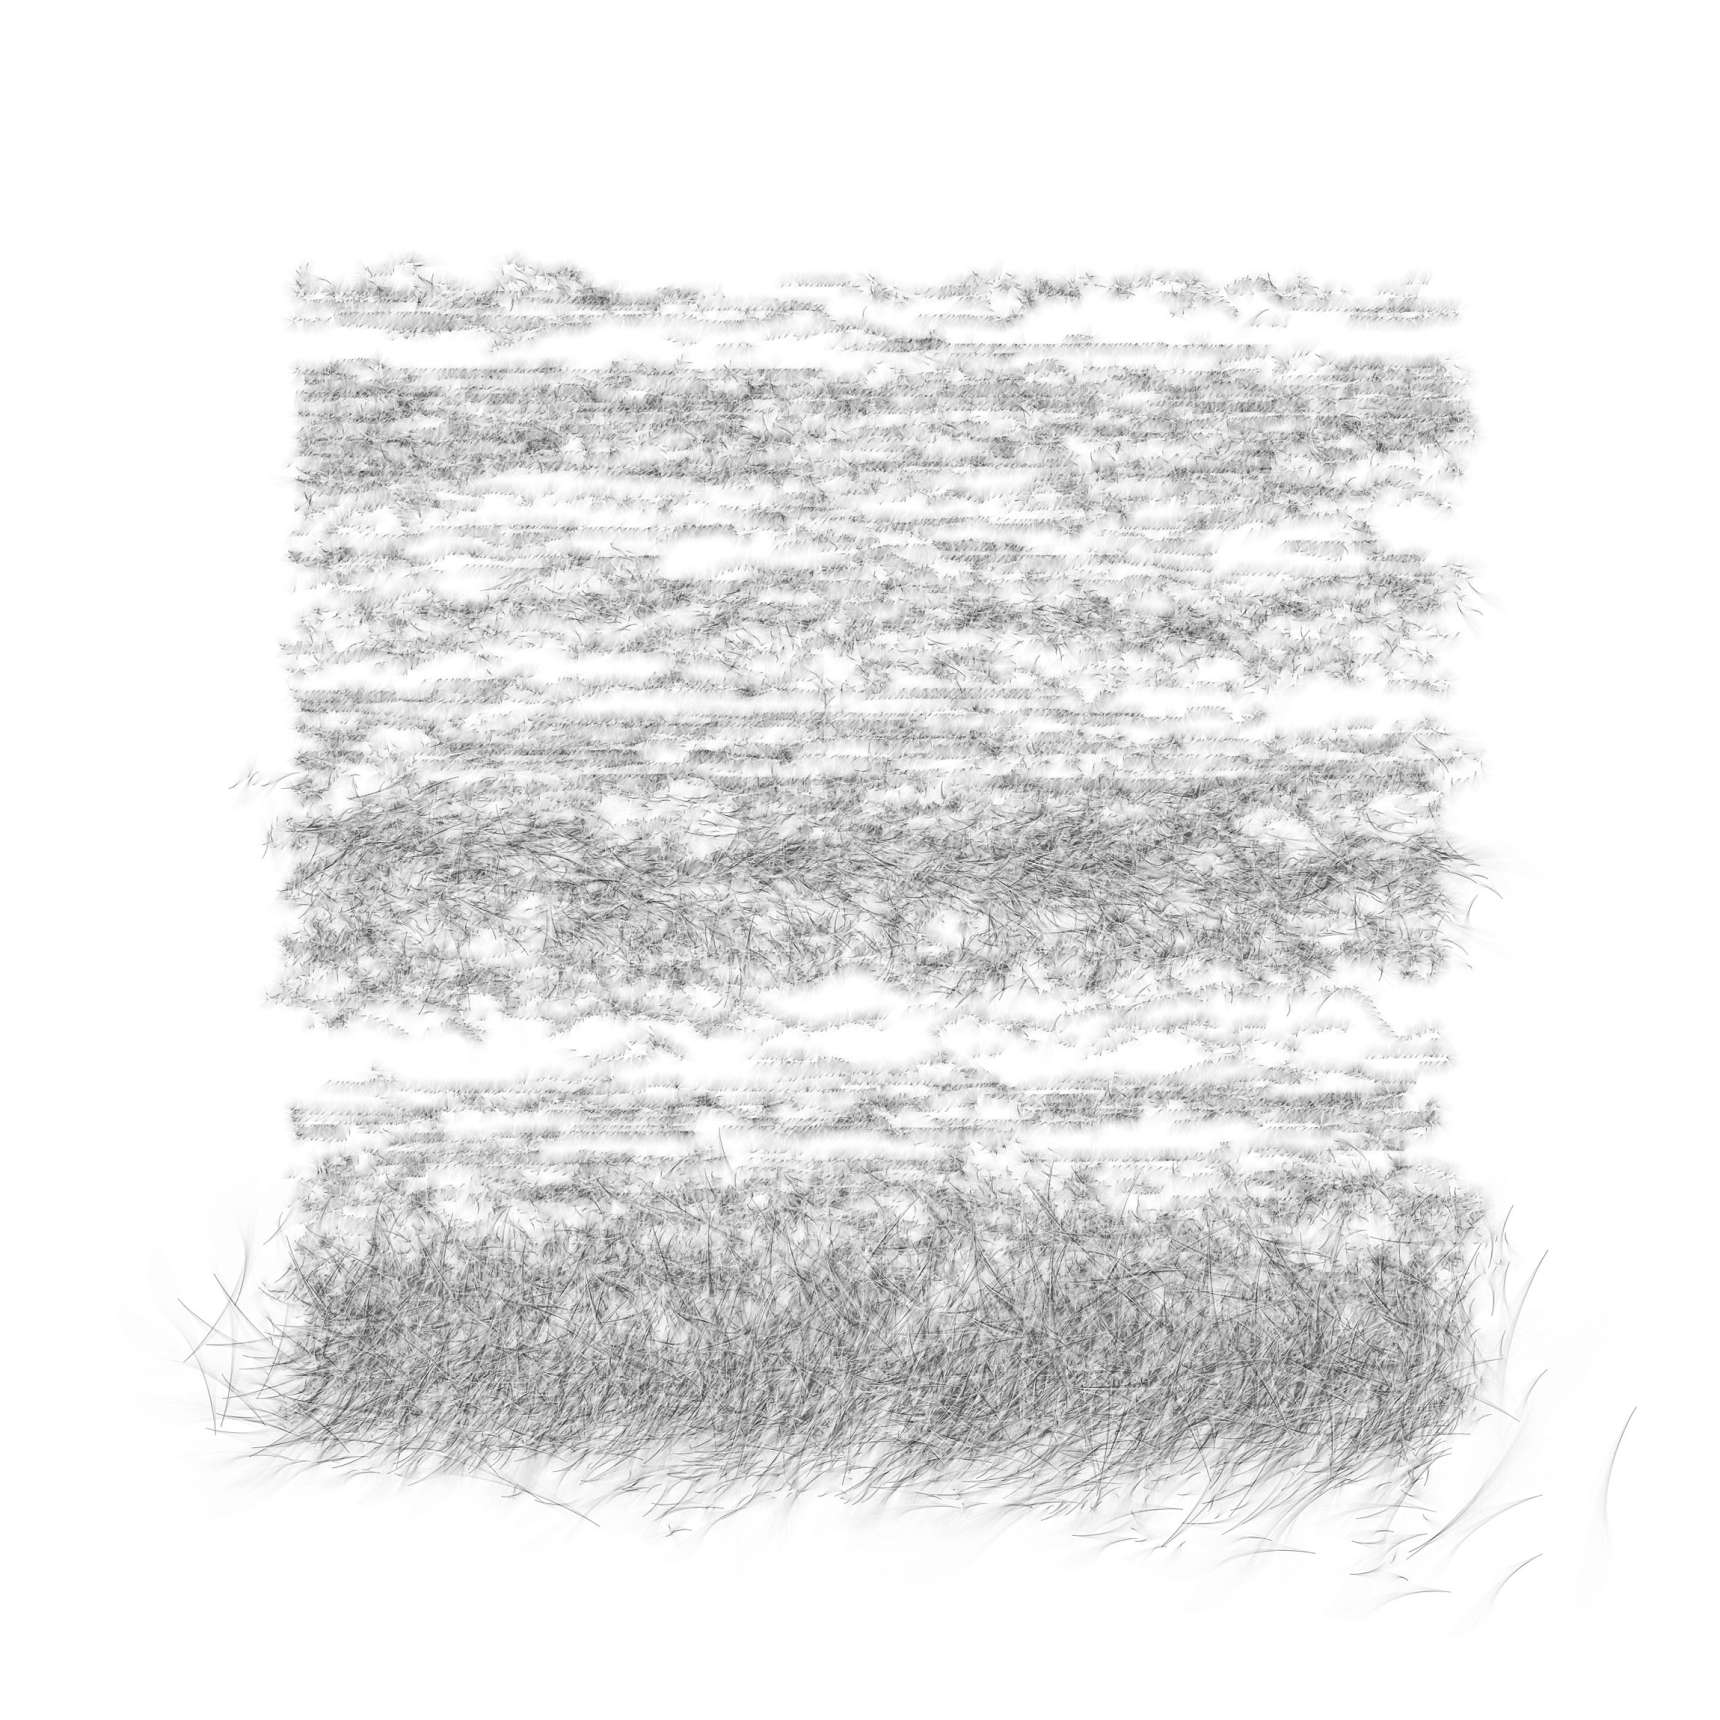
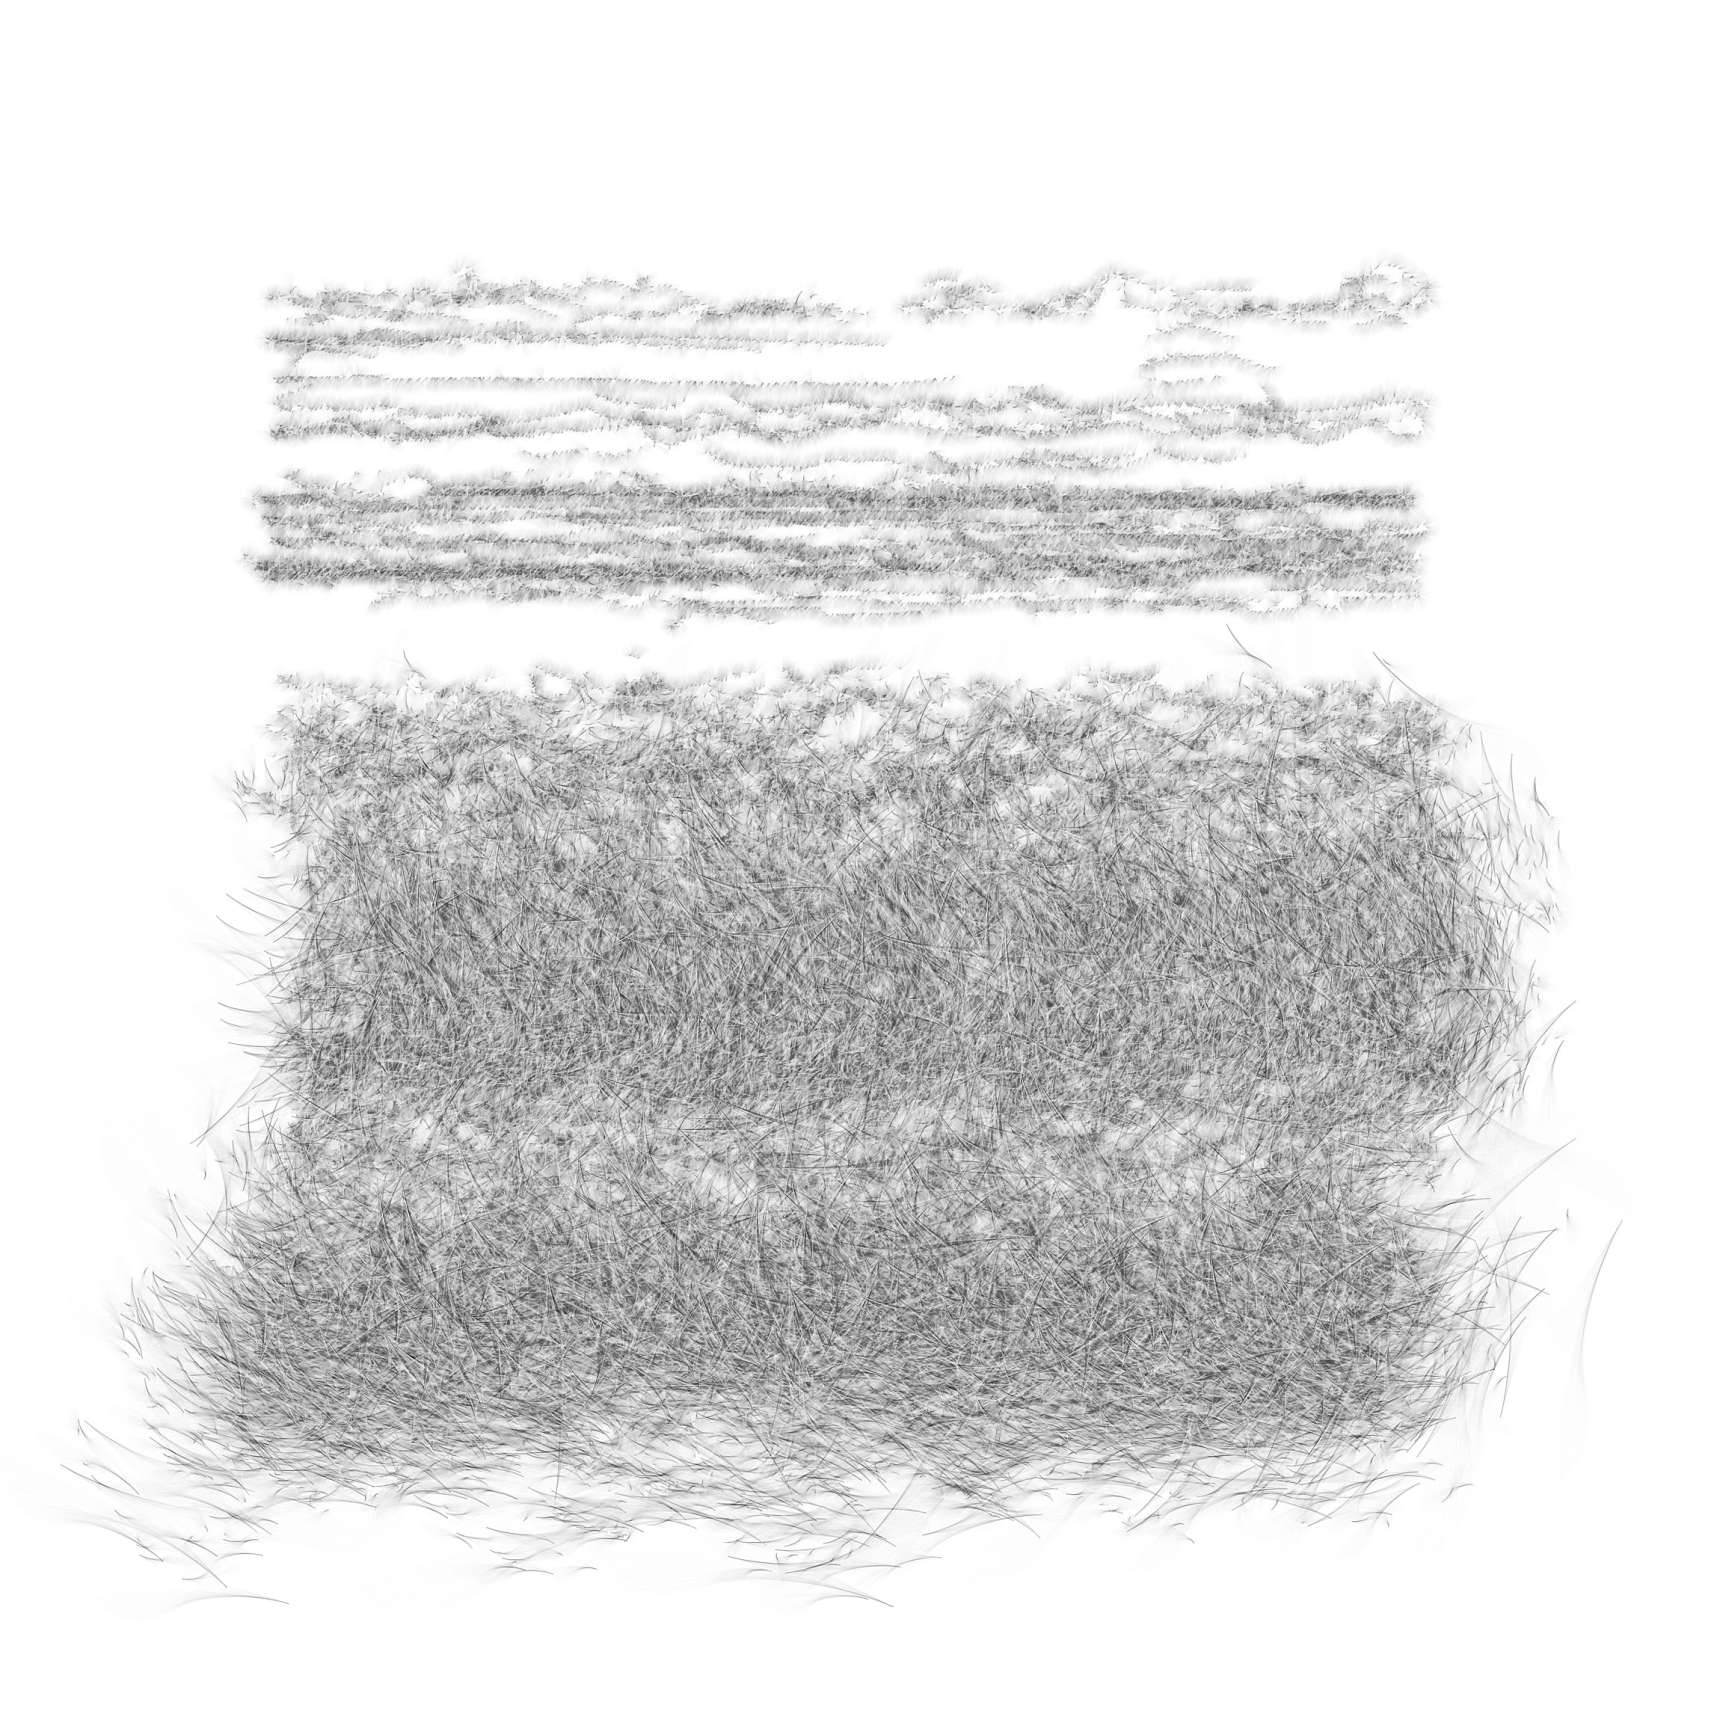
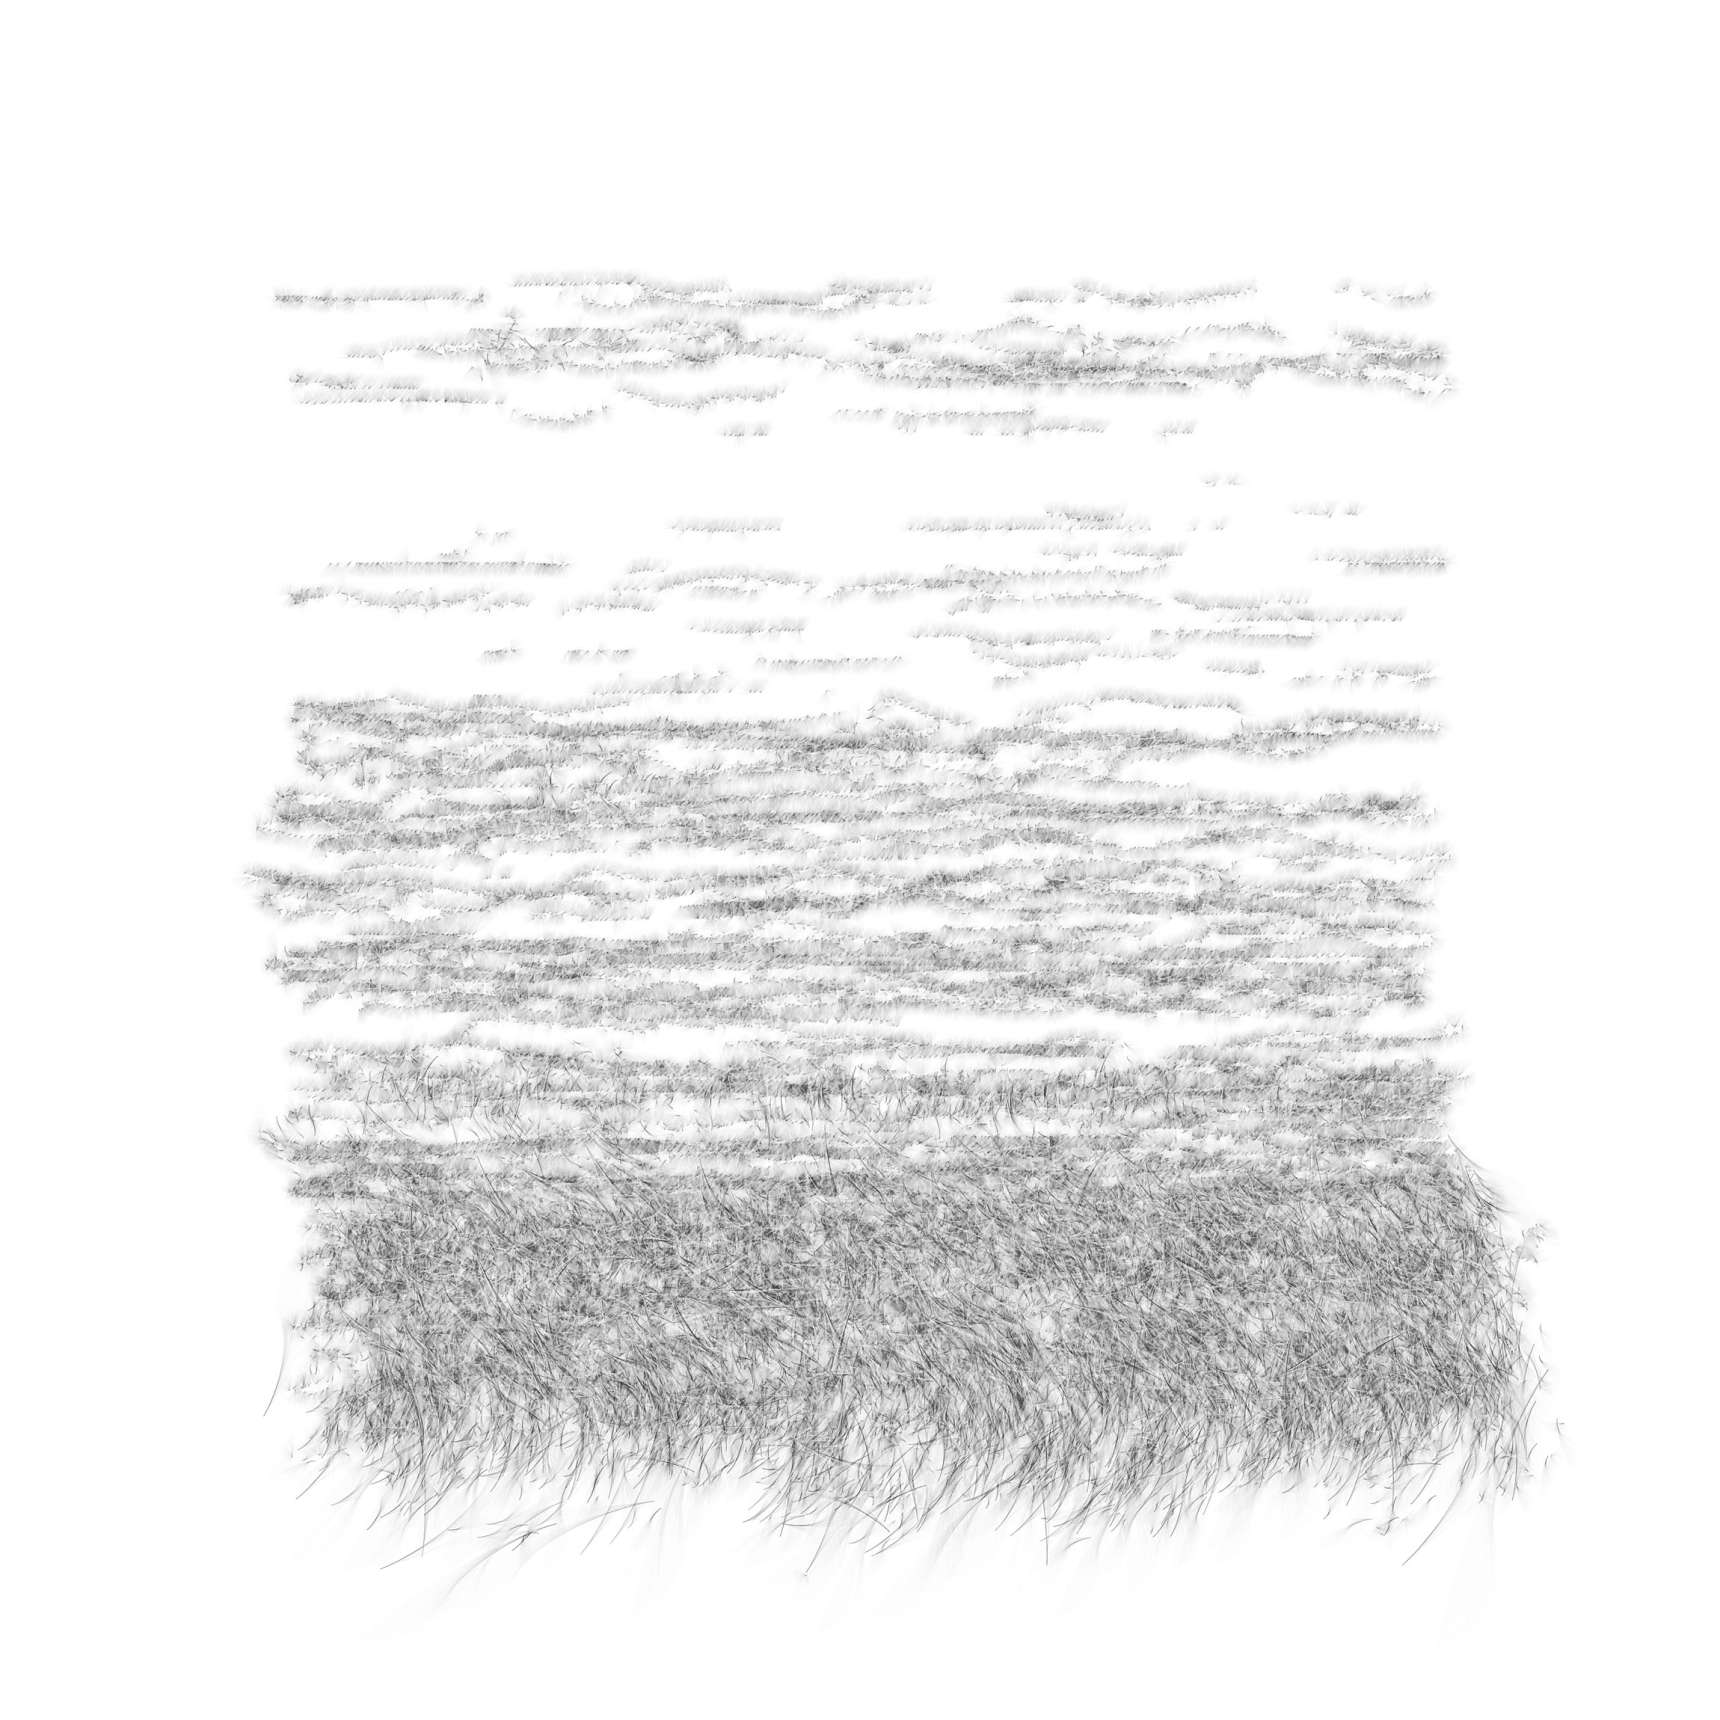
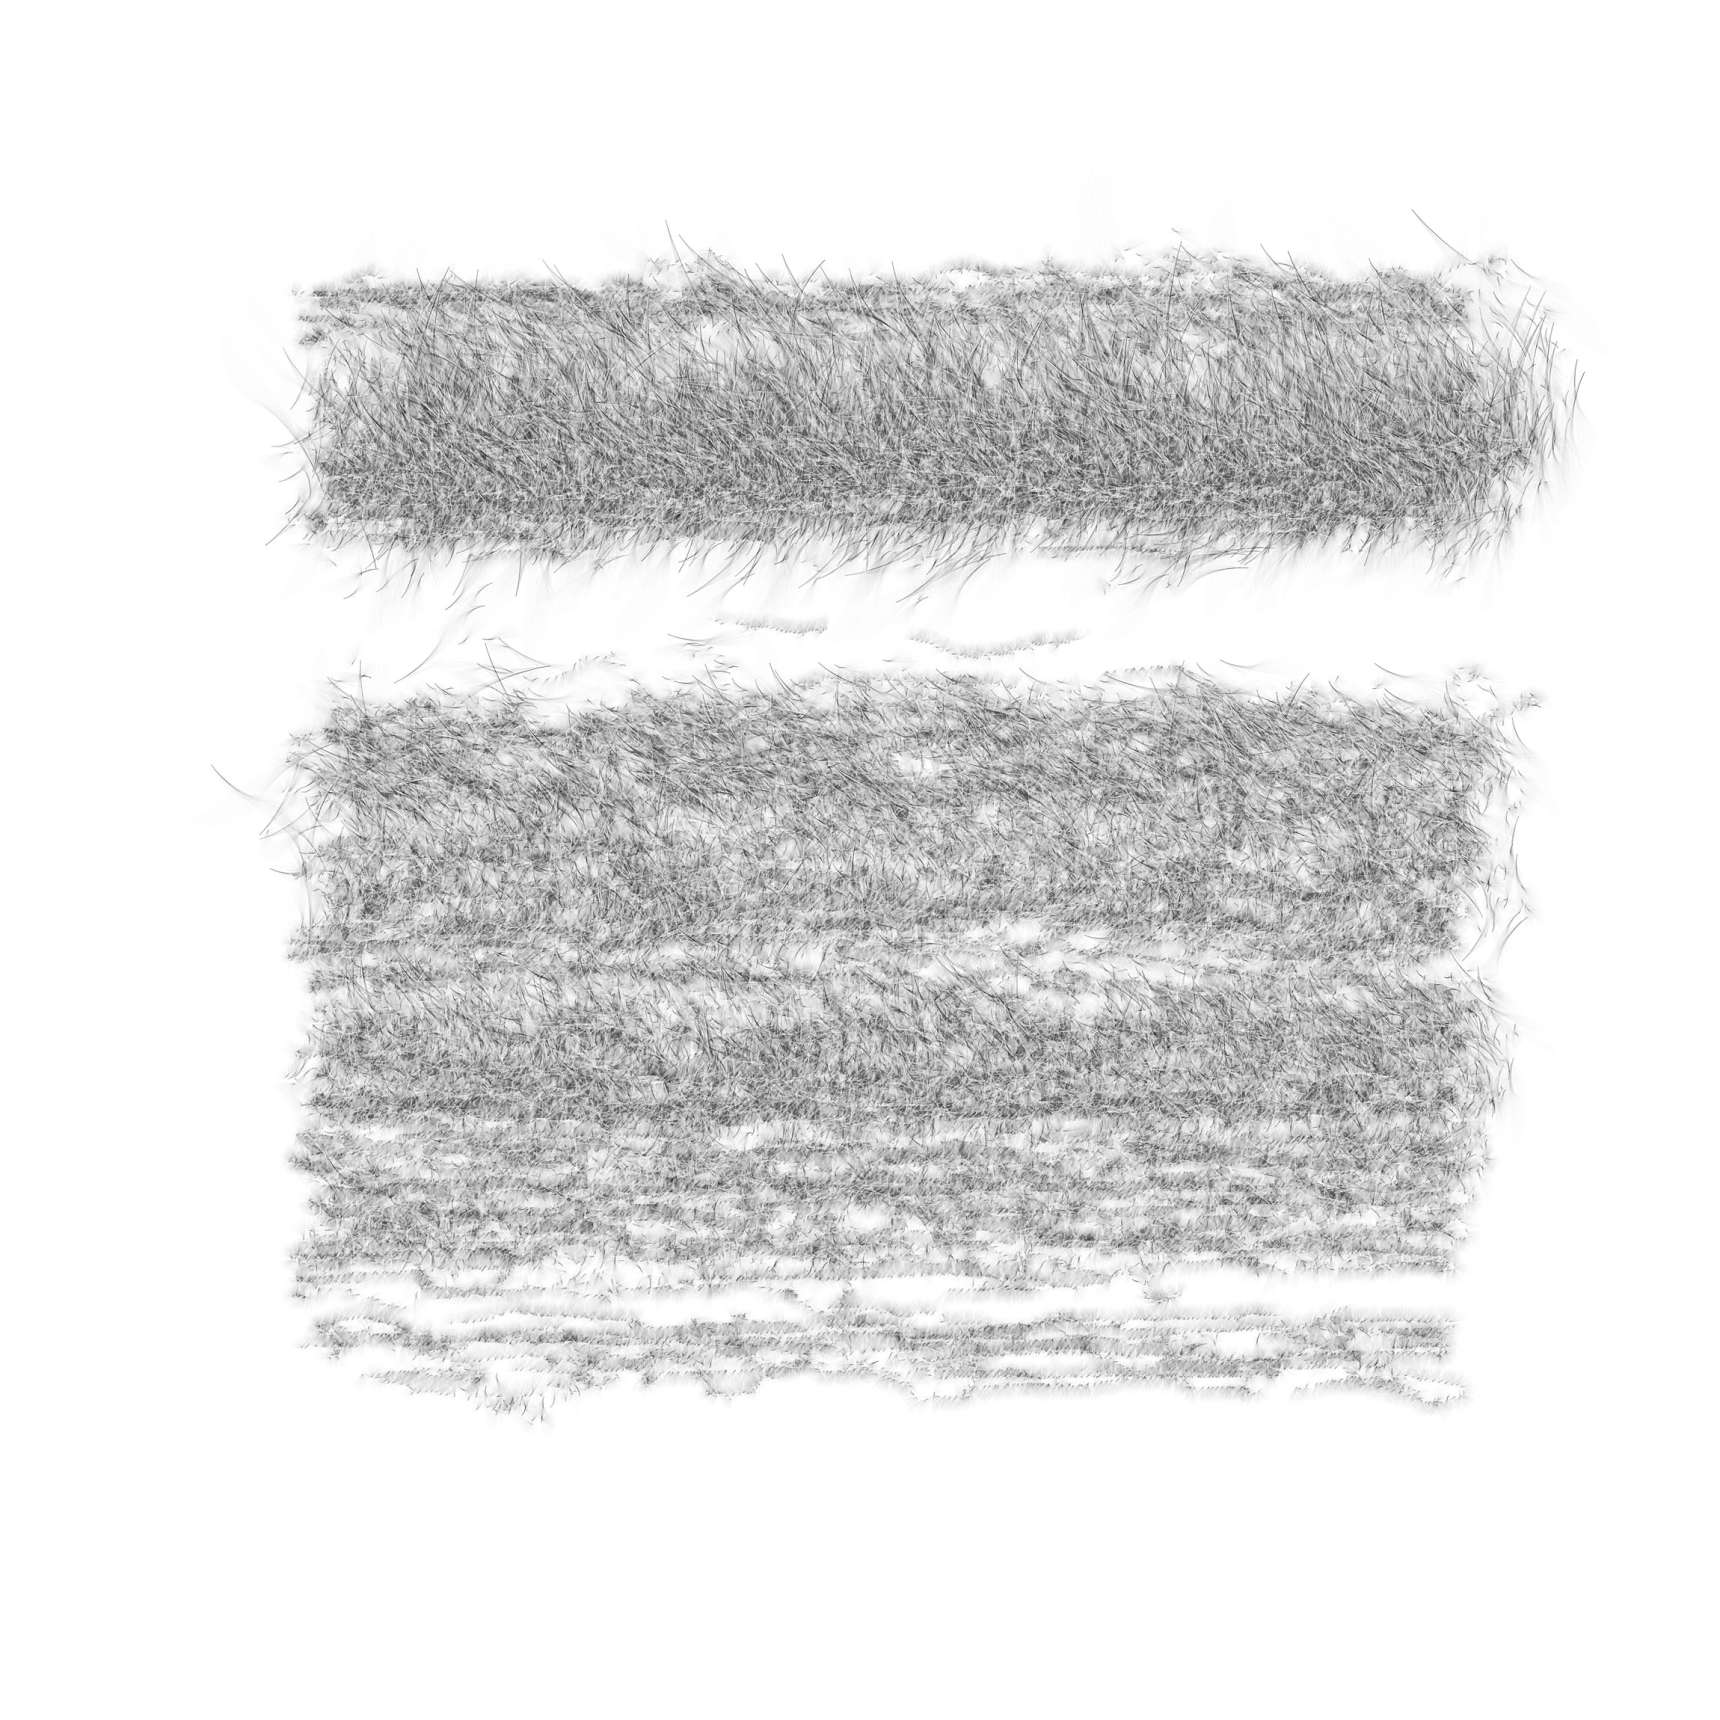
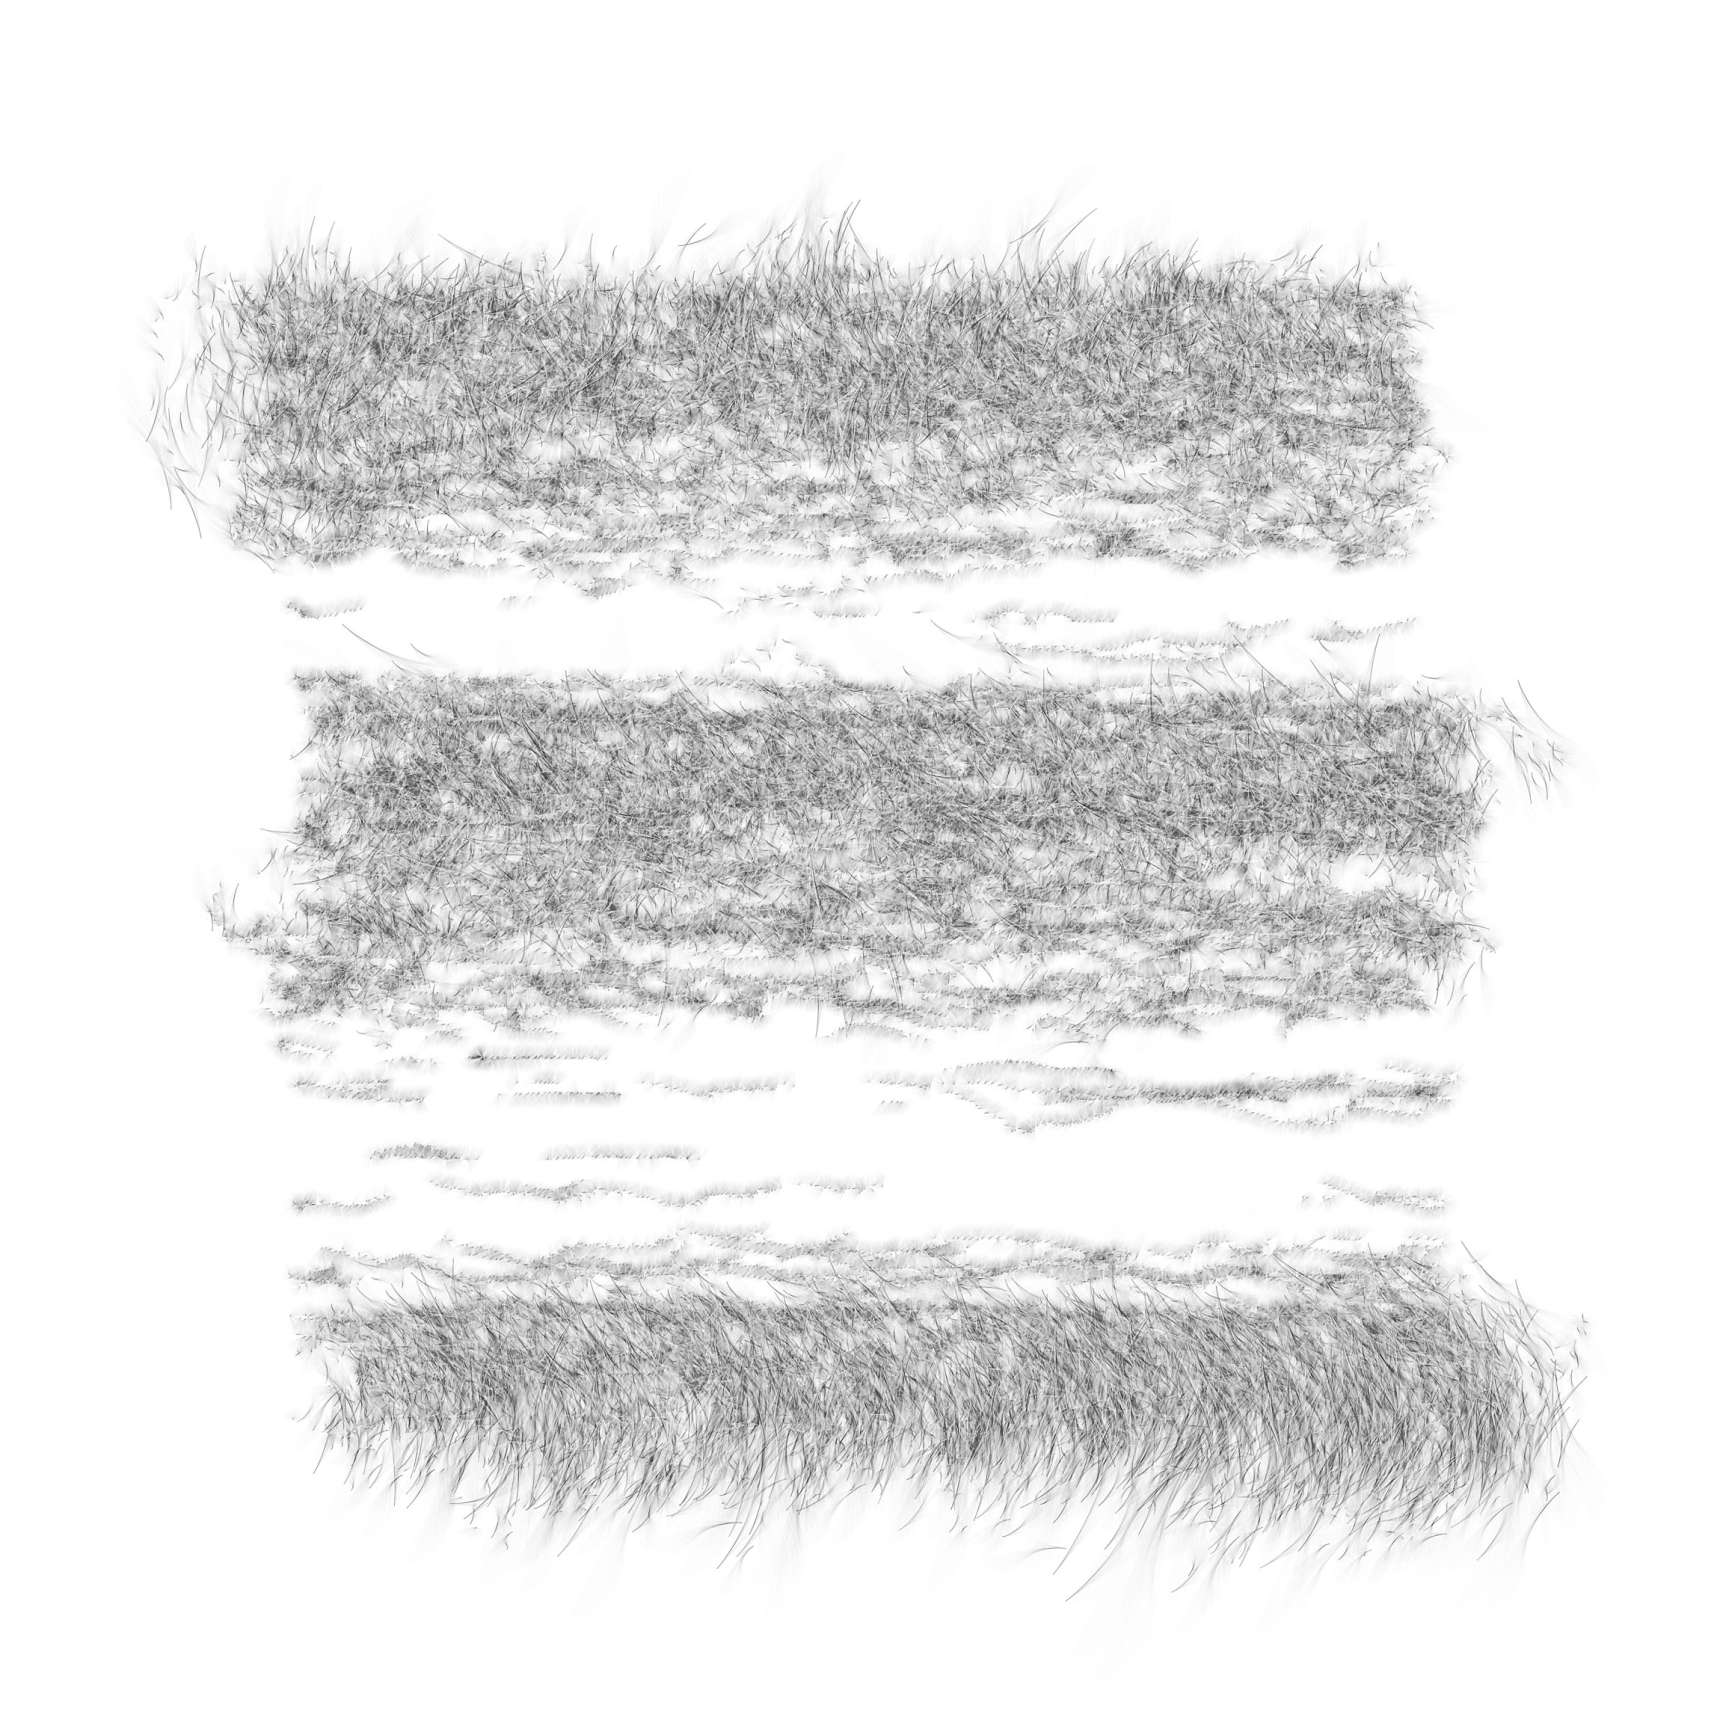
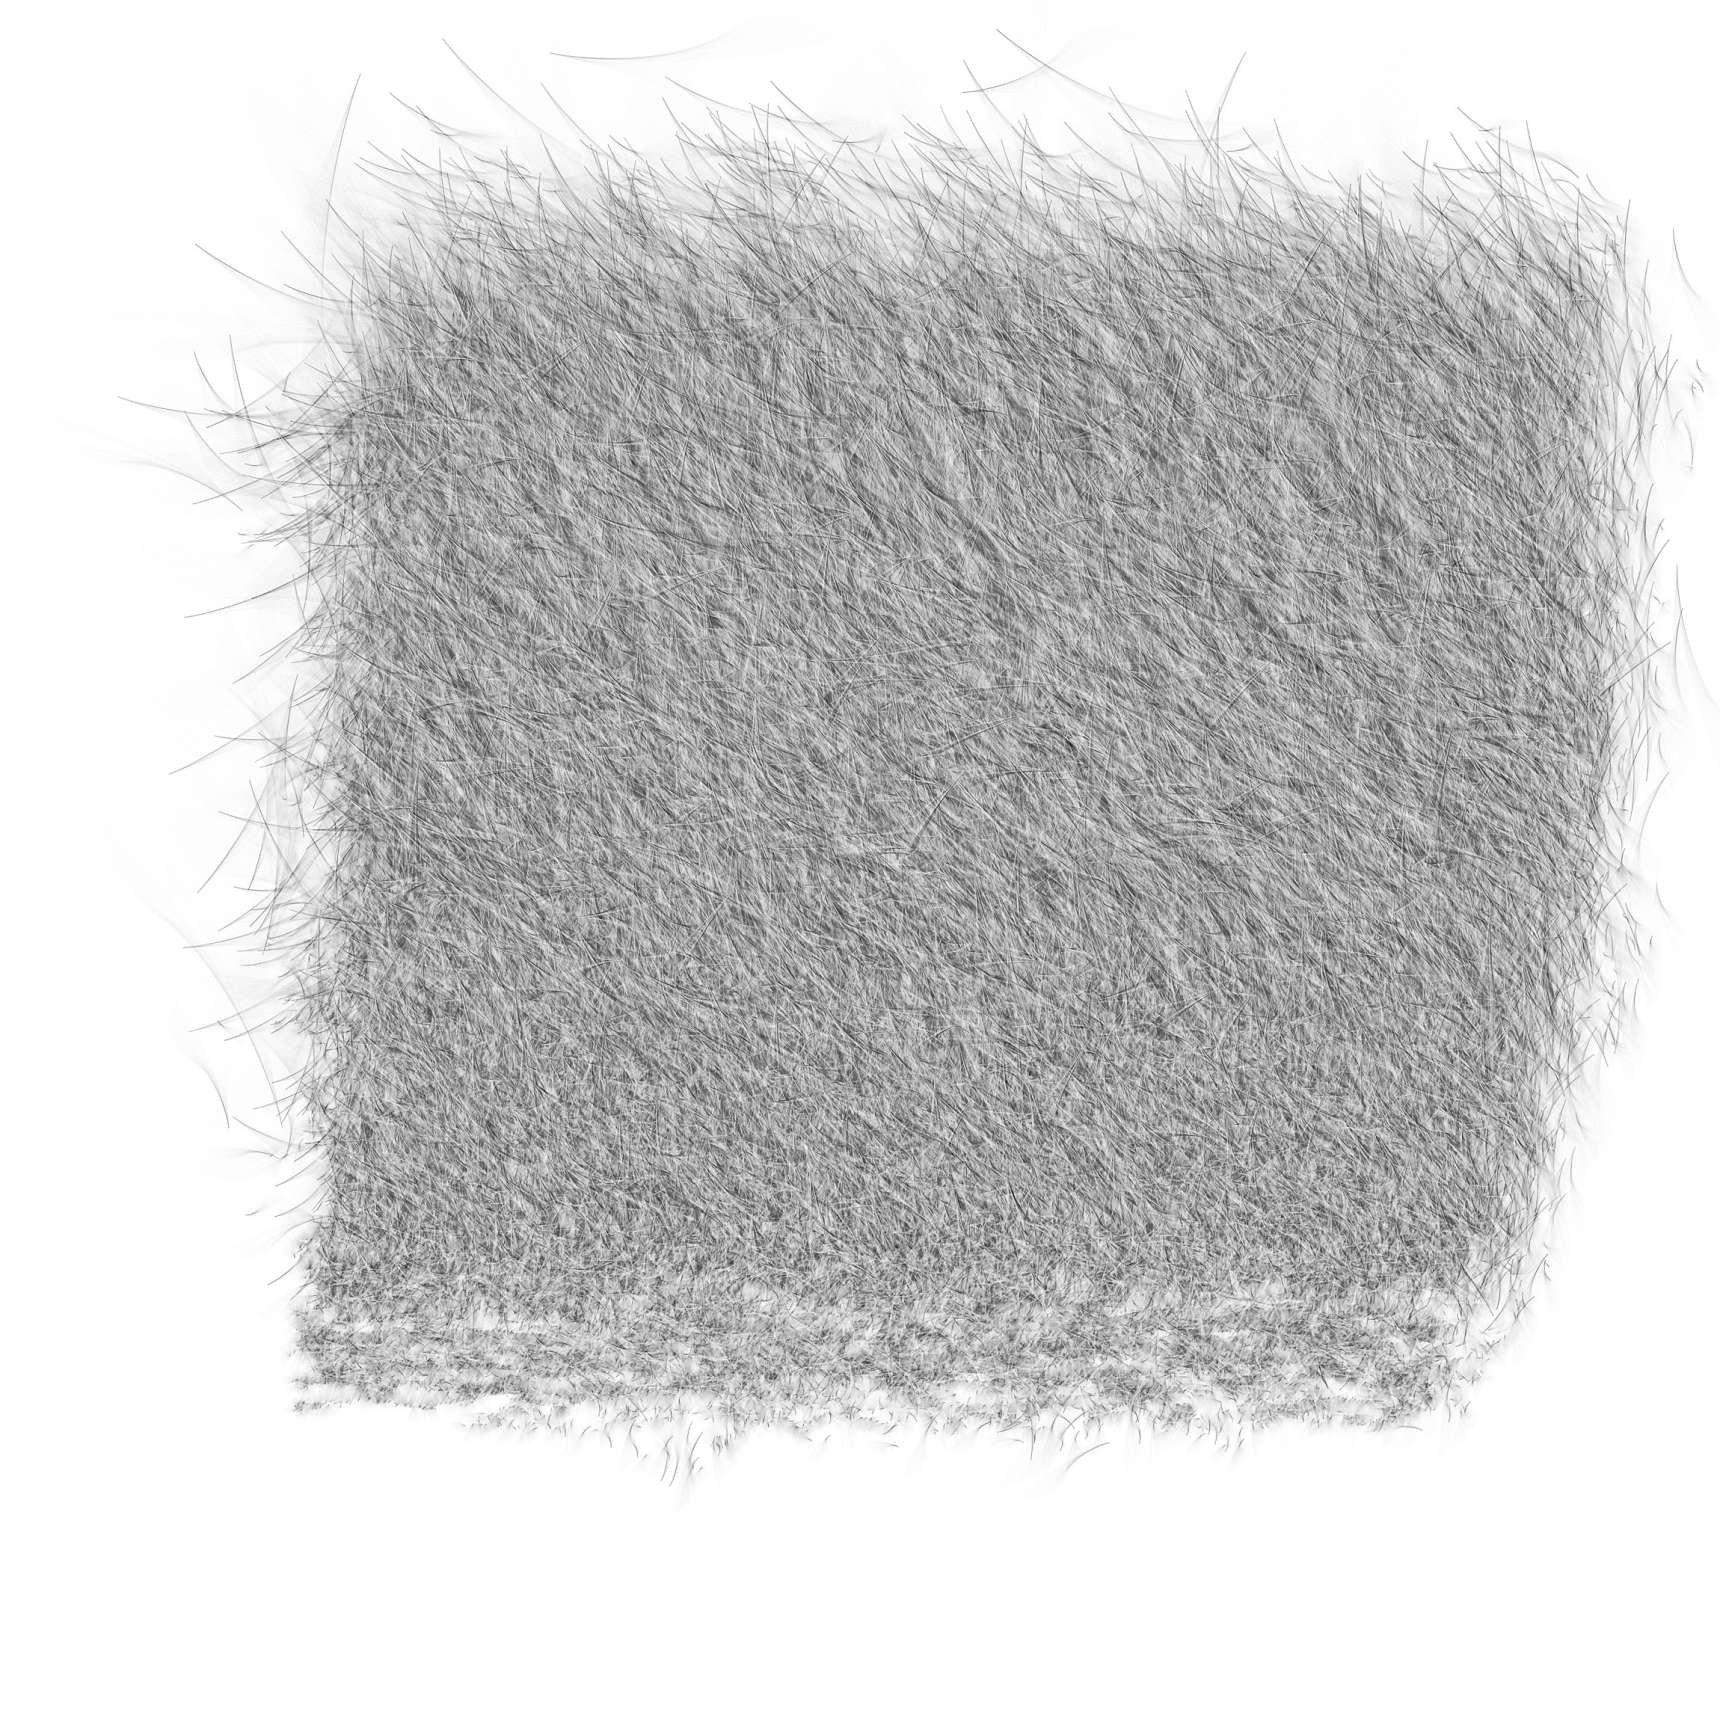
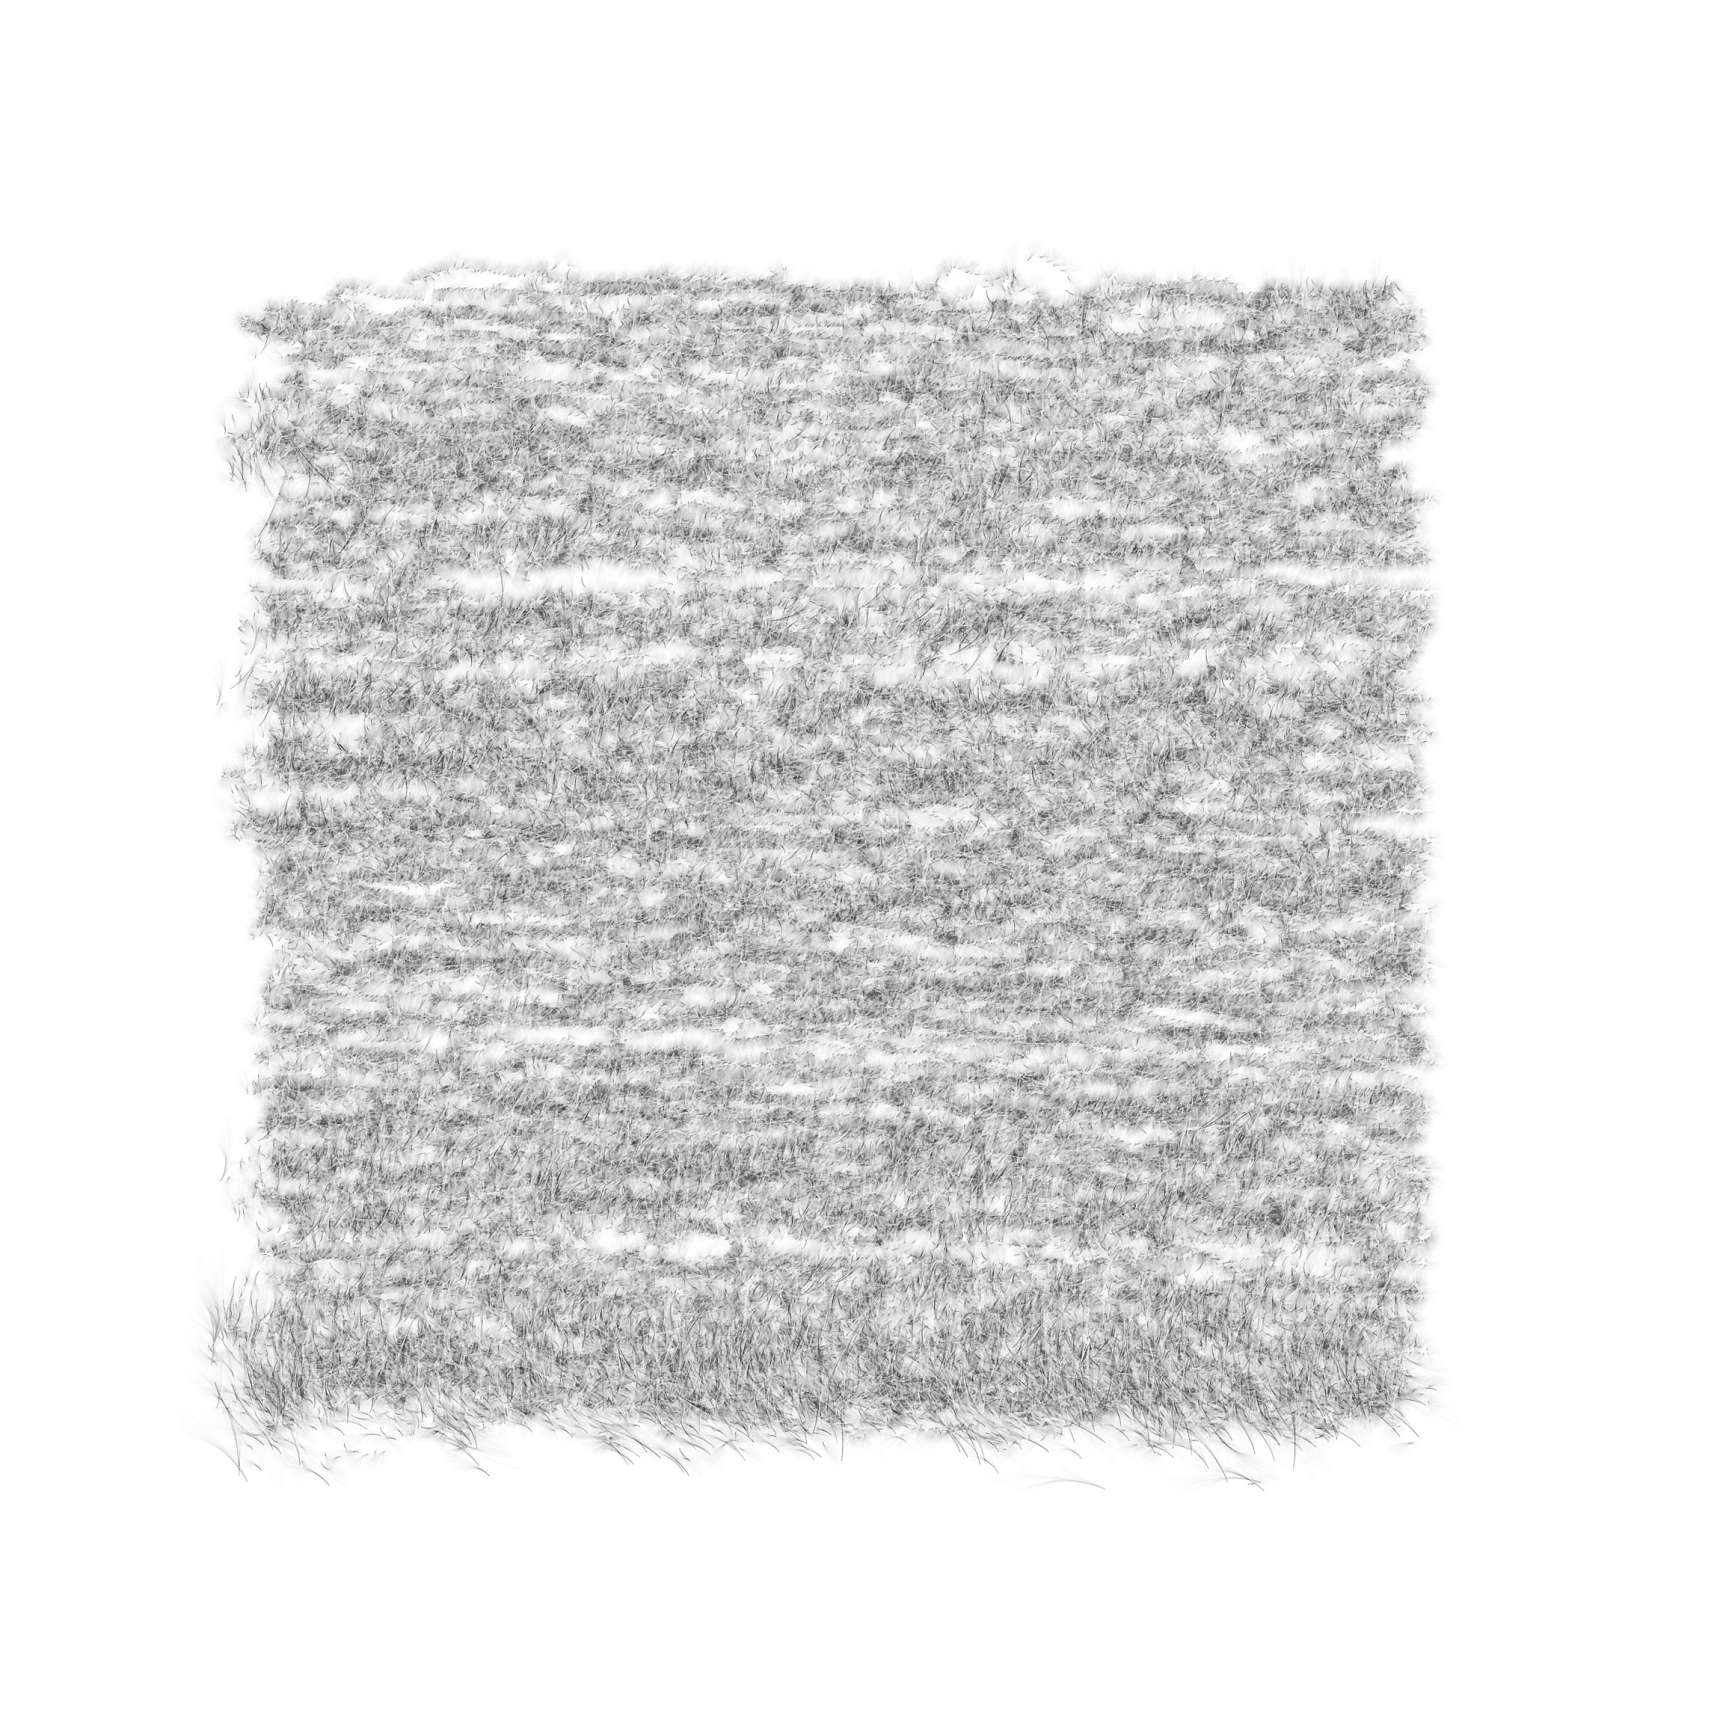
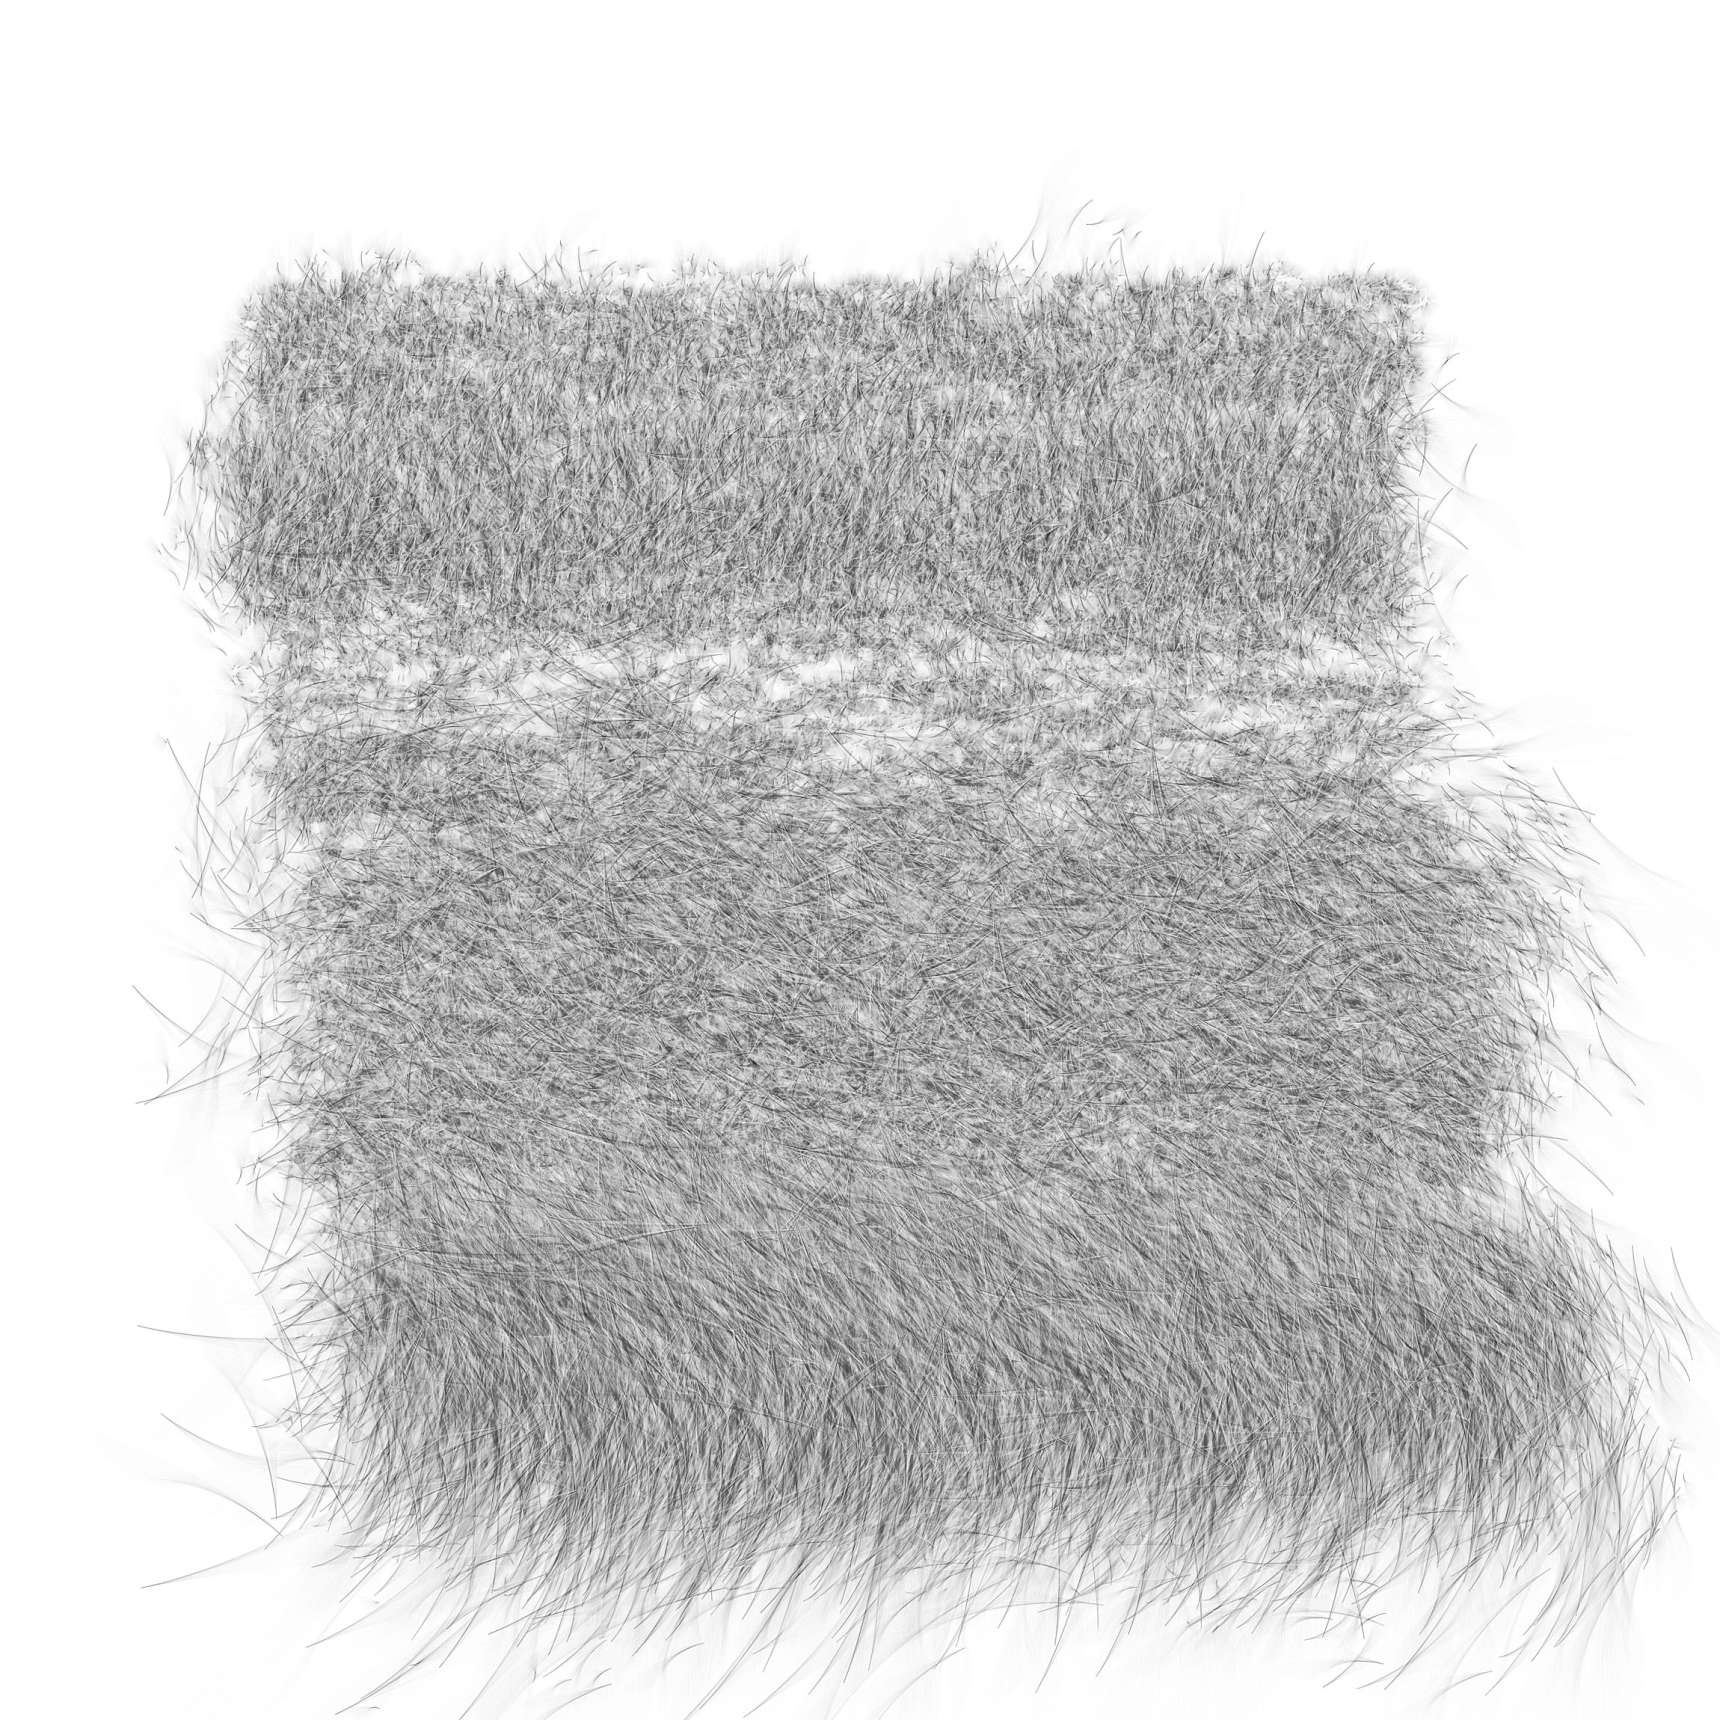
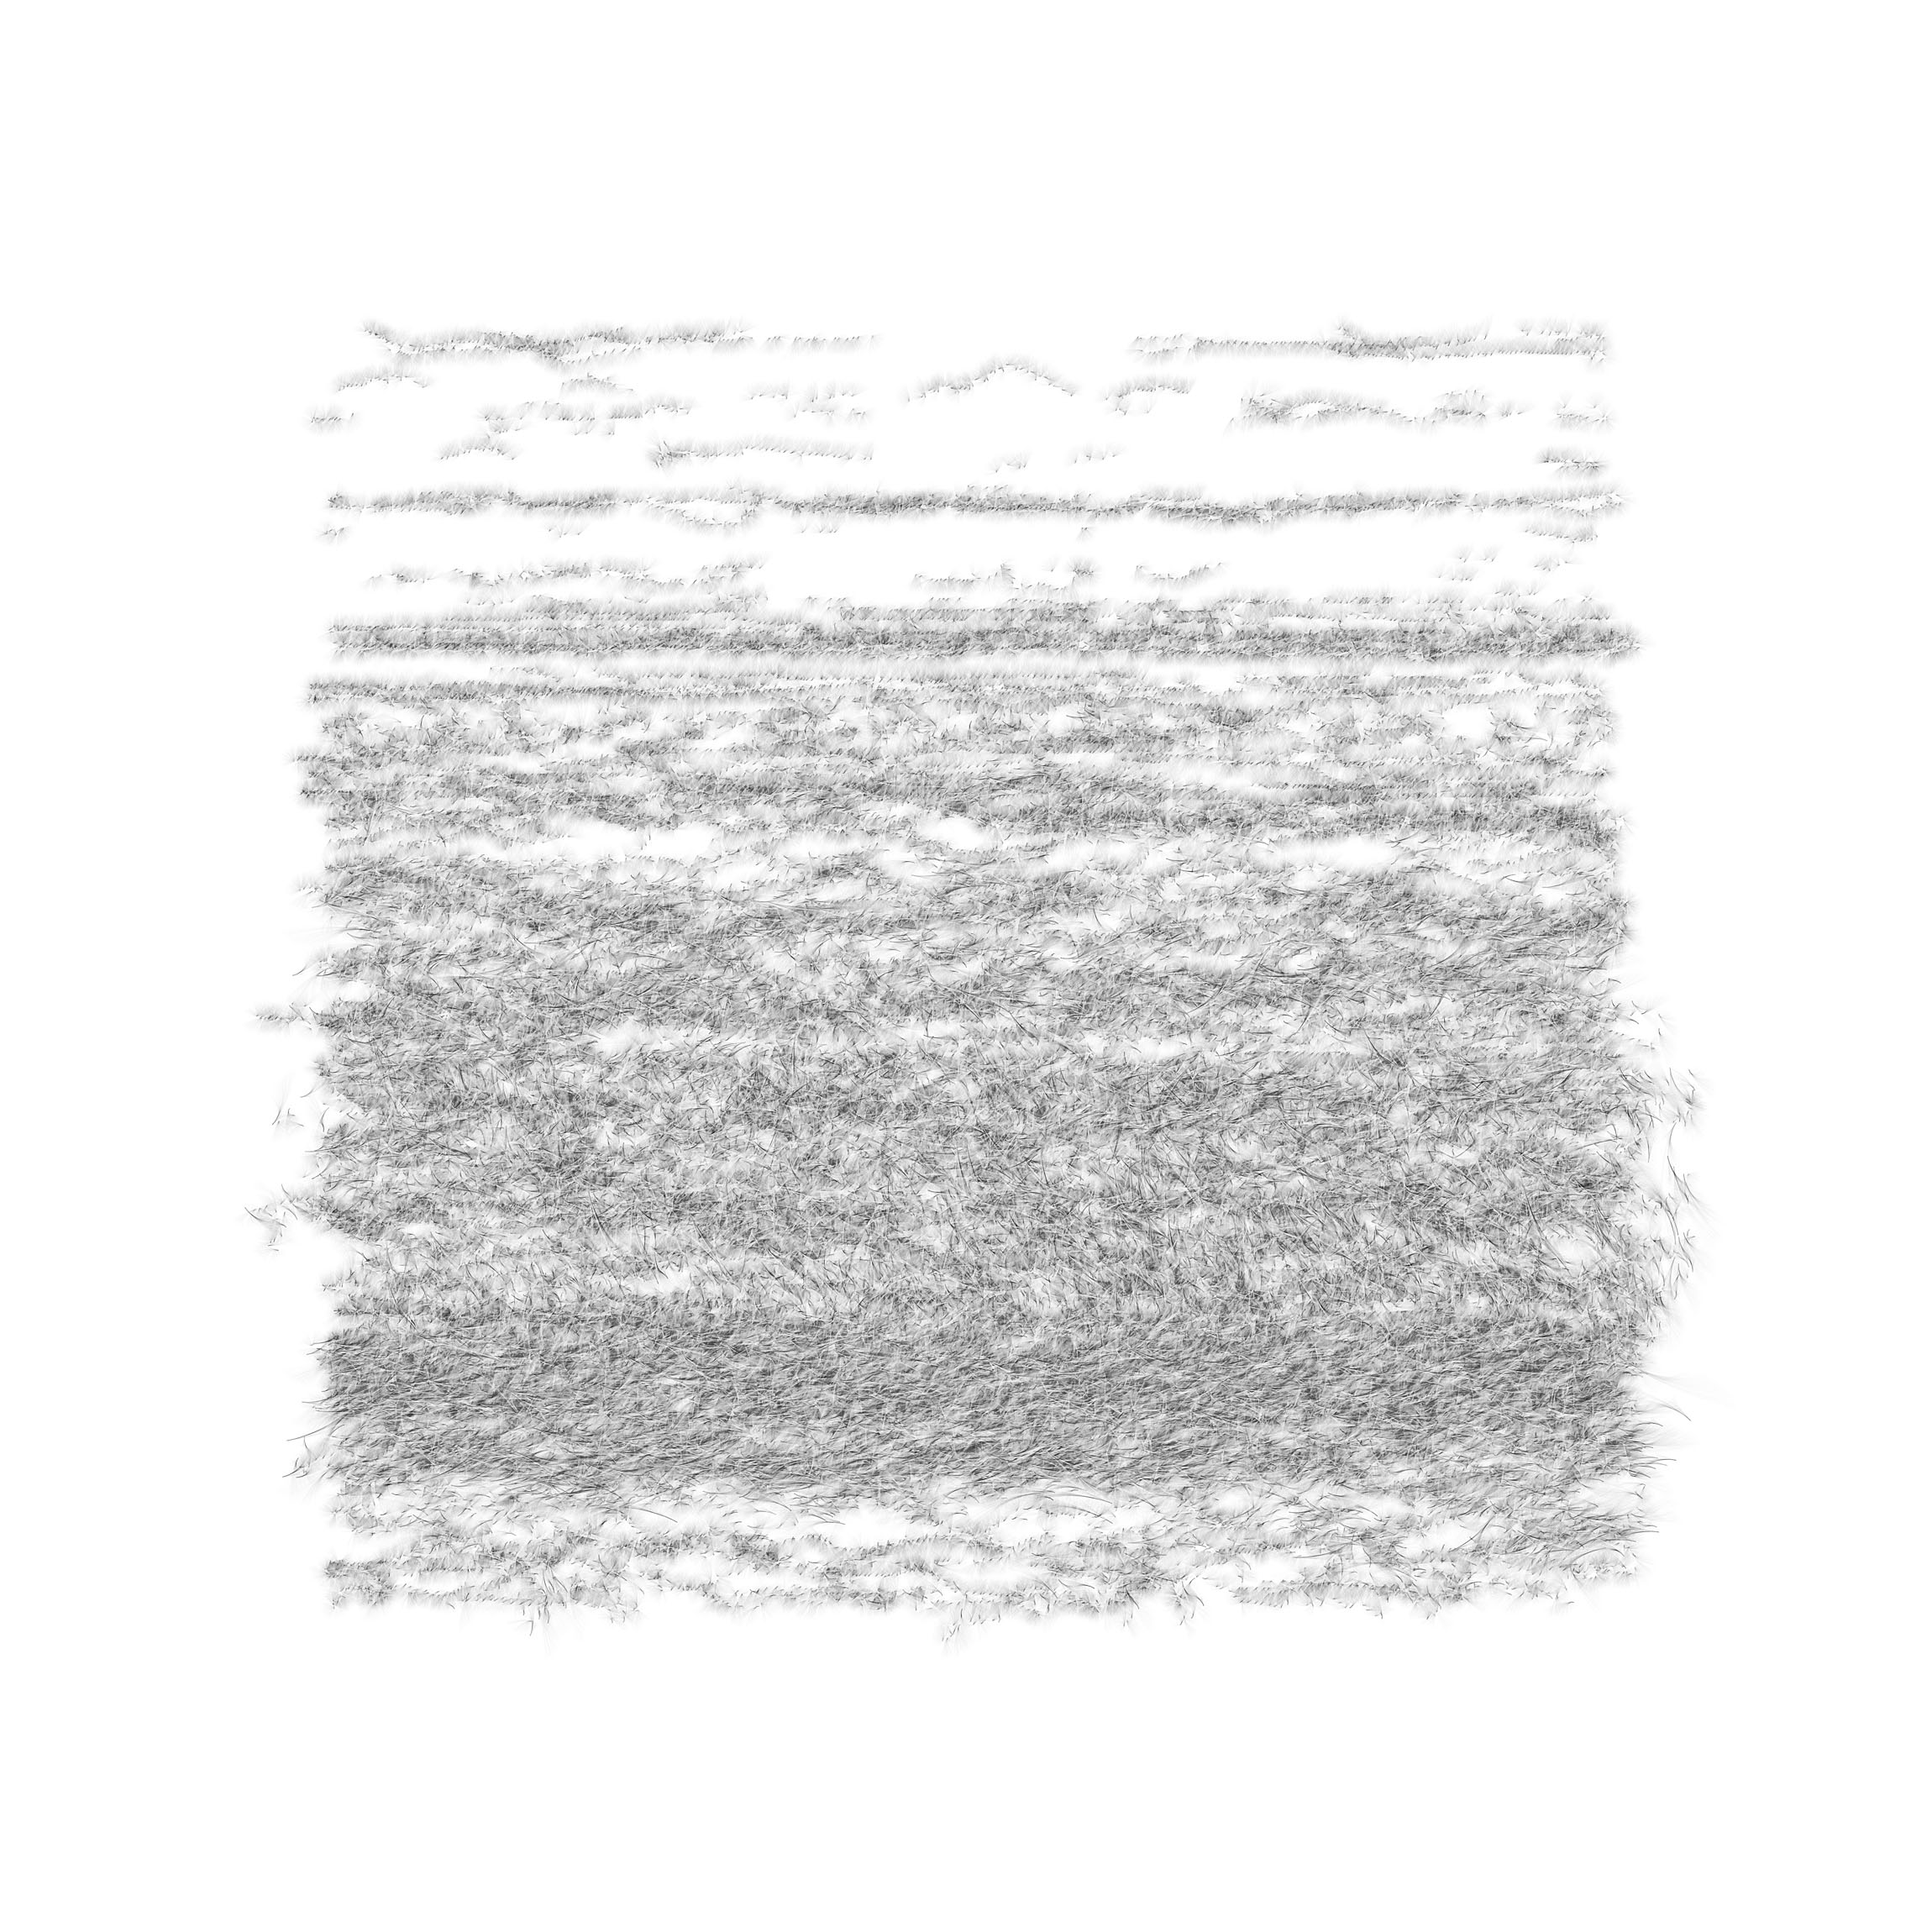
For this series of drawings, marks plotting each second of a day’s wind data are placed from top to bottom. Marks based on wind data collected at midnight start at the top left and move down as time progresses.
Some drawings have gaps showing when winds were light and areas of higher density when winds were strong. Shifts in wind direction can clearly be seen on a drawing’s outside edge. The edge of the drawing at the top of this page shows a significant shift in wind speed and direction at the end of the day.