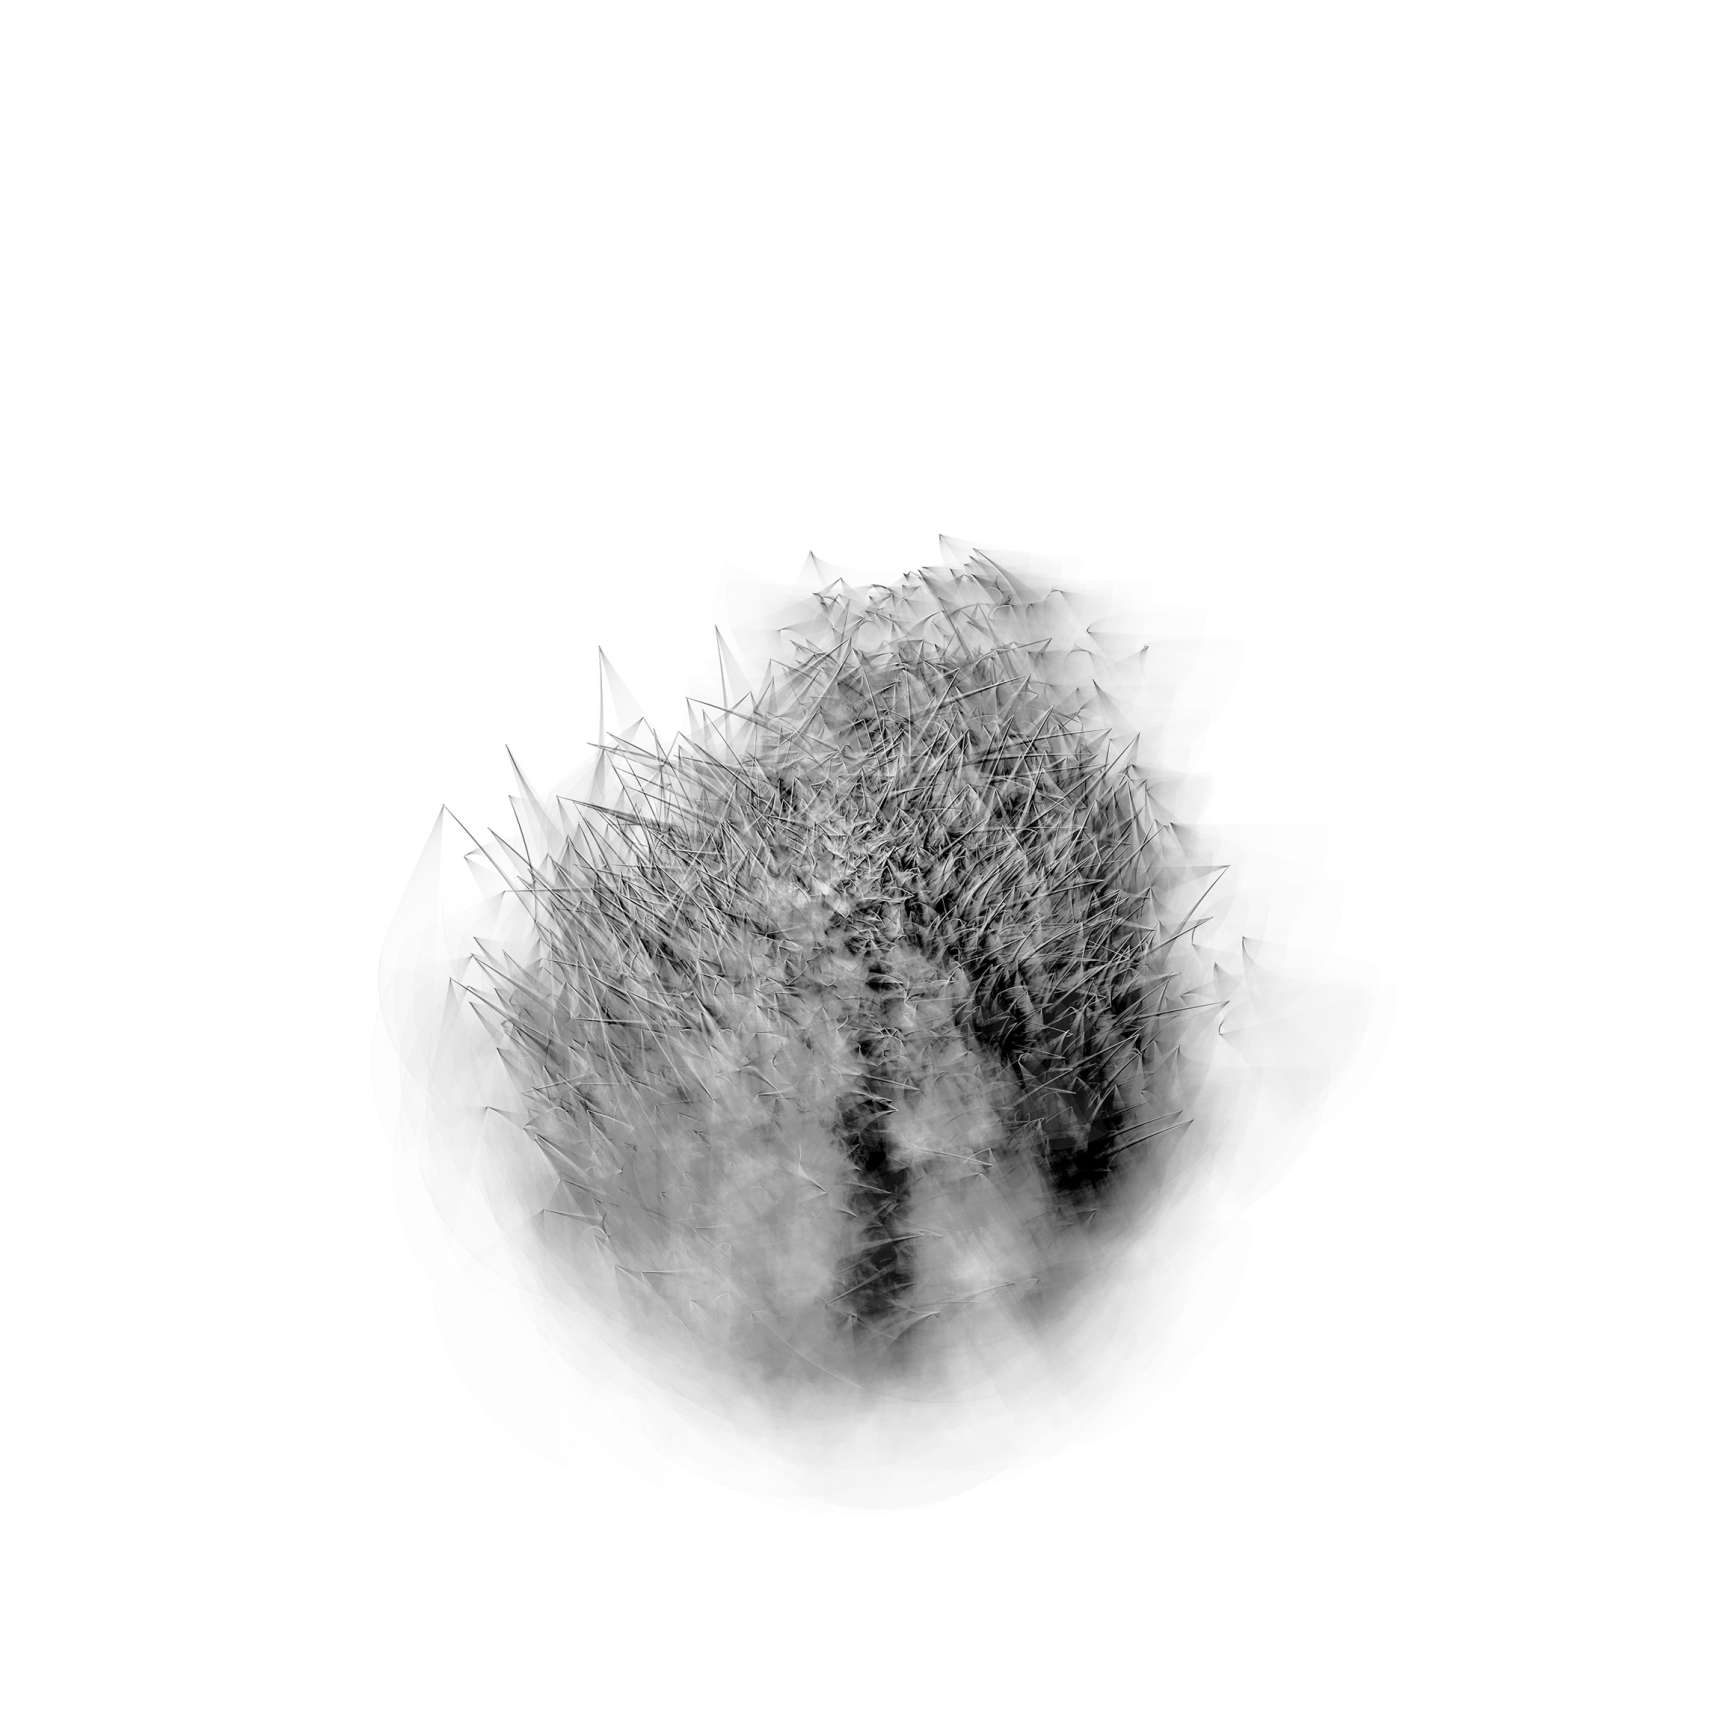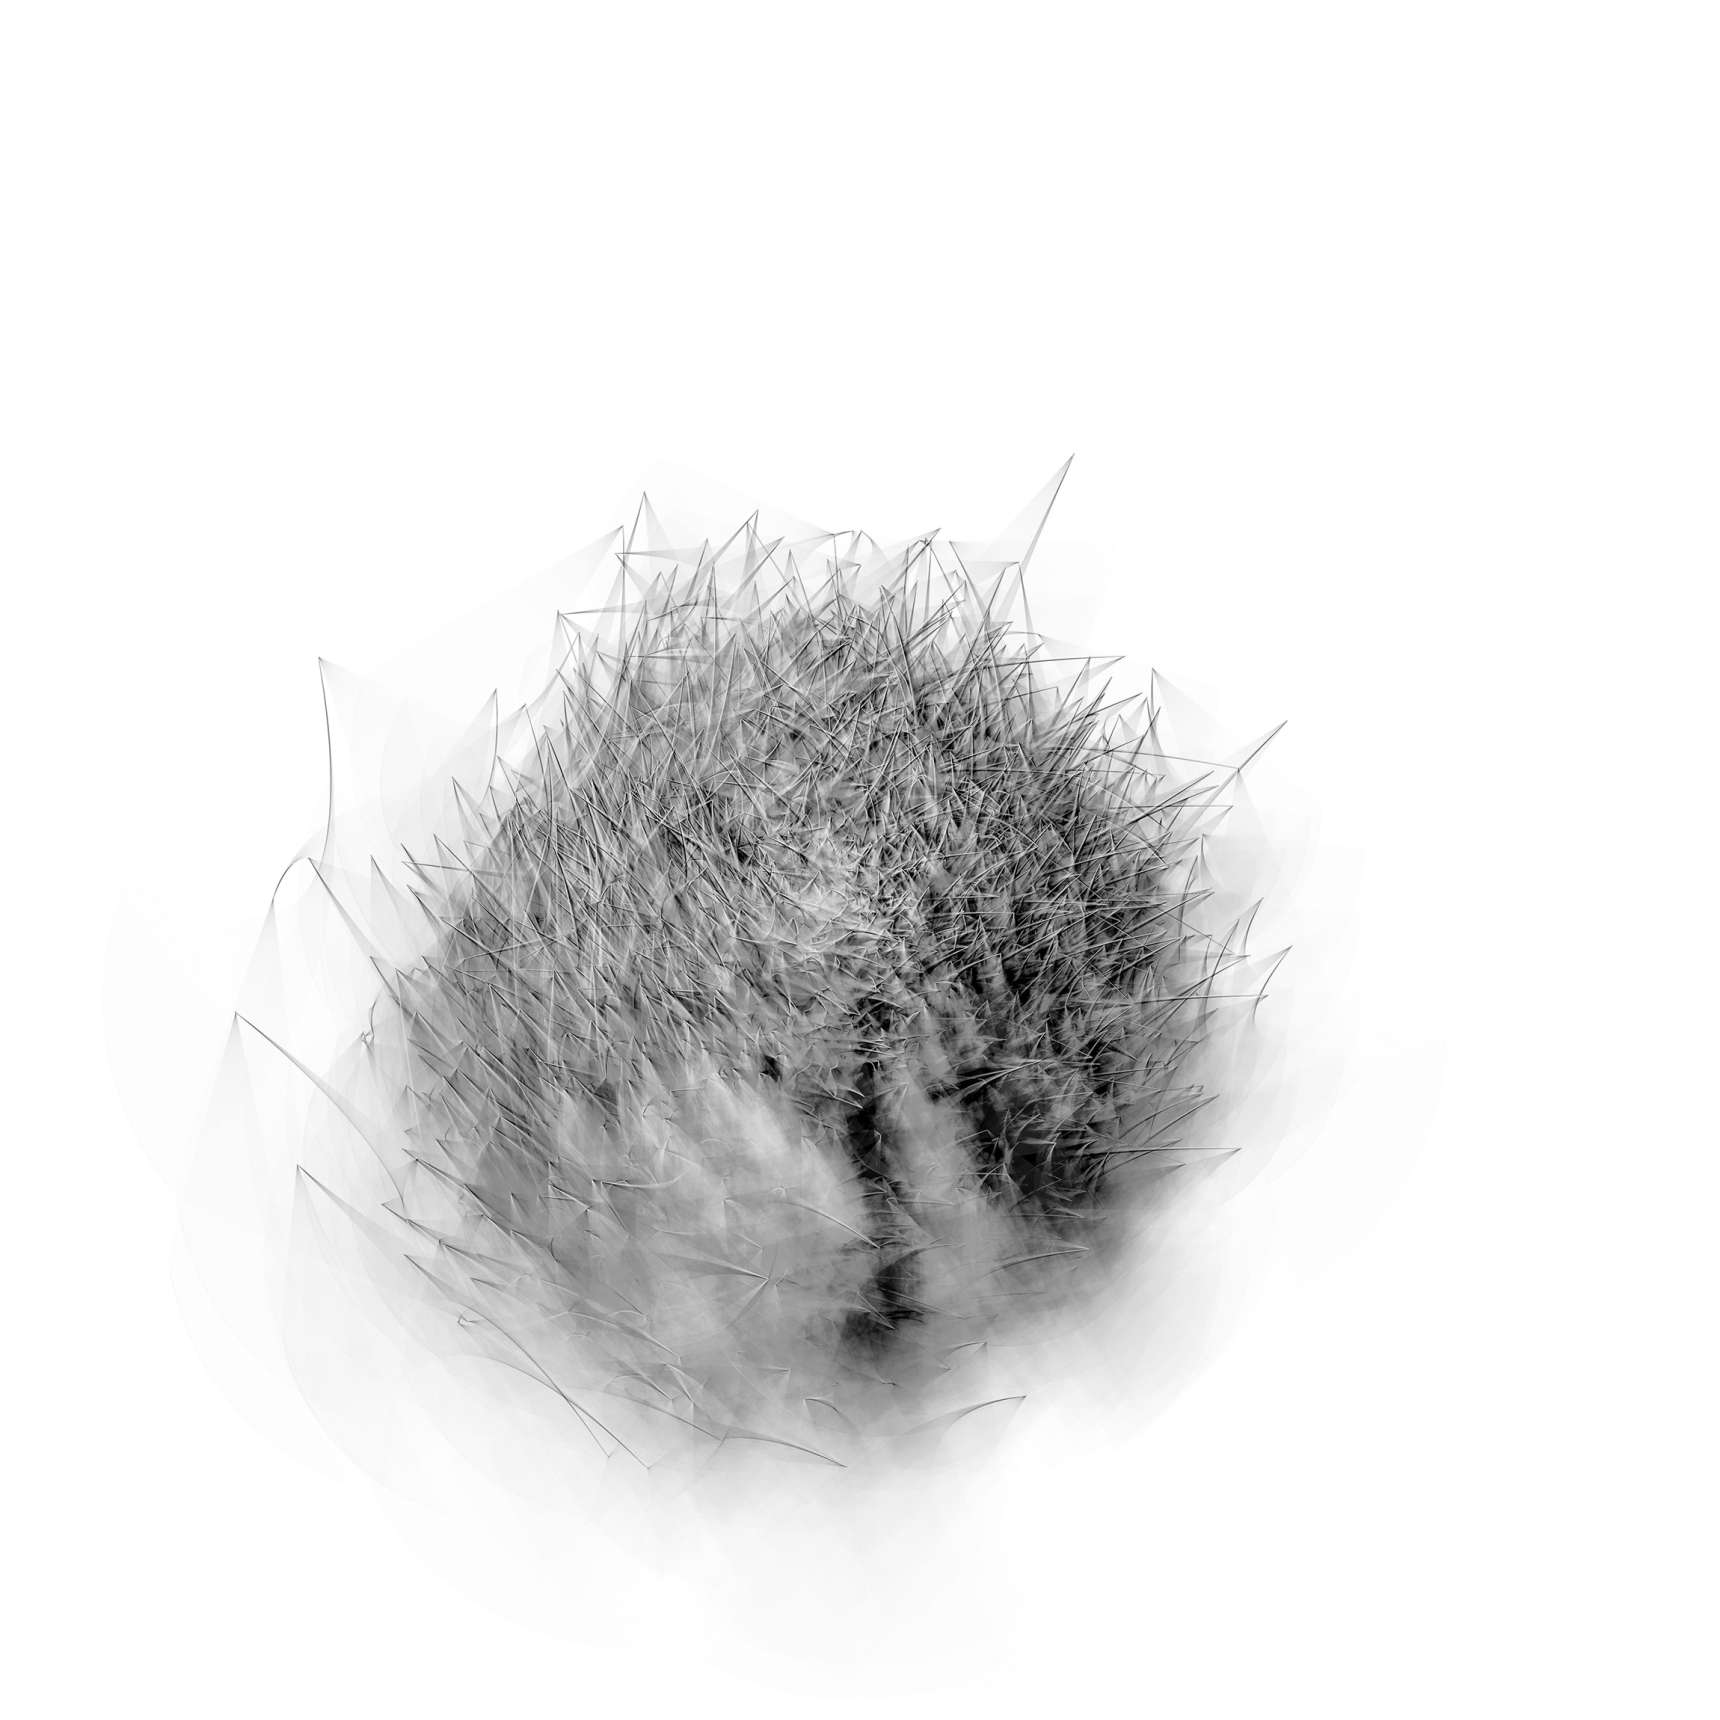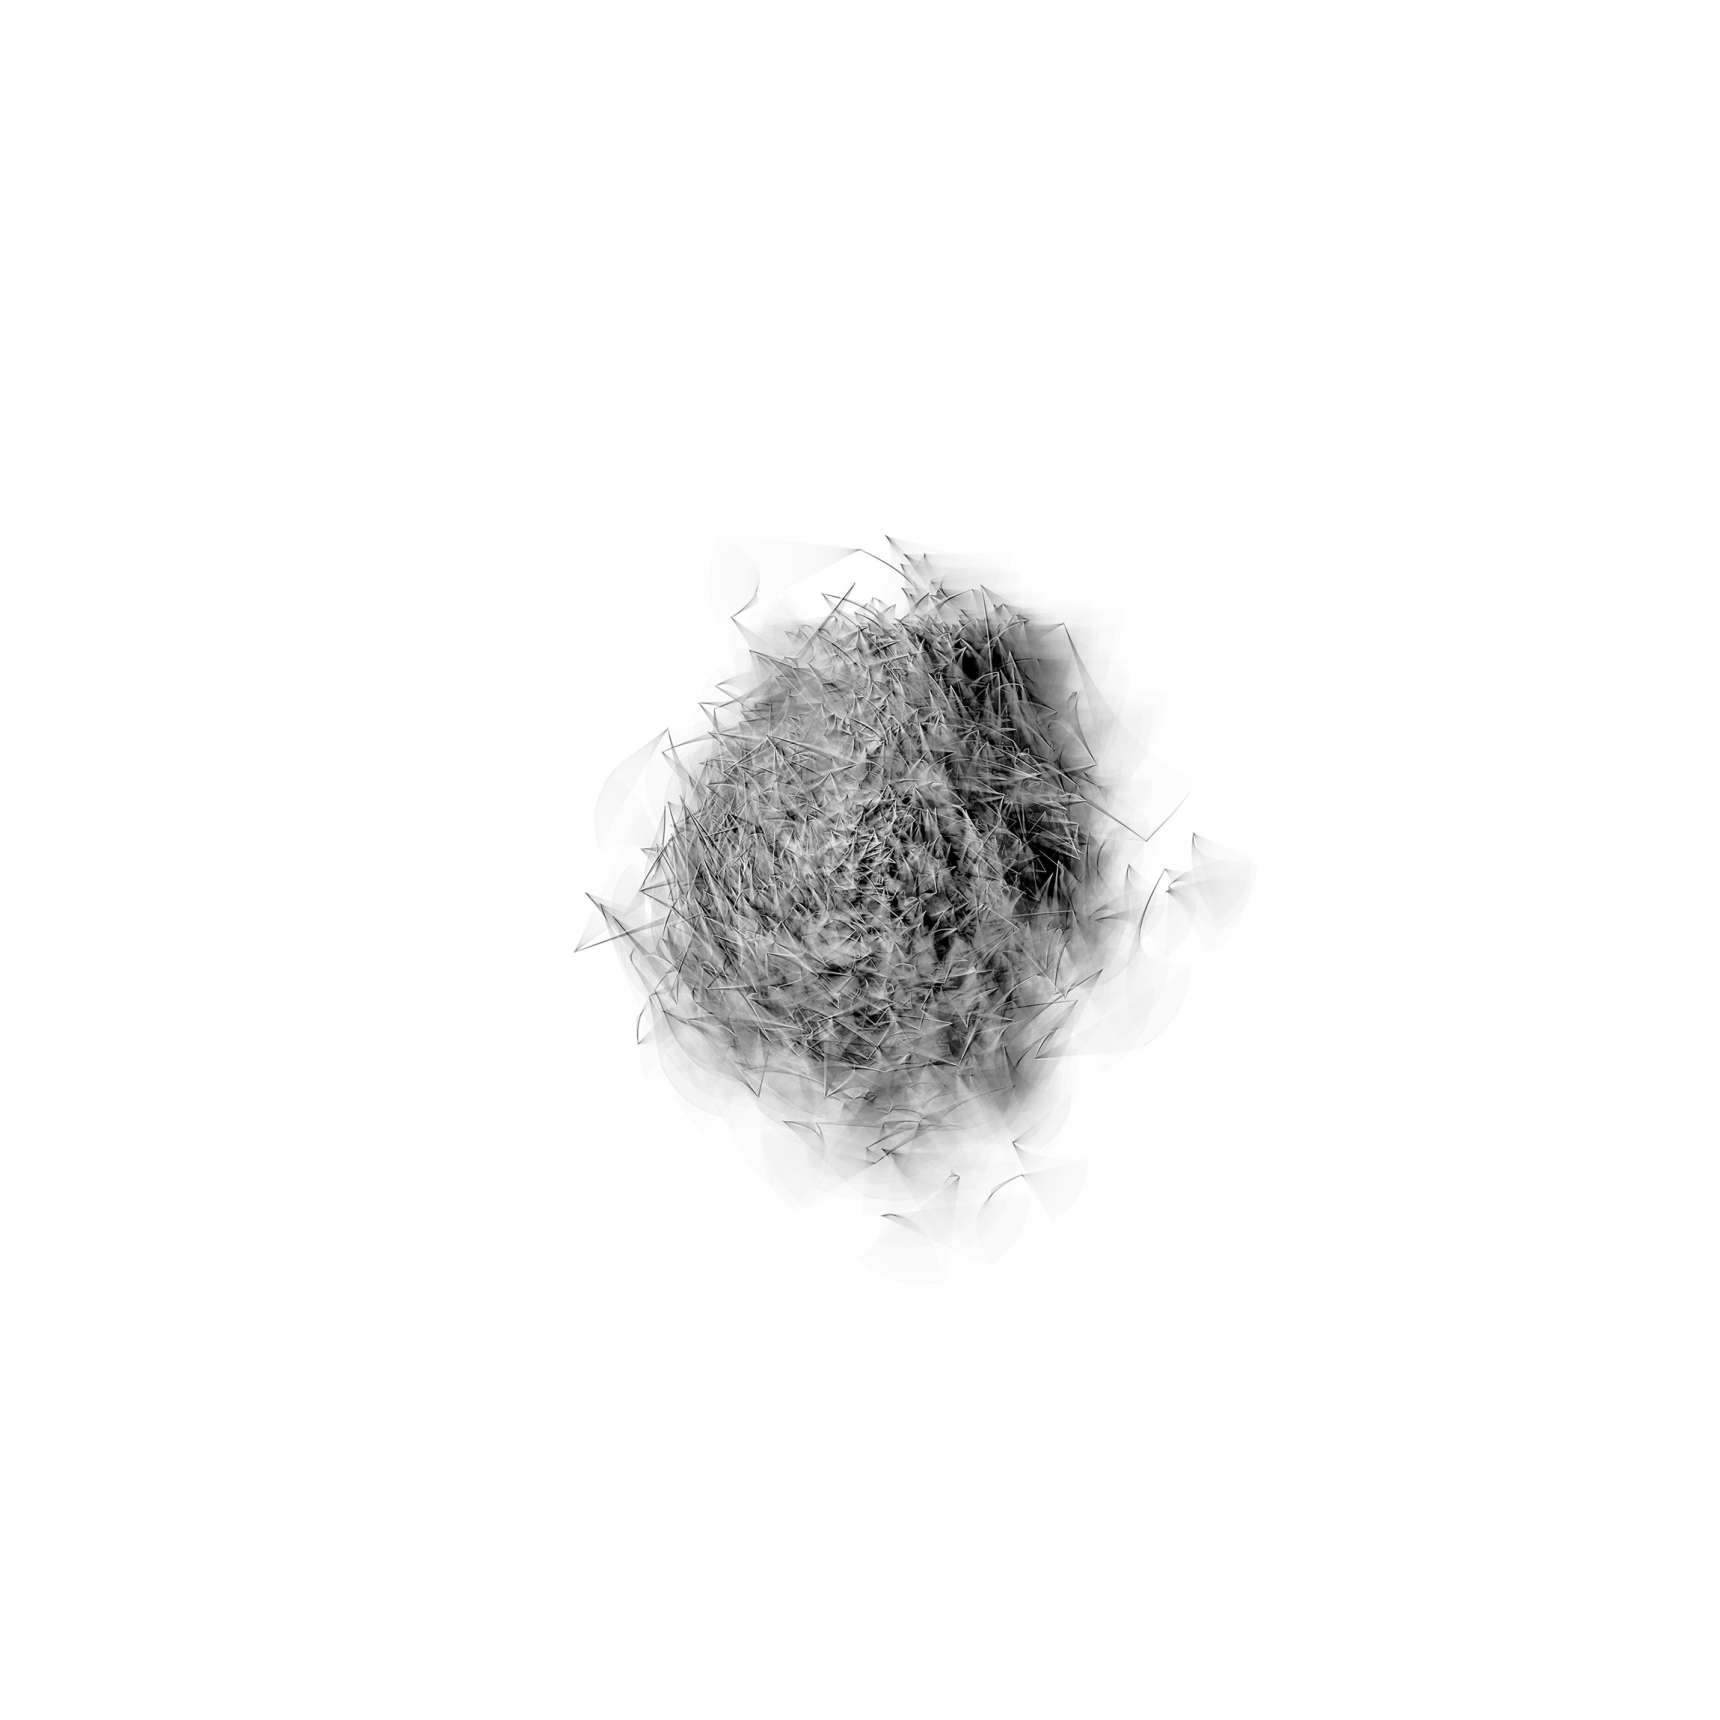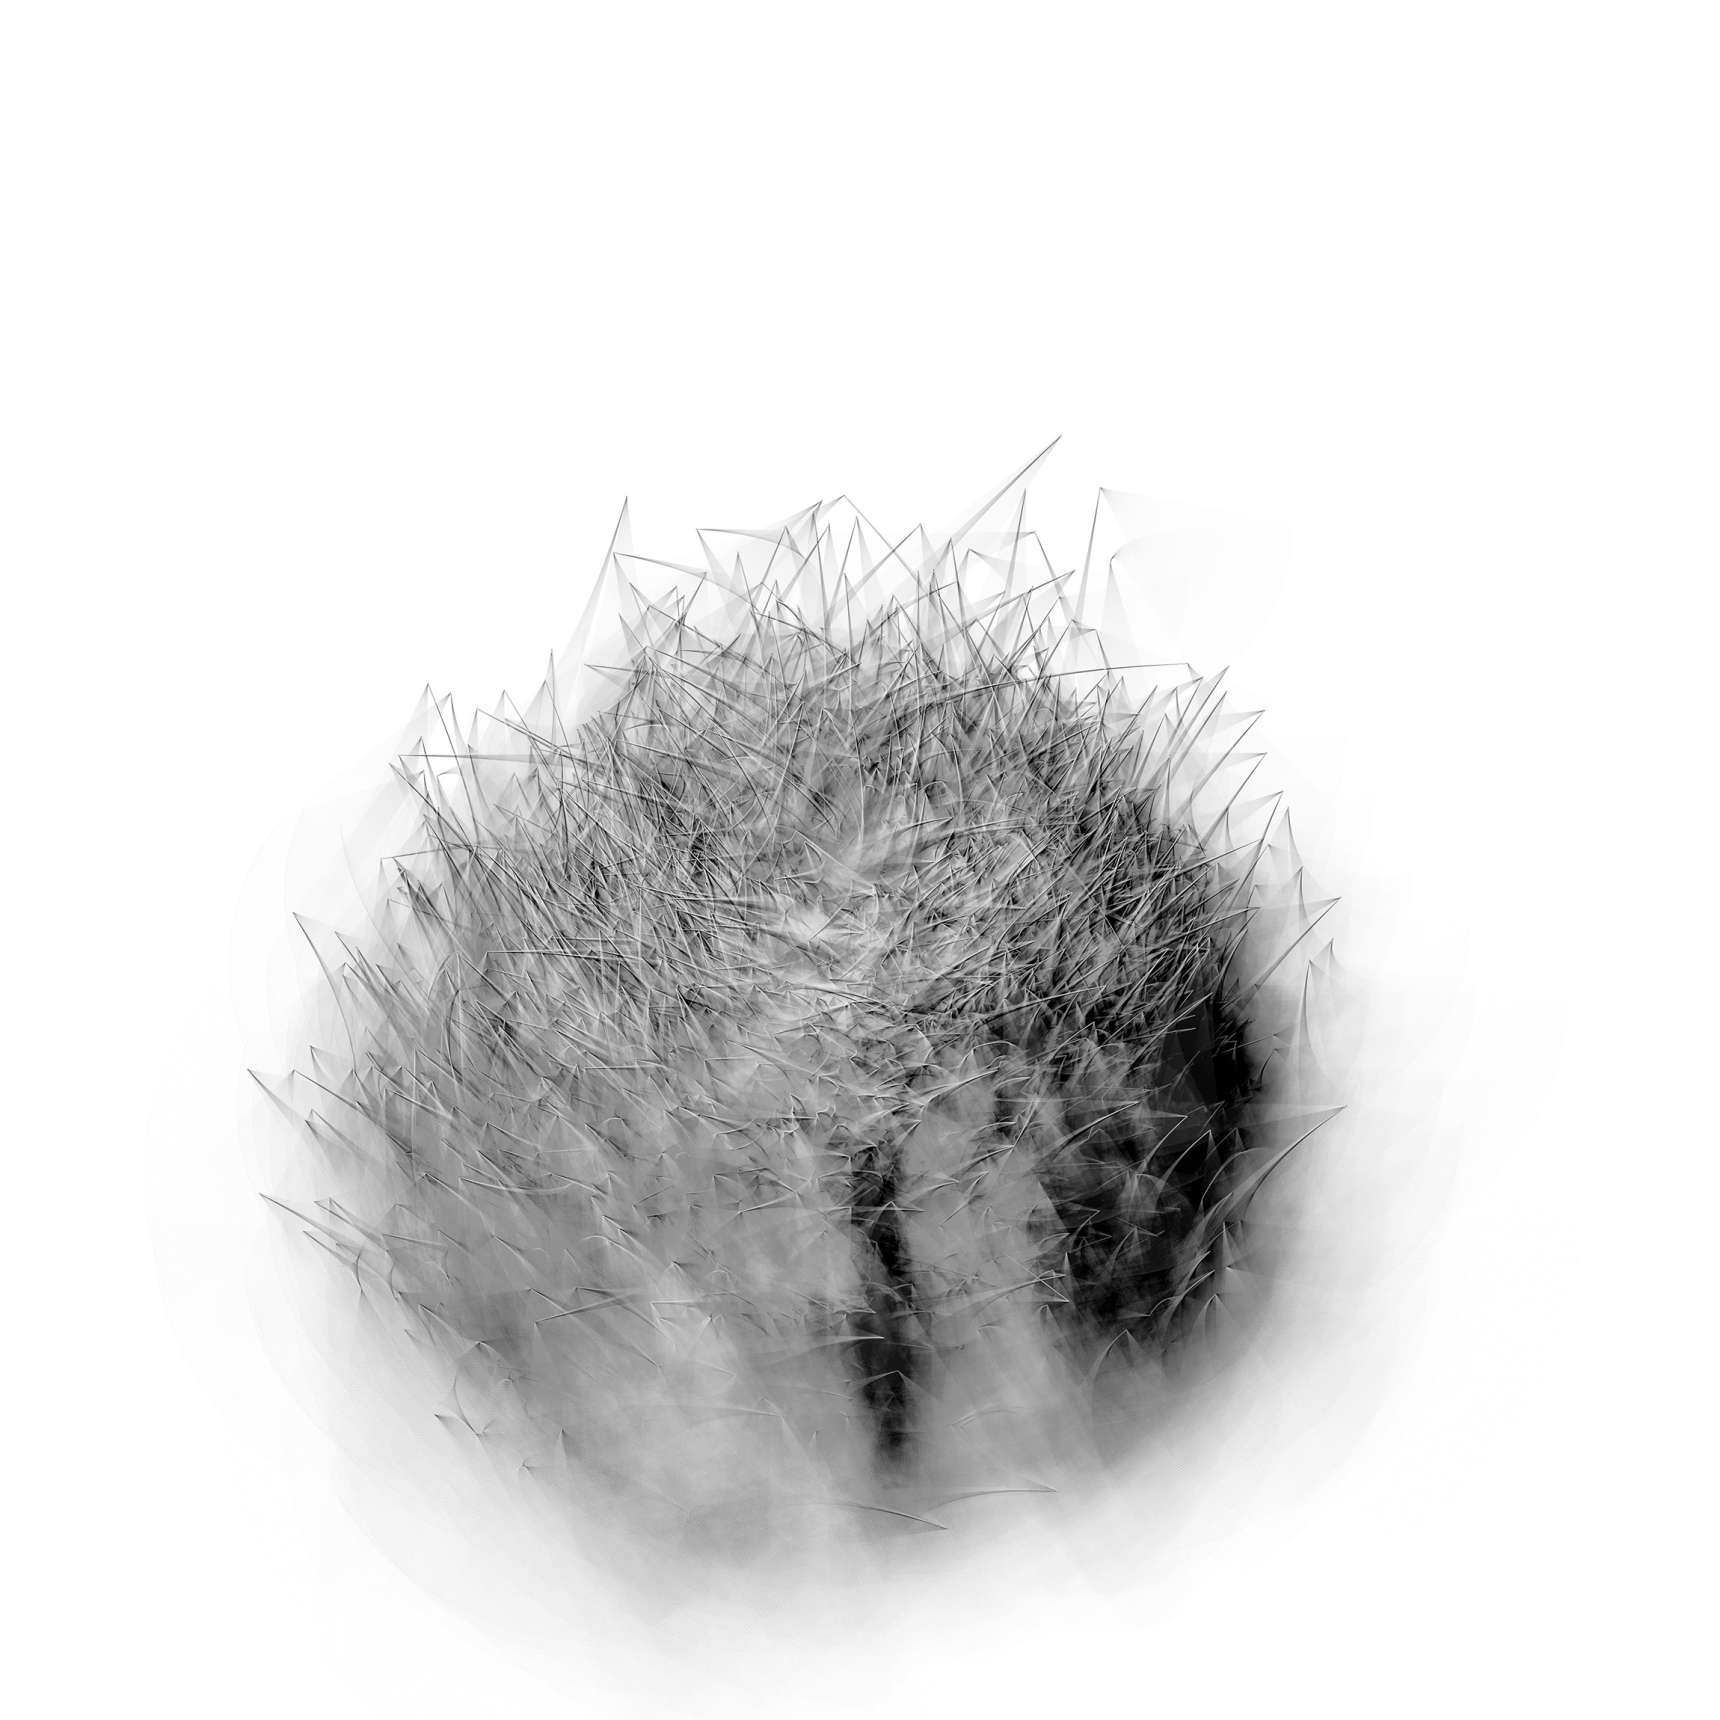
Winds.Process.2009.01
In 2009, I was invited to be a guest interpreter for SP Weather Station, an interdisciplinary project based in New York that collects weather data and organizes weather-related publications, events, and exhibitions while maintaining a rooftop weather station. SPWS interpreters work with weather data collected over a month.
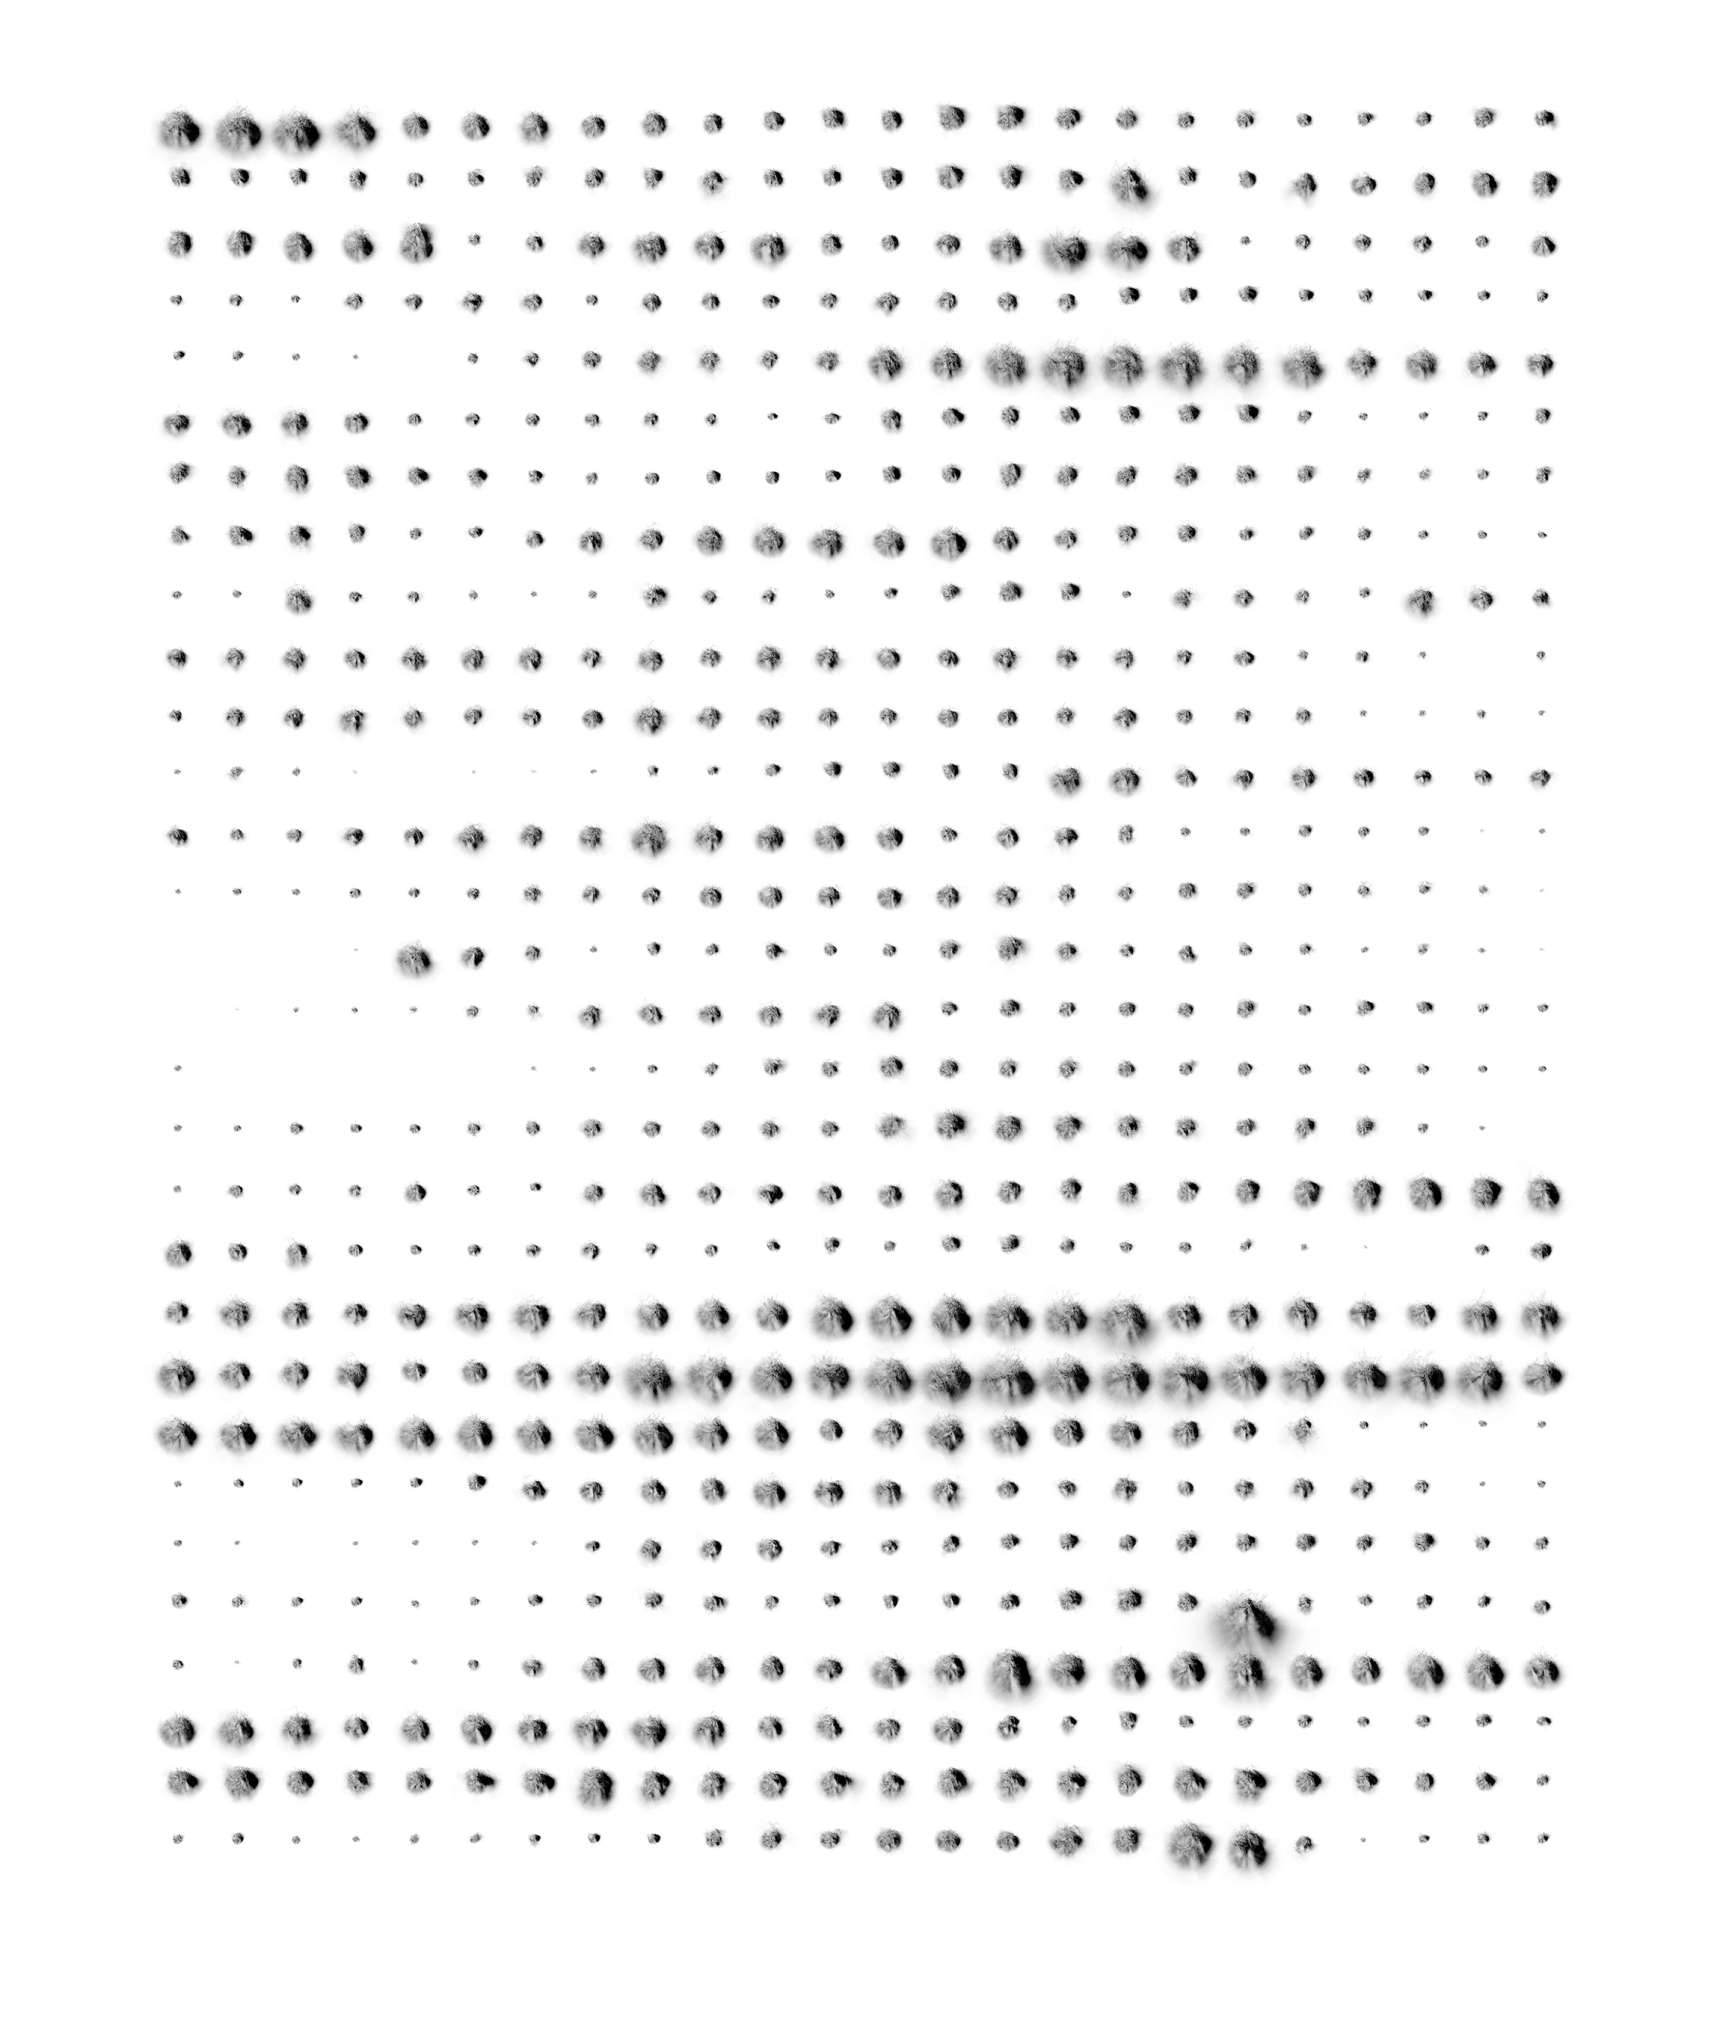
SPWS was not able to collect wind data at a rate that would yield the detail I wanted so I set up my own equipment to collect wind data. A wind vane and anemometer fed data into a Basic Stamp microcontroller connected to a computer. Data was collected once a second for the entire month of June.
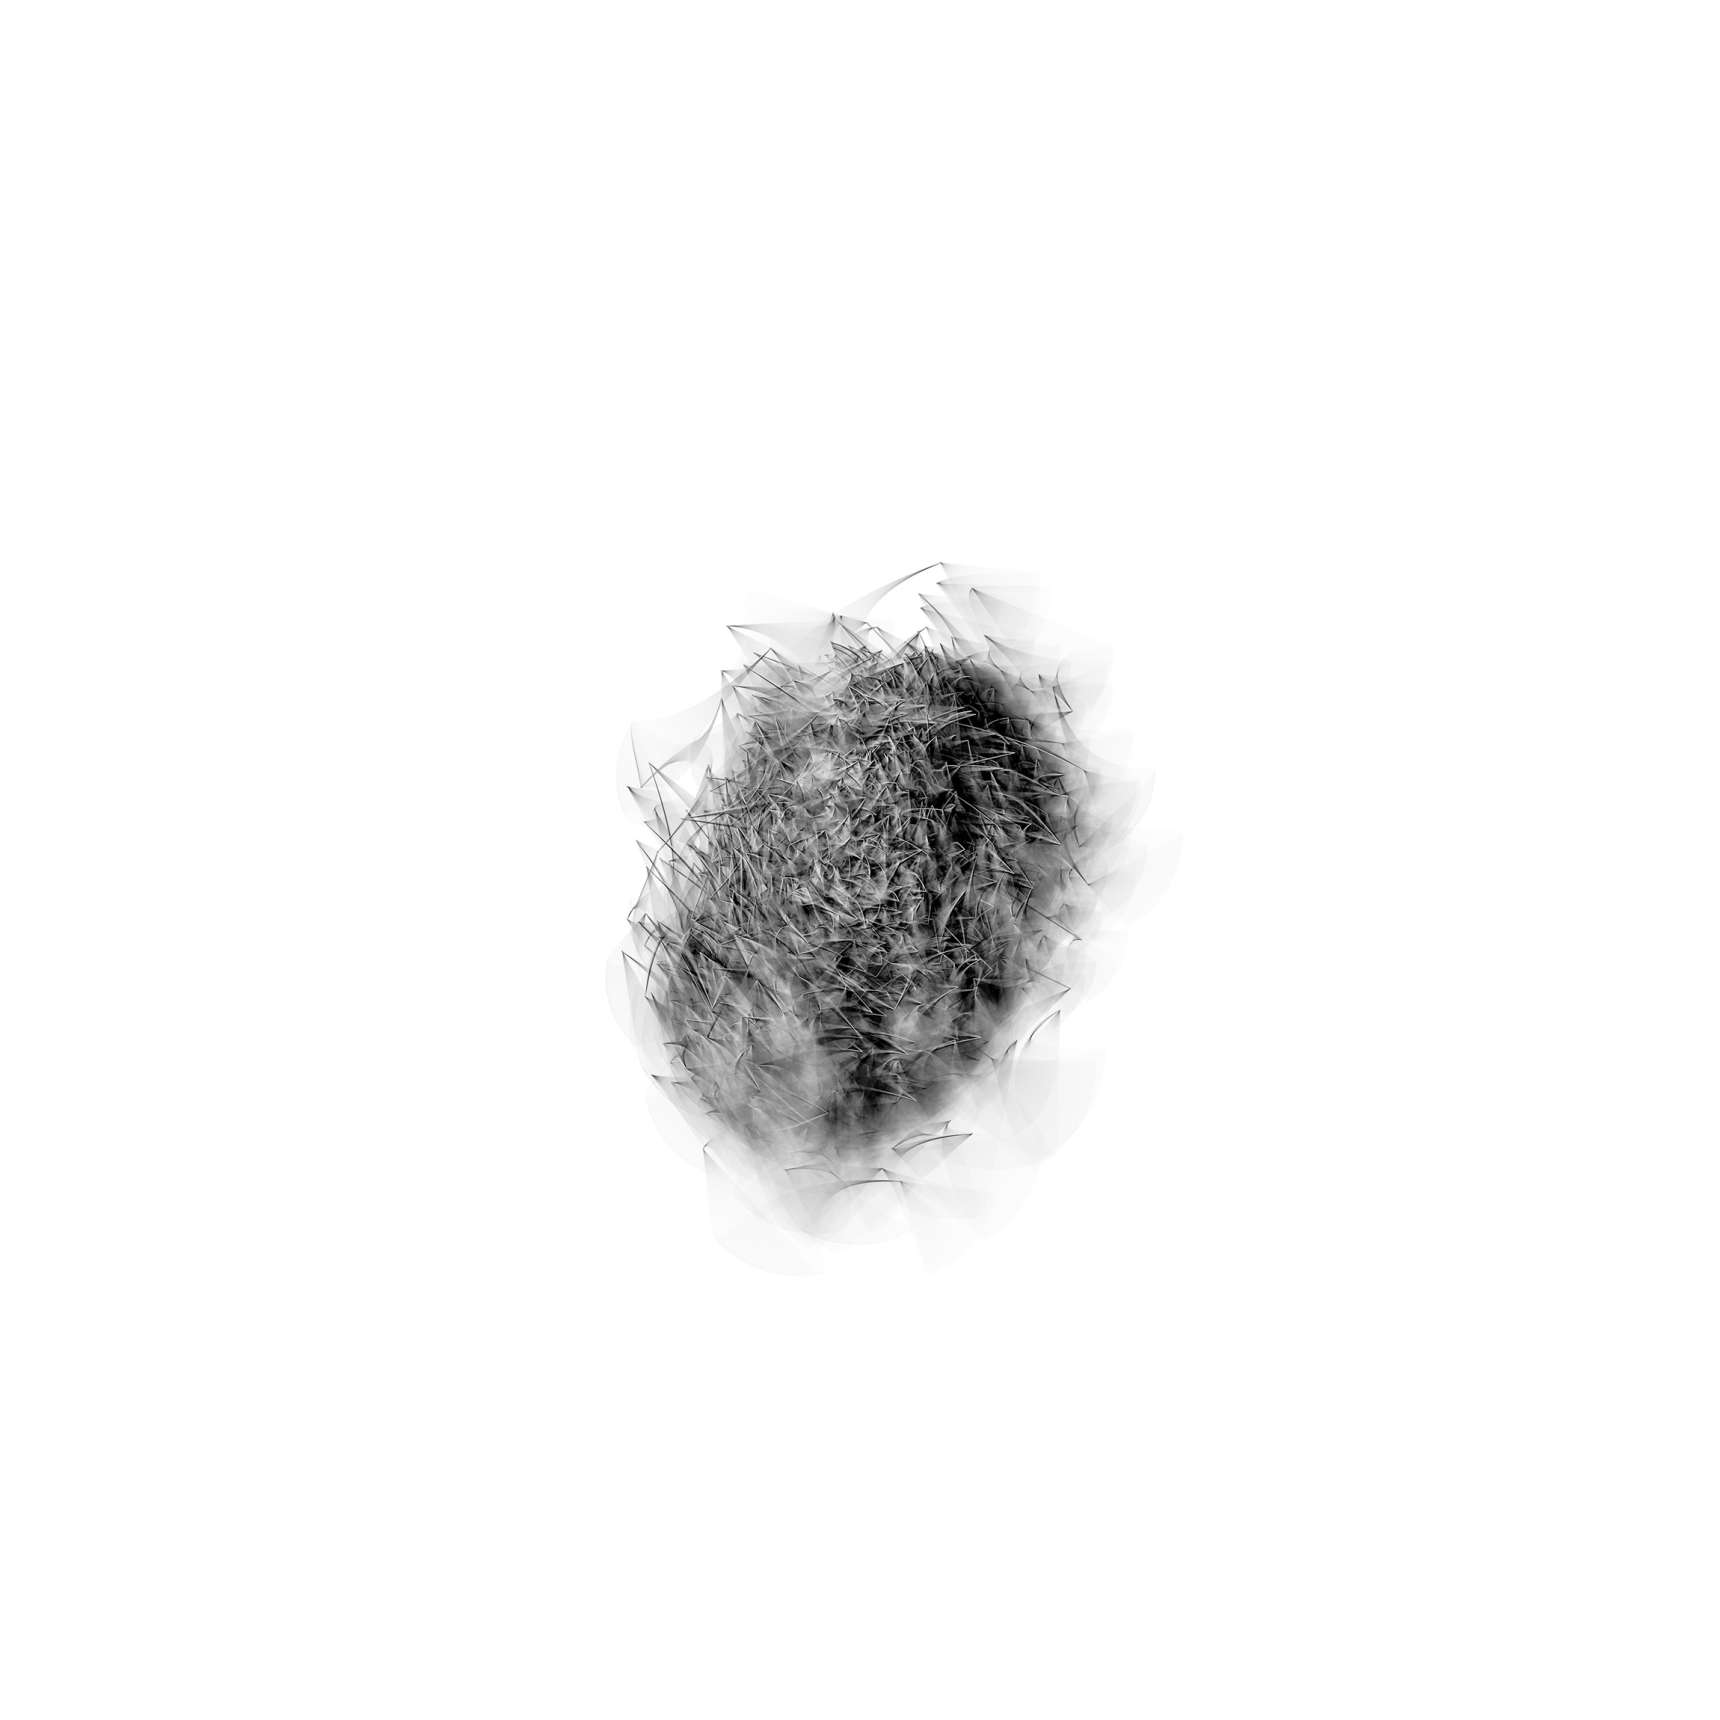
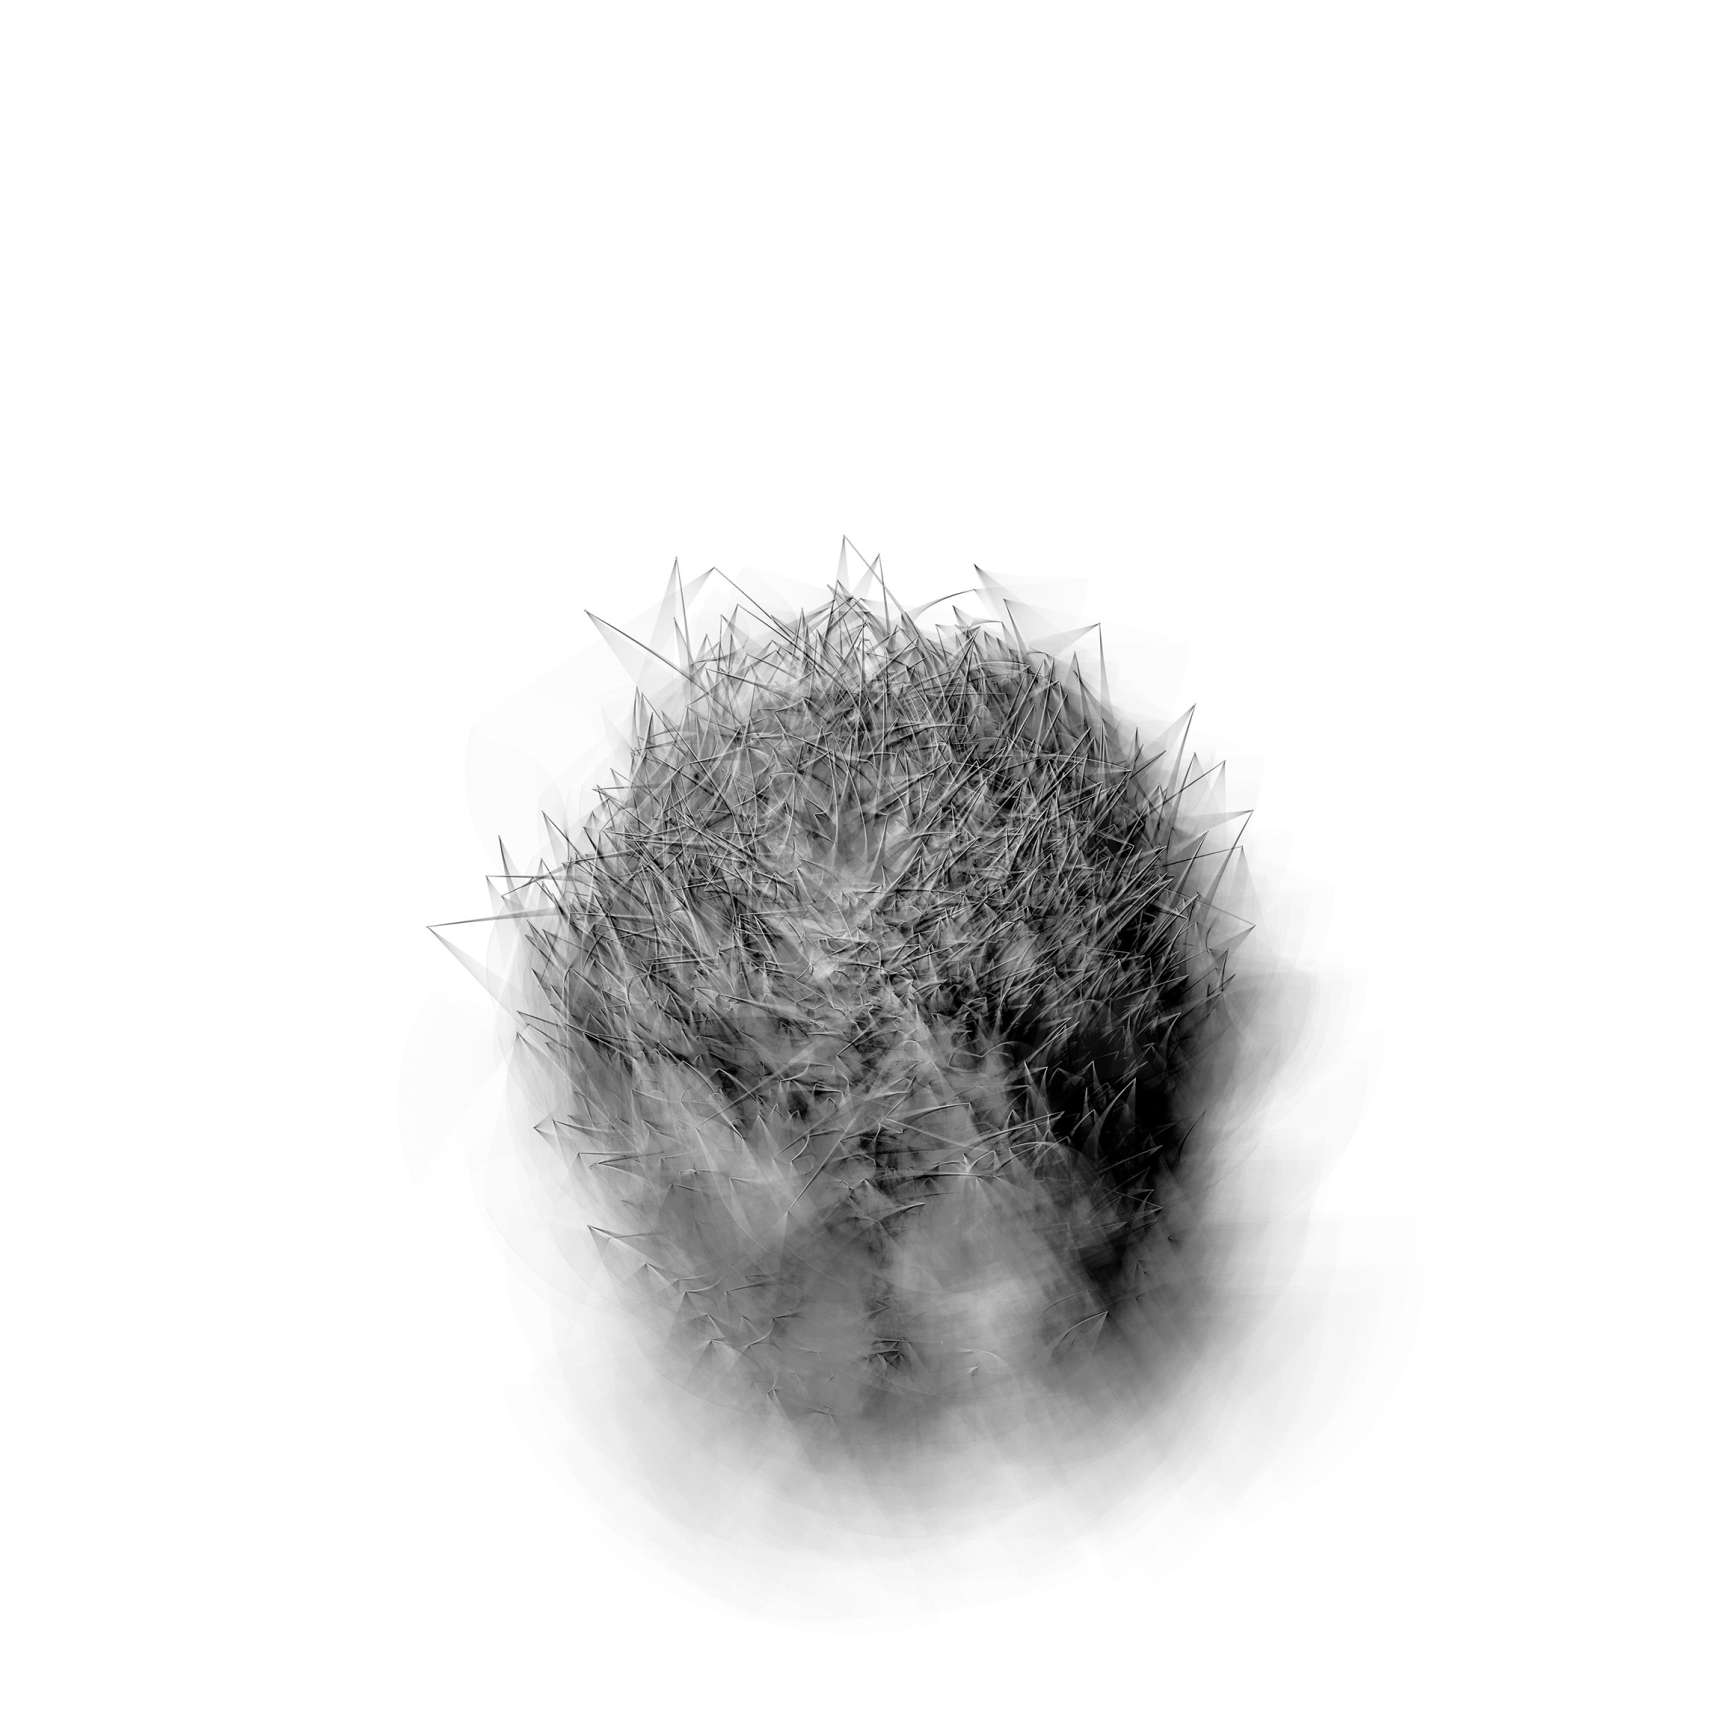
The drawing process starts by using data collected in the first second of the day to locate a point around the center of the drawing. This point is “pushed” away from the center by wind conditions at the time the data was collected. Winds from the east, for example, “push” the point left. Faster wind speeds move the point a greater distance from the center. A location for the next second is determined and a series of lines are drawn between each point. This process continues until all of the day’s data has been interpreted.
Digital copies of my drawings along with three prints were included in the SPWS 2009 portfolio. Five 20-inch prints drawings were also produced for a show at ahn|vhs in Philadelphia. A review of the show by Roberta Fallon appeared in Philadelphia Weekly.